Section 1: Introduction
Inflation Report Coverage:
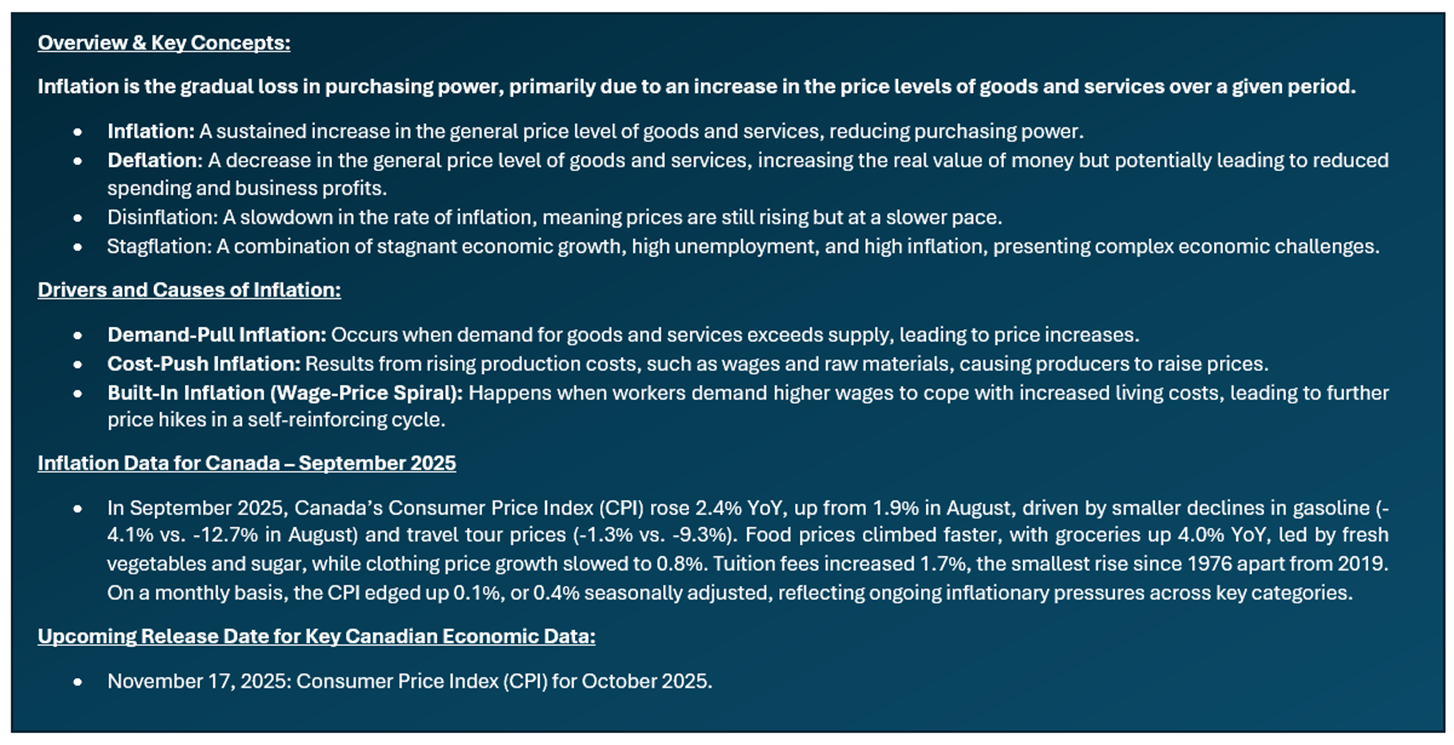
- Inflation report highlights how inflation impacts sectors differently, favoring value and defensive sectors like Energy, Materials, Consumer Staples, Healthcare, Utilities, select Financials, and REITs with inflation-indexed leases, while rate-sensitive sectors like Consumer Discretionary and high-growth Tech typically underperform.
- The report focuses on companies with proven business models, steady financials, high free cash flow, and solid ROE that can pass on costs to customers and protect margins. The aim is to identify stocks that can outperform inflation via capital gains and dividends, supporting diversified sectoral exposure.
Stocks Covered:
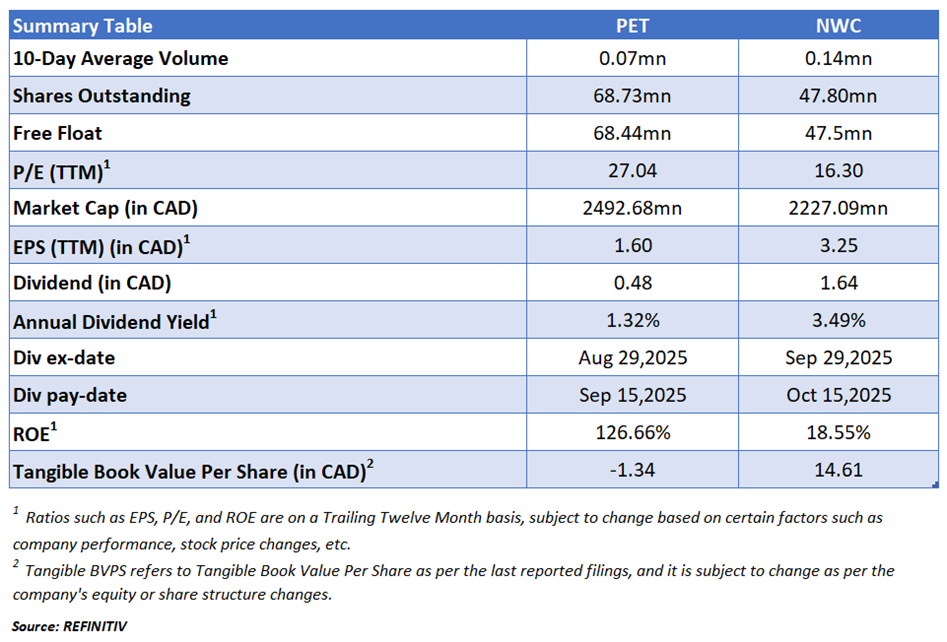
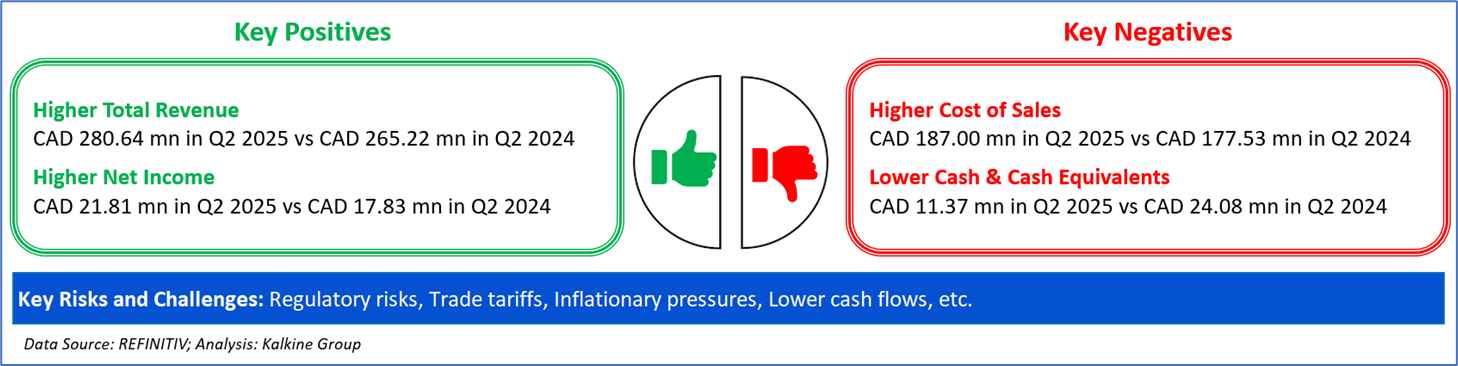
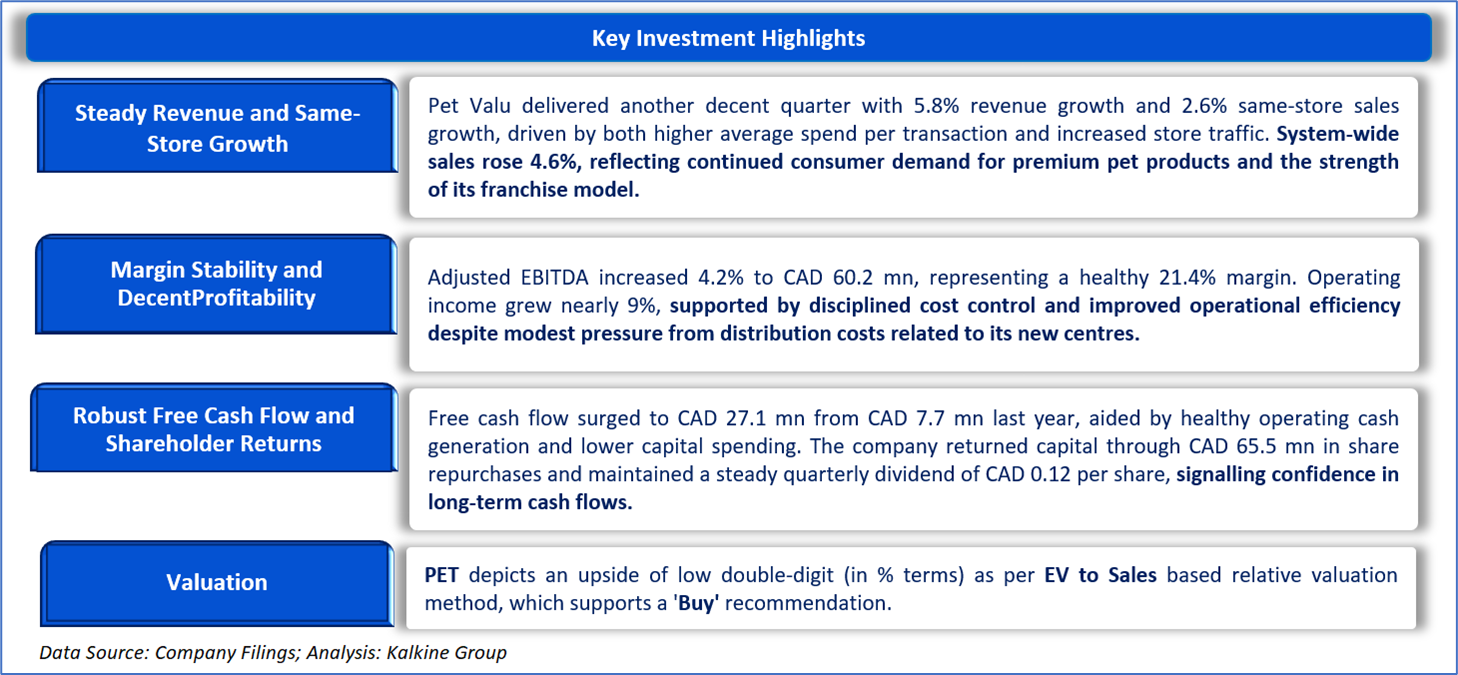
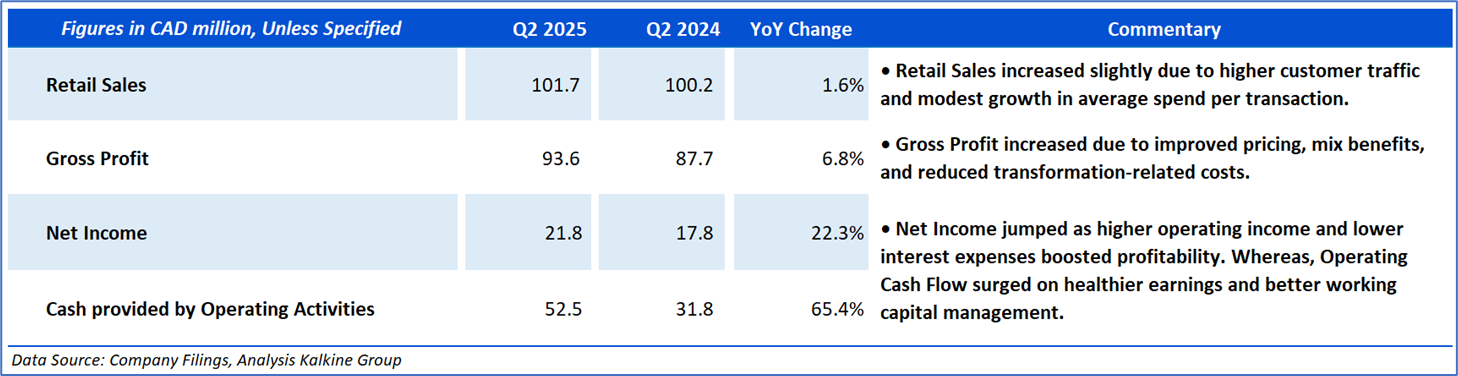
- Pet Valu Holdings Ltd. (TSX: PET) delivered healthy Q2 2025 results, with revenue rising 5.8% to CAD 280.6 million and net income climbing 22% to CAD 21.8 million. The company showed steady sales growth, improved profitability, and decent cash generation, supported by resilient pet care demand and an efficient franchise network
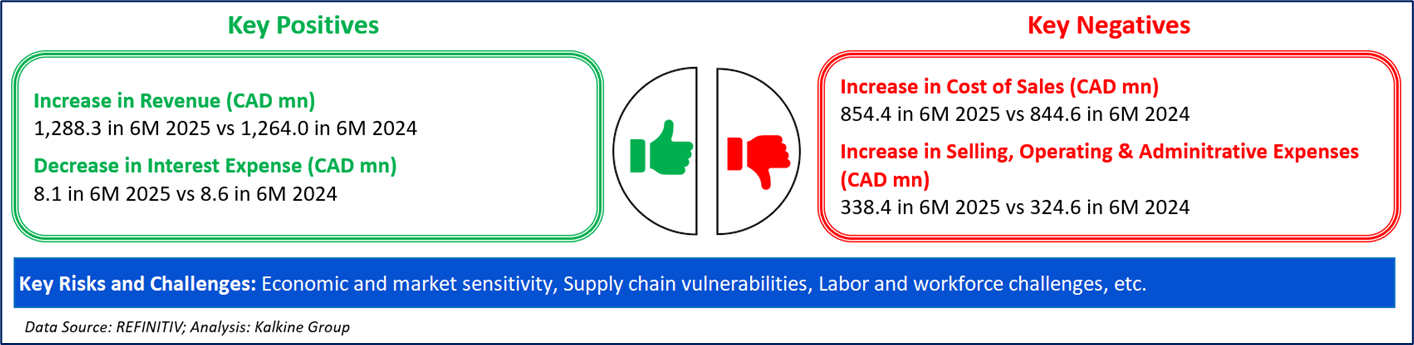
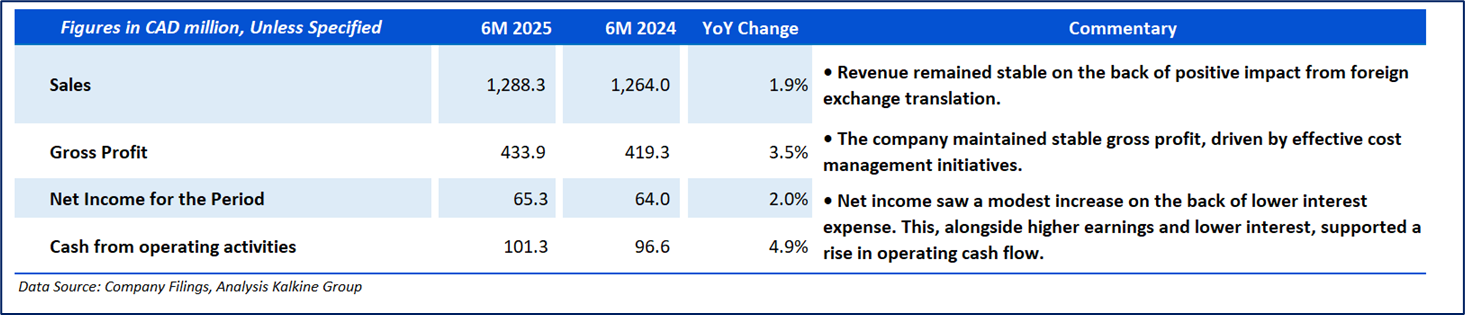
- North West Company Inc. (TSX: NWC) reported decent 6M 2025 results, achieving sales over CAD 600 million and Net Income of nearly CAD 37 million. The company demonstrated resilience and effective cost control in the face of ongoing inflationary pressures.
Section 2: Company Overview
Pet Valu Holdings Ltd (TSX: PET) is engaged in providing pet-related products through its stores. Its products include Dry Food, Wet Food, Frozen raw food, Jerky Treats, and Training treats among others. The services offered by the company include Dog Wash, Adoption, Grooming, and Frozen Raw.
Kalkine’s Inflation Report covers the Investment Highlights, Key Financial Metrics, Risks, Technical Analysis along with the Valuation, Target Price, and Recommendation on the stock.

Section3: Financial Highlights

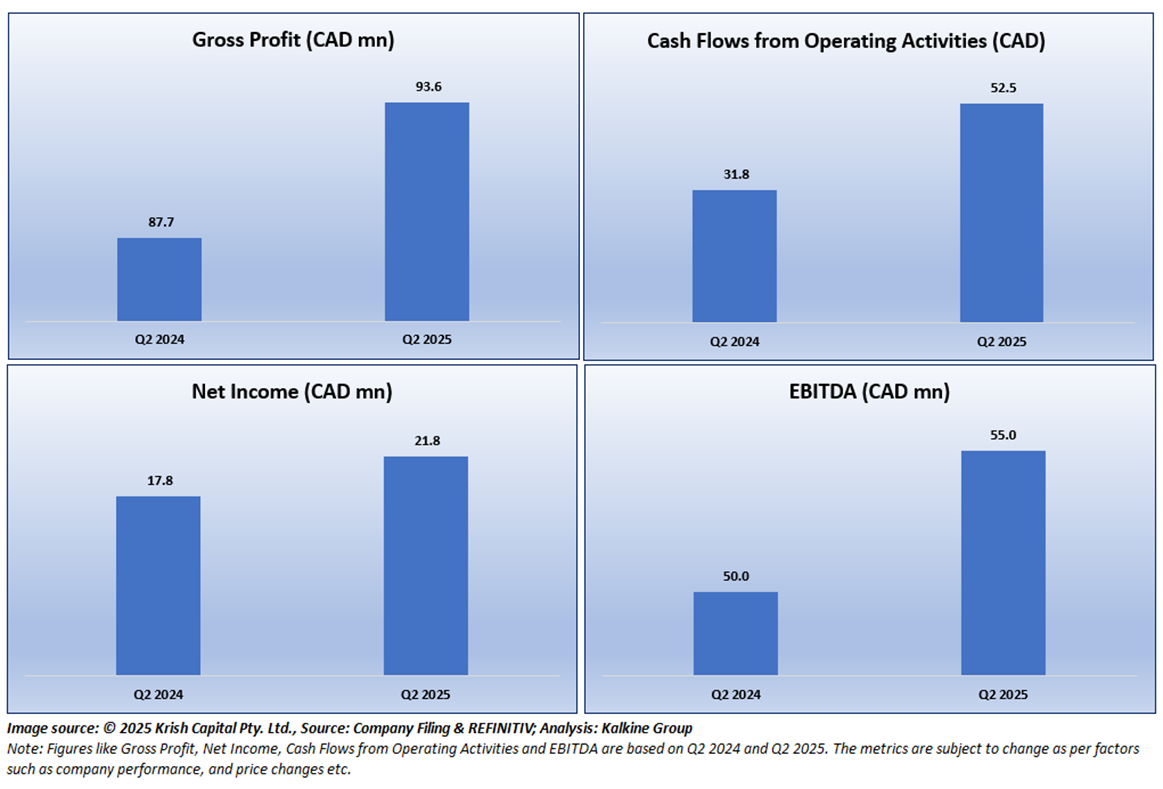
Section 4: Key Metrics
Below chart depicts the change in Gross Profit, Net Income, Cash Flows from Operating Activities and EBITDA of the Company for Q2 2024 and Q2 2025.
Section 5: Stock Recommendation Summary

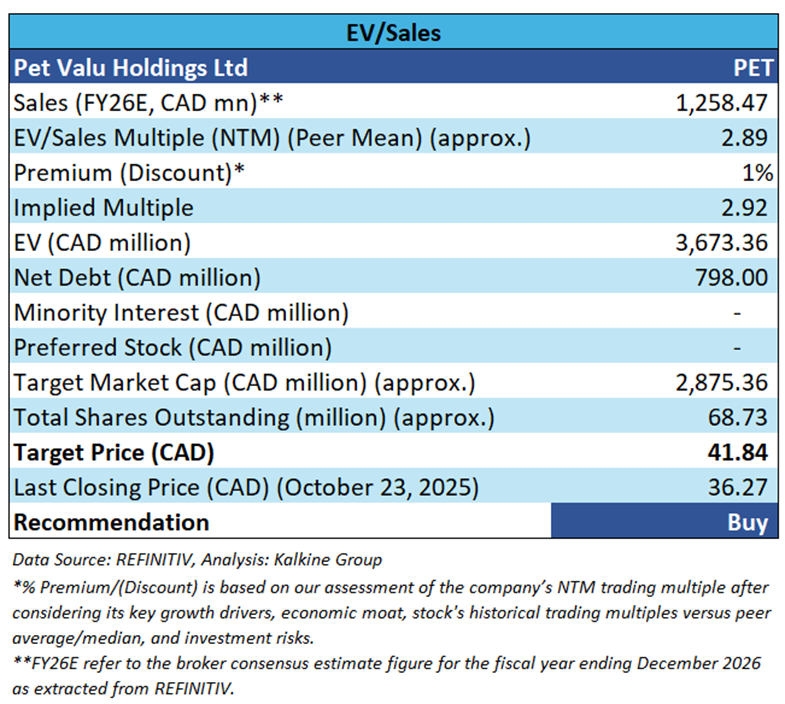
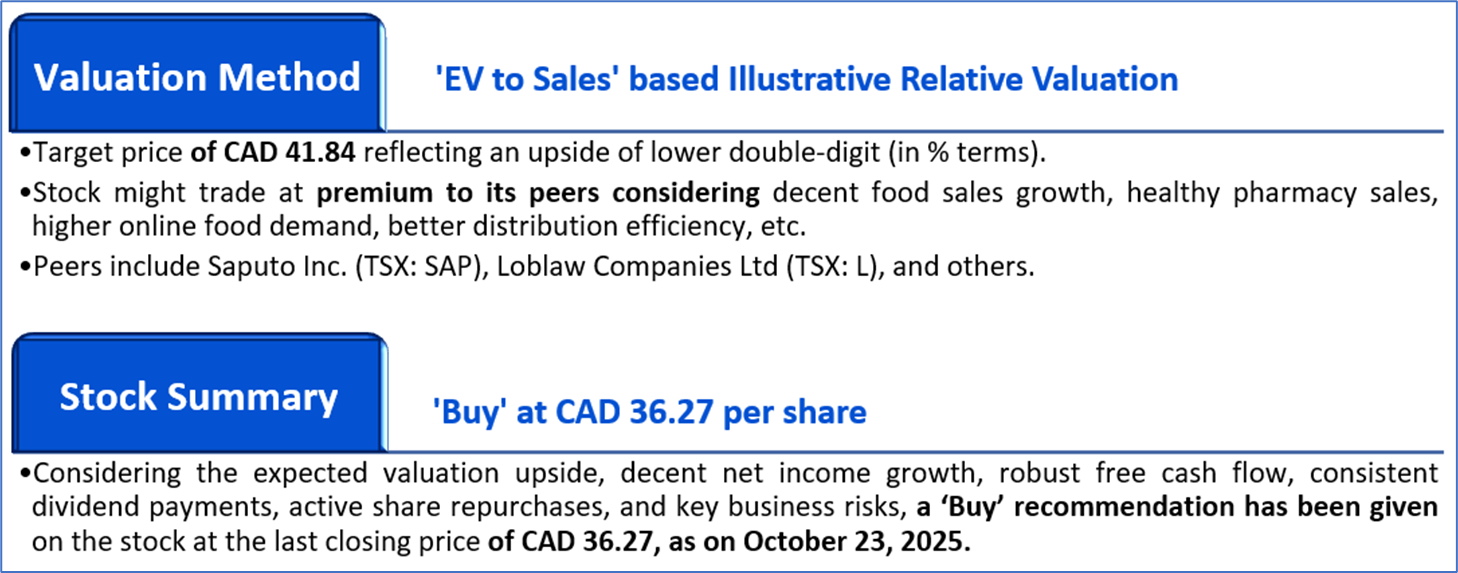
Valuation Methodology: EV to Sales Multiple Based Relative Valuation (Illustrative):


The stock has witnessed an upside of ~3.95% and ~34.18% over the last 1 week and 6 months respectively. Moreover, it is trading above the average 52-week high price of CAD 39.24 and 52-week low price of CAD 22.53, providing an opportunity to ride the trend.

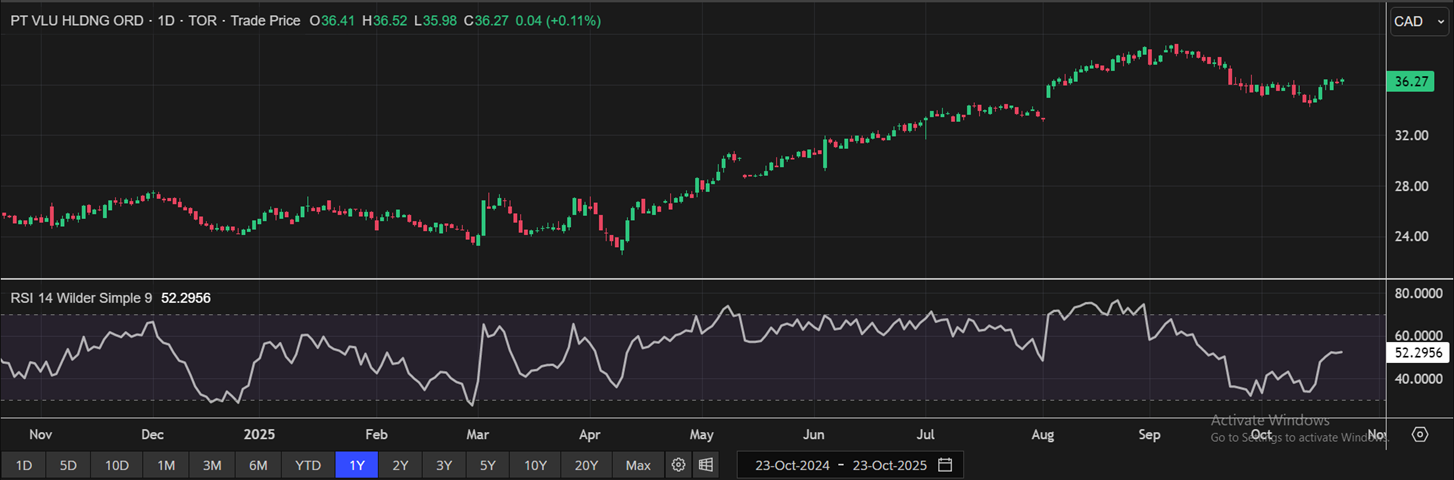
One-Year Technical Price Chart (as of October 23, 2025). Source: REFINITIV, Analysis: Kalkine Group

Section 2: Company Overview
North West Company Inc. (TSX: NWC) is a Canada-based company that is principally engaged in retail business in underserved rural communities and urban neighborhoods. The company provides food, family apparel, housewares, appliances, and outdoor products, with food products accounting for the majority of the company's revenue. The company also offers services, including post offices, income tax return preparation, money transfers, commercial business sales, and others. Its geographical segment includes Canada and International. The company generates maximum revenue from Canada.
Kalkine’s Inflation Report covers the Investment Highlights, Key Financial Metrics, Risks, Technical Analysis along with the Valuation, Target Price, and Recommendation on the stock.

Section3: Financial Highlights

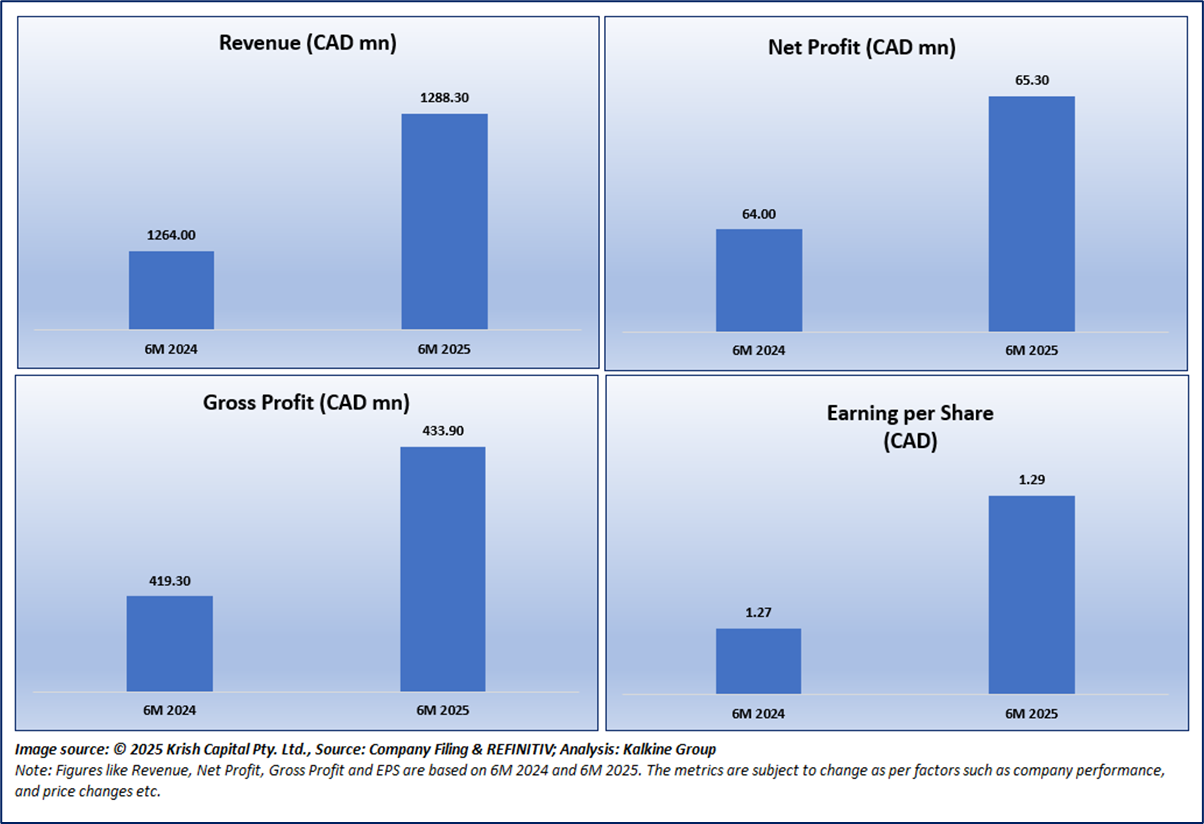
Section 4: Key Metrics
Below chart depicts the changes in Revenues, Net Profit, Gross Profit, Earning per share and of the Company for 6M 2024 and 6M 2025.
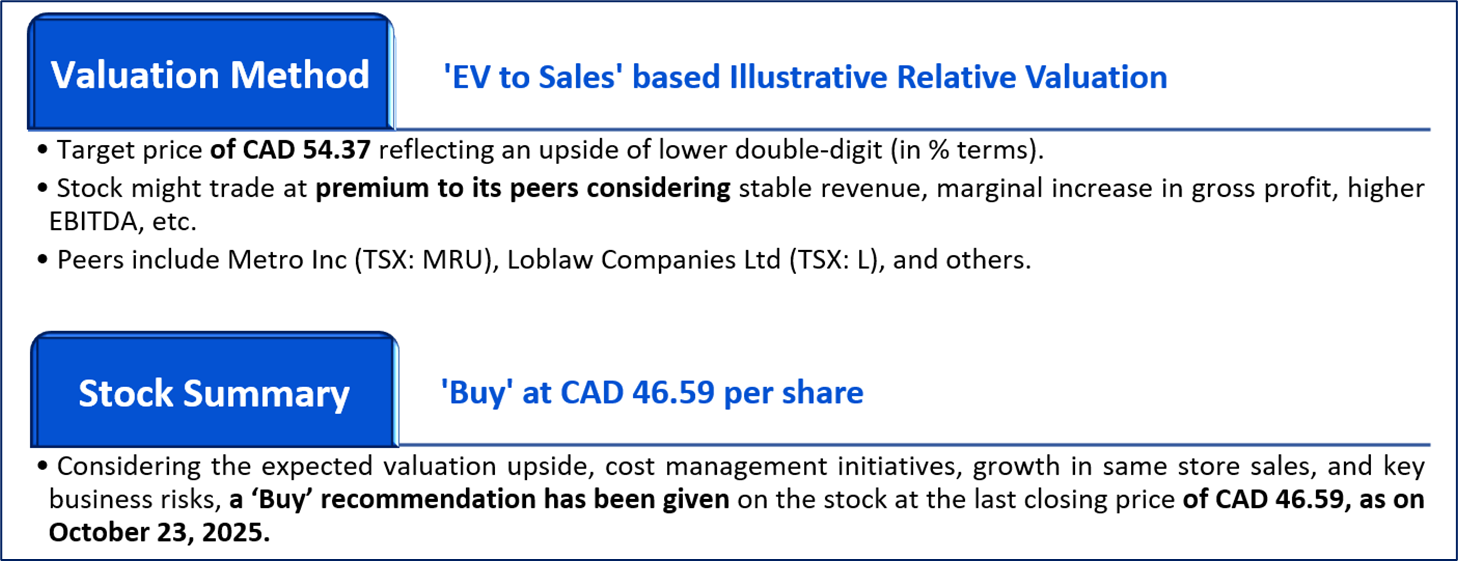
Section 5: Stock Recommendation Summary

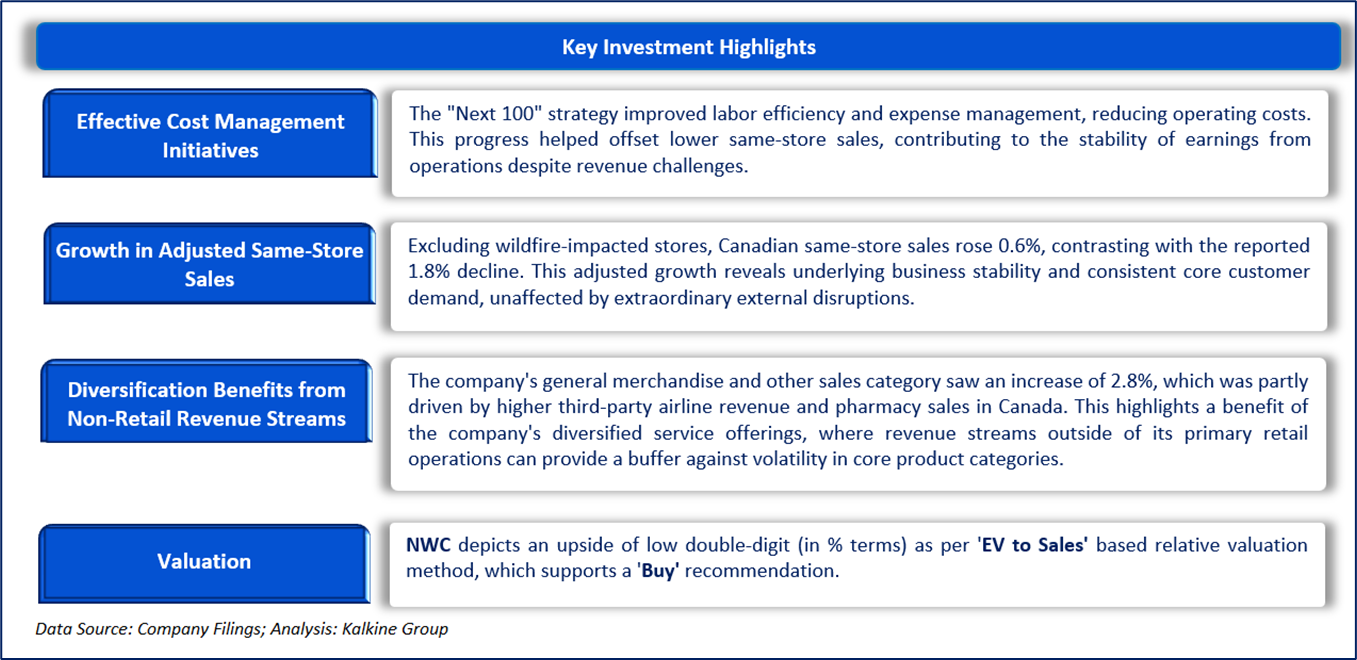
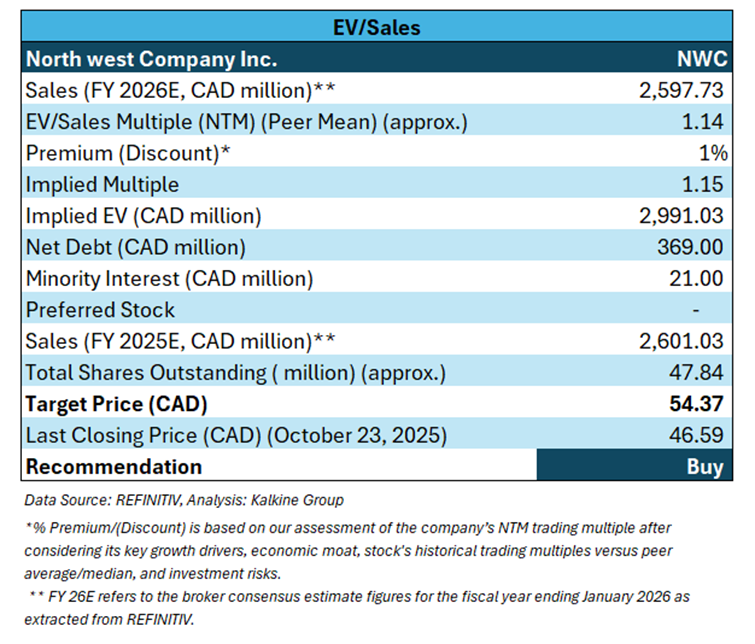
Valuation Methodology: EV to Sales Multiple Based Relative Valuation (Illustrative):


The stock has witnessed an upside of ~0.56% and of ~0.75% over the last 1 week and 3 months respectively. Moreover, it is trading below the average 52-week high price of CAD 57.95 and 52-week low price of CAD 44.48, providing an opportunity to accumulate stock.

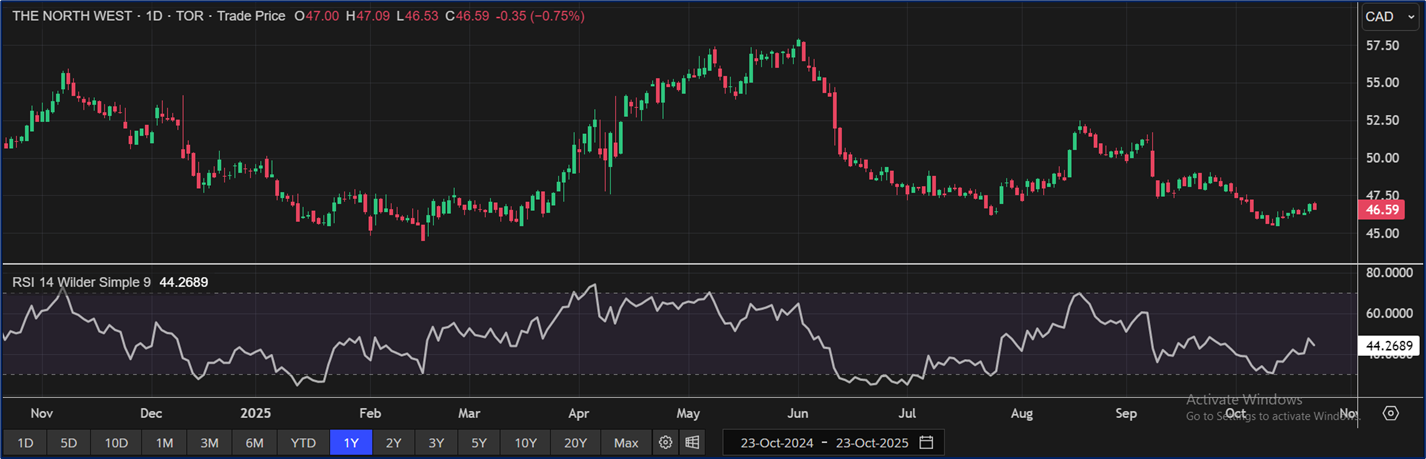
One-Year Technical Price Chart (as of October 23, 2025). Source: REFINITIV, Analysis: Kalkine Group

Note 1: Past performance is not a reliable indicator of future performance.
Note 2: The reference date for all price data, currency, technical indicators, support, and resistance levels is October 23, 2025. The reference data in this report has been partly sourced from REFINITIV.
Note 3: Investment decisions should be made depending on an individual's appetite for upside potential, risks, holding duration, and any previous holdings. An 'Exit' from the stock can be considered if the Target Price mentioned as per the Valuation and or the technical levels provided has been achieved and is subject to the factors discussed above.
Note 4: Dividend Yield may vary as per the stock price movement.
Note 5: Kalkine reports are prepared based on the stock prices captured either from REFINITIV or Trading View. Typically, REFINITIV or Trading View may reflect stock prices with a delay which could be a lag of 25-30 minutes. There can be no assurance that future results or events will be consistent with the information provided in the report. The information is subject to change without any prior notice.
Technical Indicators Defined: -
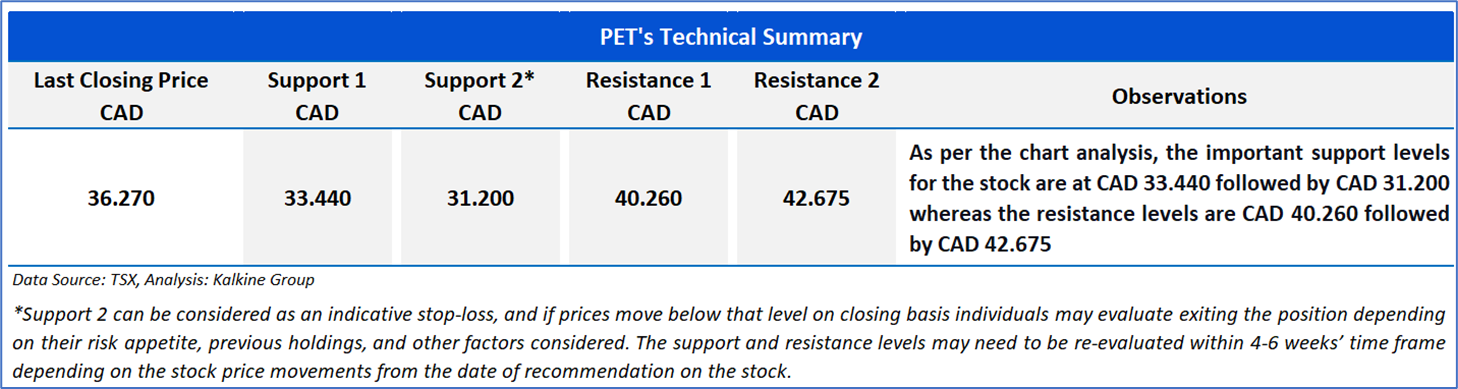
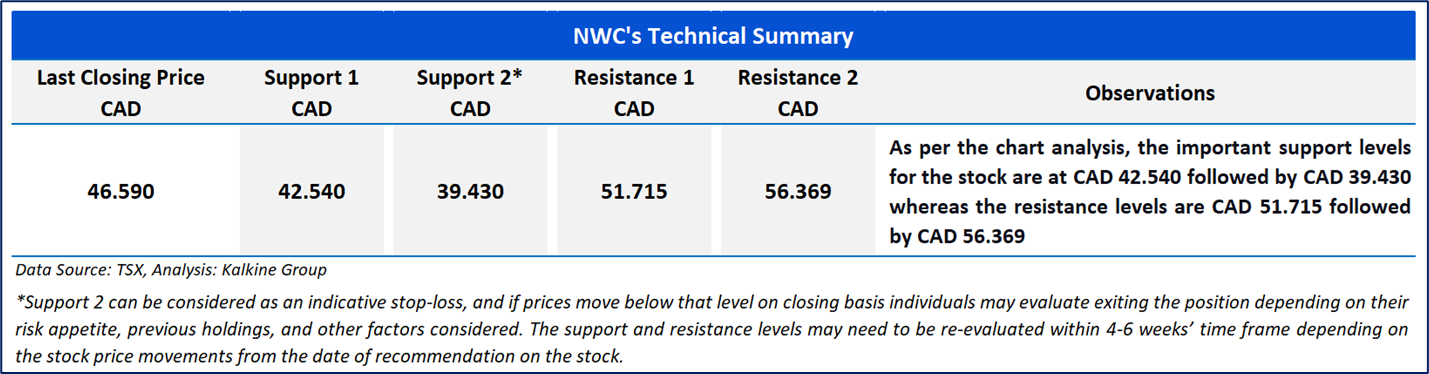
Support: A level at which the stock prices tend to find support if they are falling, and a downtrend may take a pause backed by demand or buying interest.
Resistance: A level at which the stock prices tend to find resistance when they are rising, and the uptrend may take a pause due to profit booking or selling interest.
Stop-loss: In general, it is a level to protect further losses in case of any unfavourable movement in the stock prices.
Past performance is not a reliable indicator of future performance.

 Please wait processing your request...