Section 1: Company Fundamentals
1.1 Company Overview and Performance summary
Company Overview:
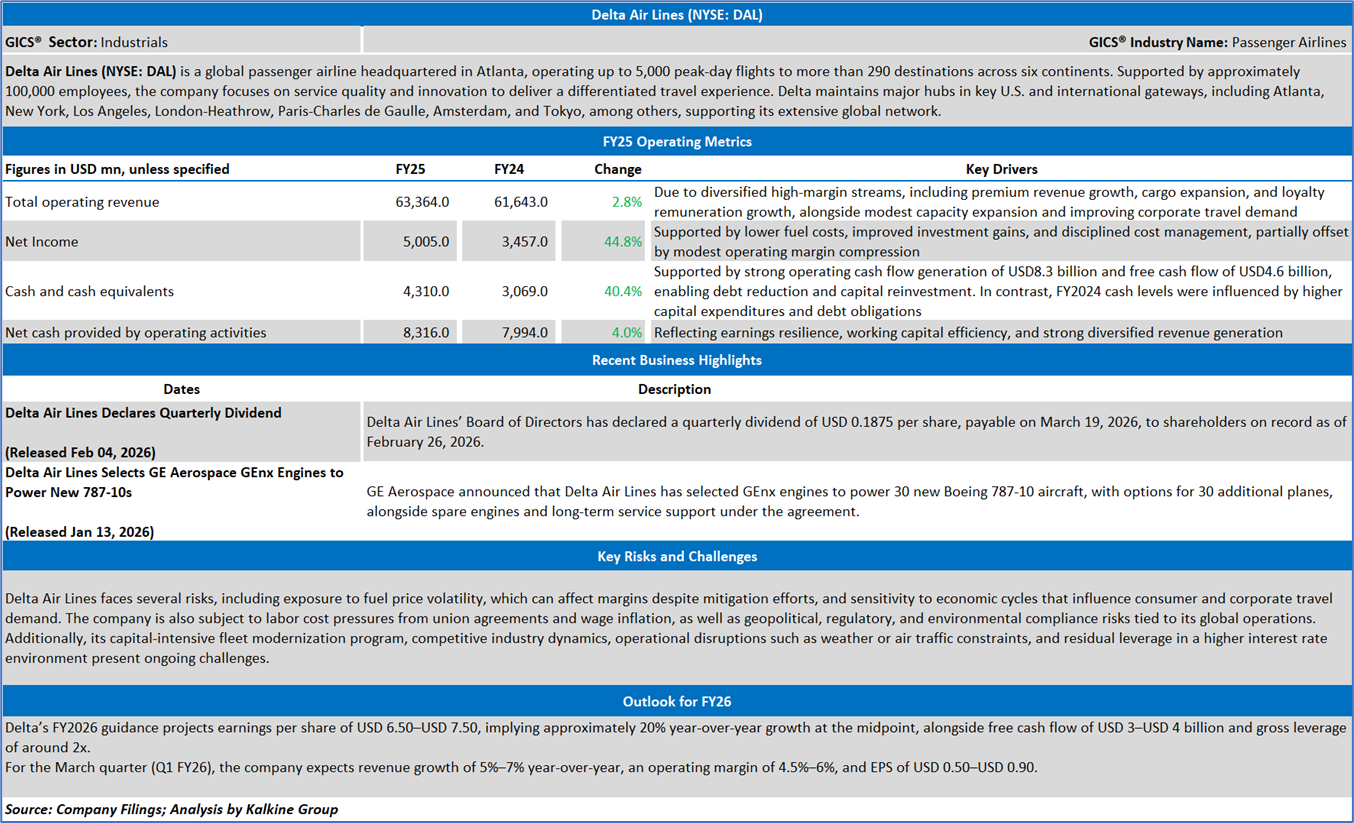
Delta Air Lines (NYSE: DAL) is a global passenger airline headquartered in Atlanta, operating up to 5,000 peak-day flights to more than 290 destinations across six continents. Supported by approximately 100,000 employees, the company focuses on service quality and innovation to deliver a differentiated travel experience. Delta maintains major hubs in key U.S. and international gateways, including Atlanta, New York, Los Angeles, London-Heathrow, Paris-Charles de Gaulle, Amsterdam, and Tokyo, among others, supporting its extensive global network.
This US Inflation Report covers the Company Overview & Price performance, Summary table, Key positives & negatives, Key metrics, Company details, technical guidance & Stock recommendation, and Price chart.
Price Performance:
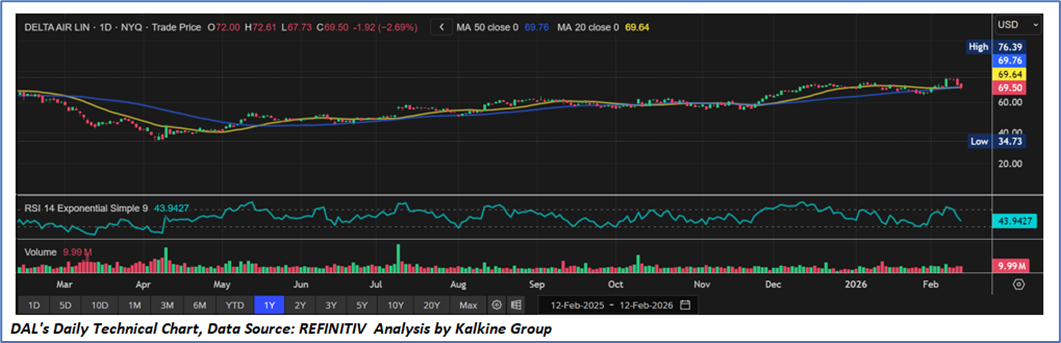
- Trend Structure: The stock has formed a pattern of higher lows and moderately higher highs over the past year. Price has largely traded above the 20-day (USD 69.64) and 50-day (USD 69.76) moving averages, reflecting a constructive medium-term trend. Currently consolidating around the moving averages, indicating a potential near-term inflection point.
- Momentum: RSI has cooled from earlier overbought levels and now sits in neutral territory. Momentum is neither oversold nor overbought, suggesting consolidation rather than a strong directional bias. This indicates mild short-term weakening but no confirmed bearish momentum shift.
- Volume Analysis: Volume trends remain stable without significant distribution spikes. Recent pullbacks have not been accompanied by aggressive selling pressure. Suggests orderly consolidation rather than trend reversal
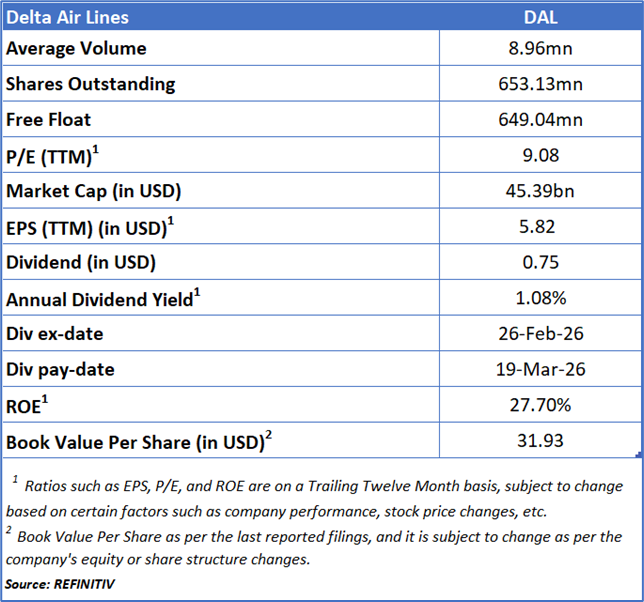
1. 2 Summary Table
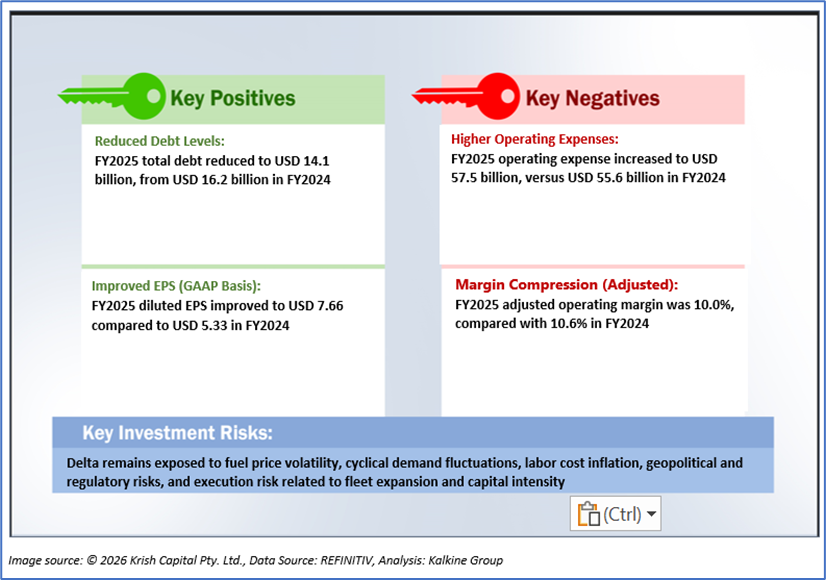
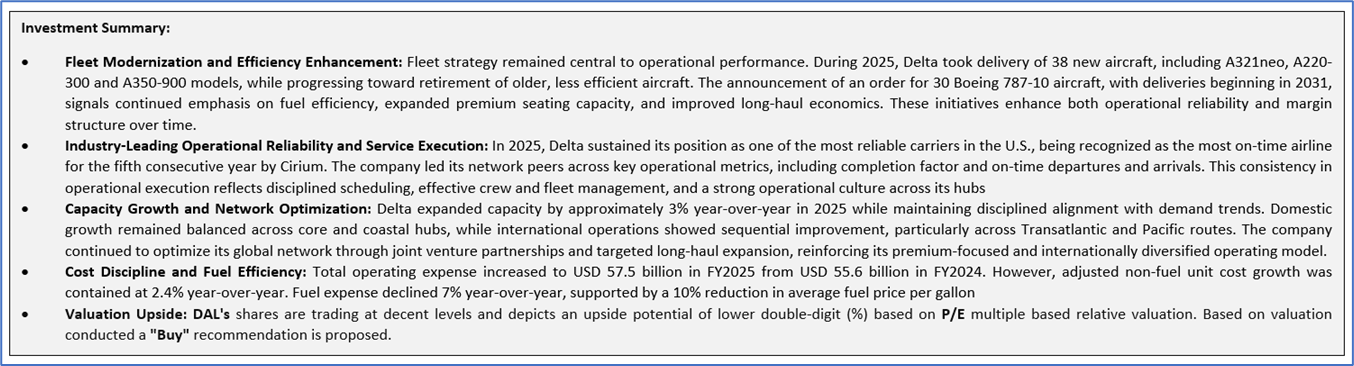
1.3 The Key Positives & Negatives
1.4 Key Metrics
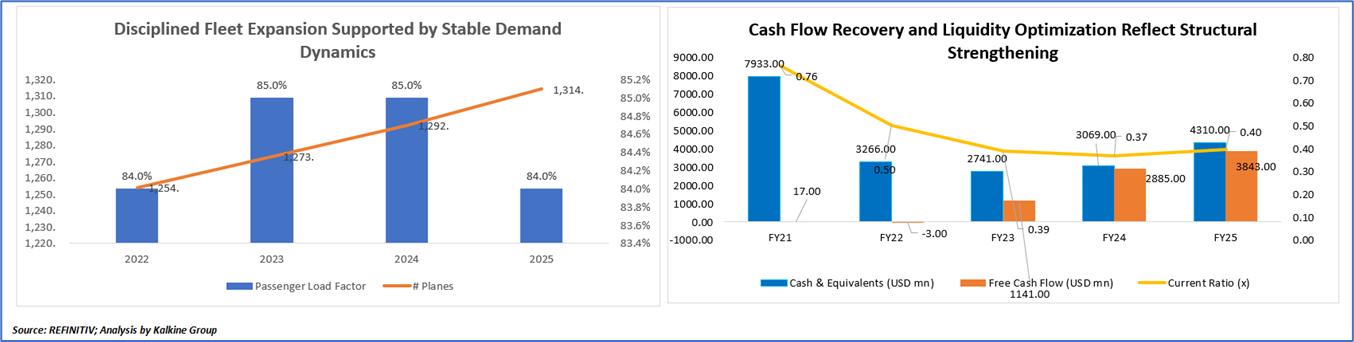
Cash Flow Recovery and Liquidity Optimization Reflect Structural Strengthening
A review of the chart highlights a clear evolution in Delta’s financial posture over the four-year period, moving from liquidity preservation toward structurally enhanced cash generation and balance sheet resilience. The early decline in cash balances reflects deliberate capital deployment into debt reduction and strategic investments rather than operational weakness. As profitability improved and diversified revenue streams scaled, free cash flow expanded significantly, supporting continued deleveraging and gradual stabilization of liquidity metrics. Although the current ratio remained below 1x—consistent with the capital-intensive dynamics of the airline industry—the combination of rising free cash flow, margin durability, and disciplined capital allocation signals a transition from cyclical recovery to sustained financial strength.
Disciplined Fleet Expansion Supported by Stable Demand Dynamics
The chart illustrates a steady increase in Delta’s fleet size over the four-year period alongside relatively stable passenger load factors, reflecting a strategy of measured capacity growth aligned with demand trends. In the immediate recovery phase, load factors strengthened as demand rebounded faster than capacity restoration, supporting utilization despite a smaller fleet base. As the company progressed into optimization and growth phases, incremental aircraft deliveries were directed toward international expansion, fleet modernization, and a higher premium seat mix rather than aggressive volume growth. This disciplined approach helped maintain load factors within a narrow 84–85% range, even as the fleet expanded. The slight moderation in load factor in the most recent year appears consistent with incremental long-haul and premium-focused capacity additions coming online ahead of full demand absorption, underscoring a strategy centered on margin quality and revenue diversification rather than maximizing seat occupancy alone.
Section 2: Delta Air Lines (NYSE: DAL) (“Buy” at the closing market price of USD 69.50, as of Feb 12,2026)
2.1 Company Details
2.2 Technical Guidance and Stock Recommendation
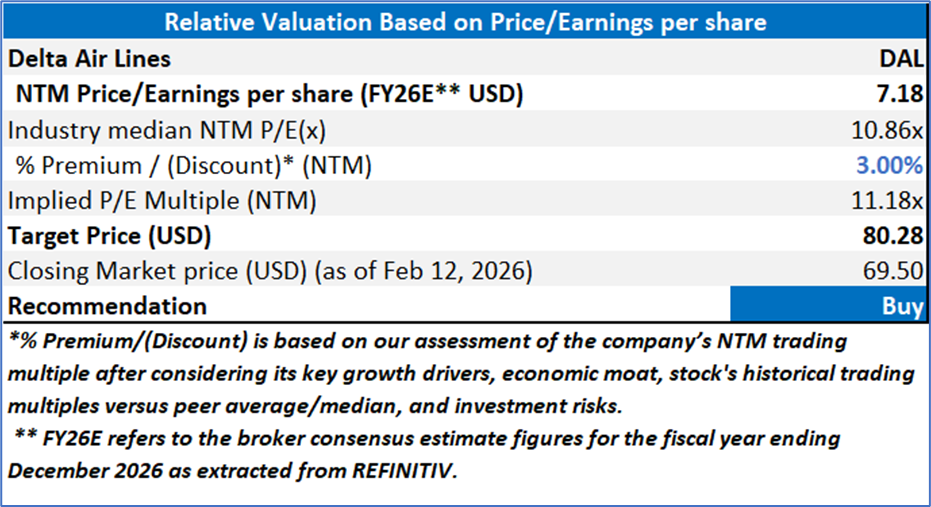

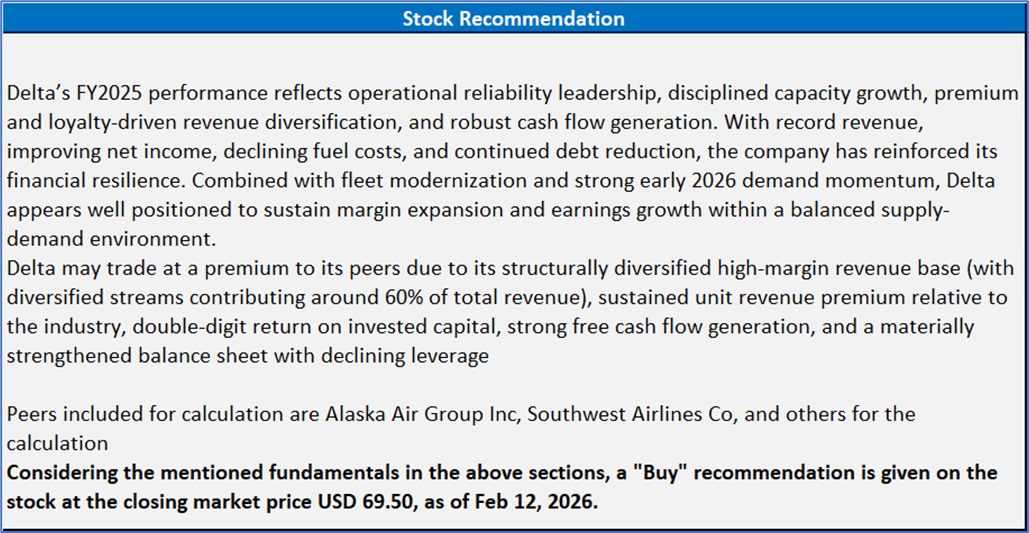
Markets are trading in a highly volatile zone currently due to certain macroeconomic issues and geopolitical tensions prevailing. Therefore, it is prudent to follow a cautious approach while investing.
Note 1: Past performance is not a reliable indicator of future performance.
Note 2: The reference date for all price data, currency, technical indicators, support, and resistance levels is Feb 12, 2026. The reference data in this report has been partly sourced from REFINITIV.
Note 3: Investment decisions should be made depending on an individual's appetite for upside potential, risks, holding duration, and any previous holdings. An 'Exit' from the stock can be considered if the Target Price mentioned as per the Valuation and or the technical levels provided has been achieved and is subject to the factors discussed above.
Note 4: The report publishing date is as per the Pacific Time Zone.
Technical Indicators Defined: -
Support: A level at which the stock prices tend to find support if they are falling, and a downtrend may take a pause backed by demand or buying interest. Support 1 refers to the nearby support level for the stock and if the price breaches the level, then Support 2 may act as the crucial support level for the stock.
Resistance: A level at which the stocks prices tend to find resistance when they are rising, and an uptrend may take a pause due to profit booking or selling interest. Resistance 1 refers to the nearby resistance level for the stock and if the price surpasses the level, then Resistance 2 may act as the crucial resistance level for the stock.
Stop-loss: It is a level to protect against further losses in case of unfavorable movement in the stock prices.
Past performance is not a reliable indicator of future performance.

 NZ
 UK
 US
 AU
 IND

 CA

 Please wait processing your request...