Company Overview: Digi Power X Inc. (TSXV: DGX) is an innovative energy infrastructure company focused on developing next-generation data centers designed to accelerate the adoption and integration of sustainable energy assets. The company’s mission is to create a modern digital ecosystem where advanced computing capabilities and renewable energy solutions converge to deliver efficiency, scalability, and environmental responsibility. This Report covers Price Action, Technical Indicators Analysis along with the Stop Loss Levels, Target Prices, and Recommendation on this one stock.
Canada Market Round-Up
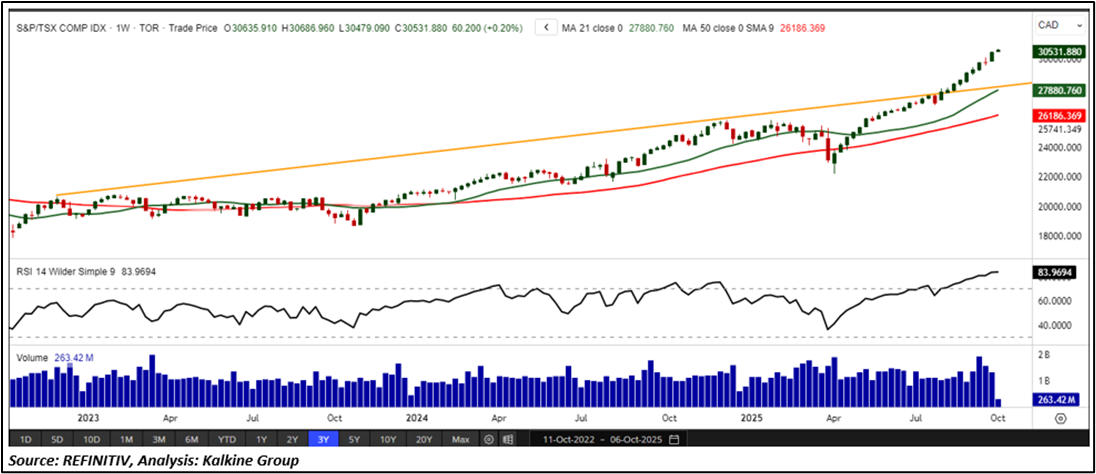
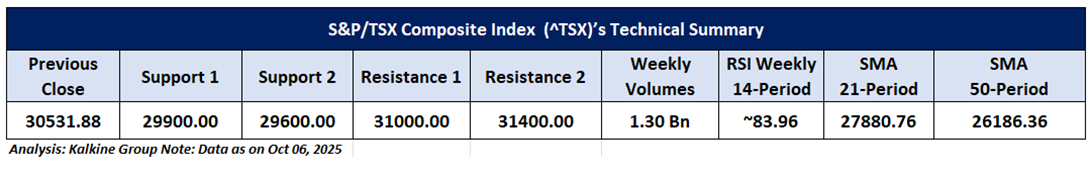
The S&P/TSX Composite Index (TSX: ^TSX) ended last week on a positive note, advancing 2.39% to close at 30,471.68. On October 6, the benchmark extended its near-term bullish momentum, rising 60.20 points (0.20%) in a session marked by broad-based gains. Strength was most evident across the basic materials, technology, healthcare, energy, utilities, and financial sectors, while consumer non-cyclicals, consumer cyclicals, real estate, and industrials underperformed, limiting further upside. From a technical perspective, the index maintains a firm bullish structure, trading comfortably above its rising trendline support and the 21-period Simple Moving Average (SMA), both of which continue to reinforce the prevailing uptrend. Key resistance is identified near 31,000, and a breakout above this level could pave the way for additional upside momentum. Conversely, initial support rests around 29,900, with a sustained move below this threshold likely to trigger a short-term corrective pullback. The weekly Relative Strength Index (RSI) currently reads 83.96, indicating strong and persistent buying momentum. While this supports a constructive medium-term outlook, it also places the index in overbought territory, suggesting that a brief phase of consolidation or profit-taking may emerge in the near term.
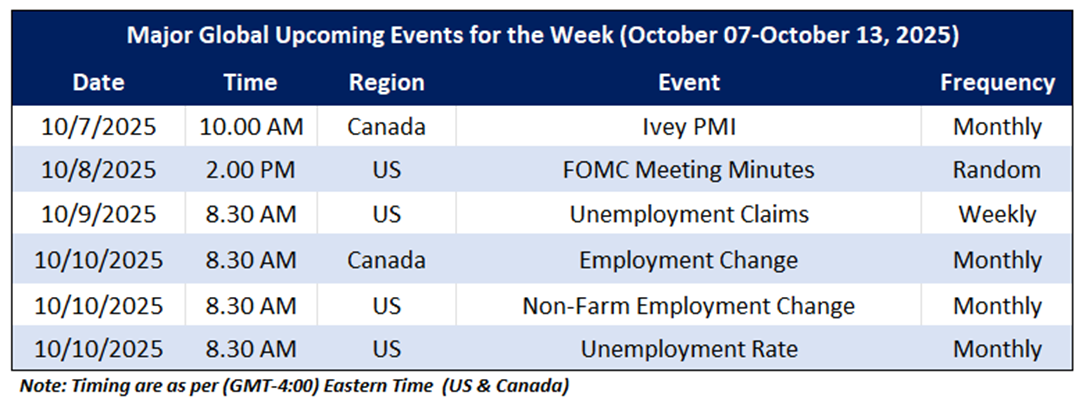
On the macro front, the upcoming major economic events that may impact the Canadian market sentiment include CA Manufacturing PMI, US Unemployment Rate PMI and US Unemployment Claims.
Global Markets Wrap-Up
U.S. equity markets gained solid traction during the week ending October 3, 2025, with major benchmarks closing broadly higher. The Nasdaq Composite outperformed, rising 1.32% to close at 22,780.50, while the Russell 2000 advanced 1.72% to 2,476.18, reflecting renewed investor appetite for growth and small-cap stocks. On the economic front, data from the U.S. Department of Labor indicated a modest improvement in the employment landscape. For the week ending September 20, 2025, seasonally adjusted initial jobless claims declined by 14,000 to 228,000, compared with a revised 232,000 in the prior week underscoring the continued resilience of the U.S. labor market despite broader macroeconomic uncertainties.
Taking into the US market's performance over the last week, following the major global macros and data front, based on the technical analysis of the S&P/TSX Composite Index, the one TSX listed stock fit the maximum criteria on the technical framework. The recommendations are based on the generic insights, entry price, target prices, and stop-loss for Digi Power X Inc. (TSXV: DGX) for the next 2-4 weeks.
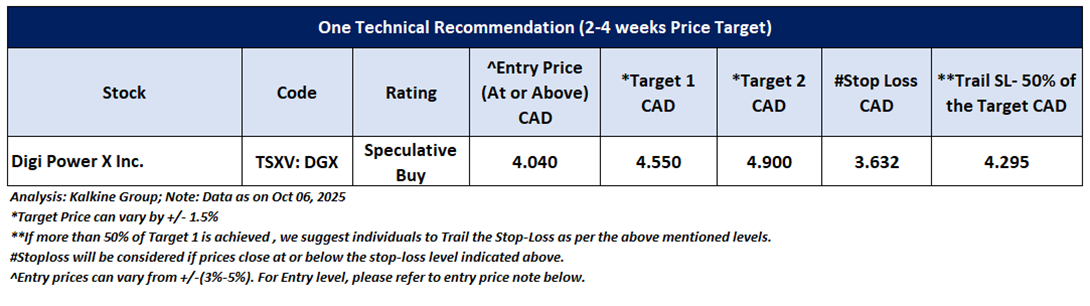
Digi Power X Inc. (TSXV: DGX)
Price Action Analysis (On the Daily Chart)
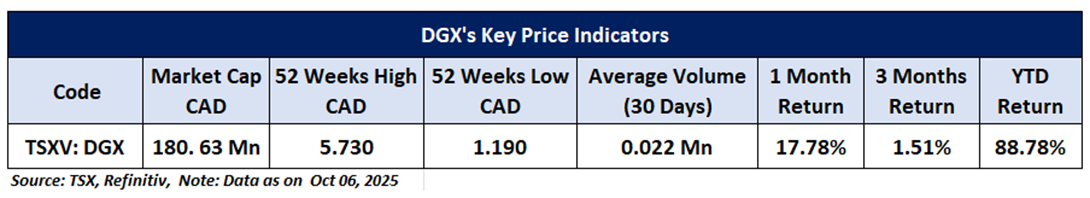
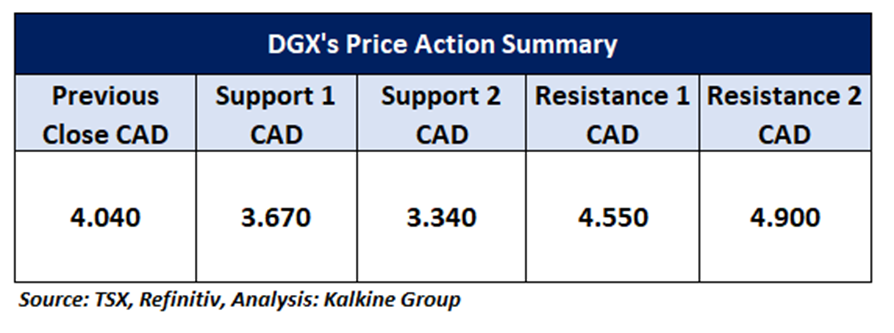
On the daily chart, DGX continues to trade above a rising trendline support, indicating sustained buying interest at current levels. The recent rebound, accompanied by increasing trading volumes, reflects strengthening bullish momentum and growing investor participation. If this positive sentiment extends over the next 2–4 weeks, the stock appears well-positioned to retest immediate resistance near CAD 4.55. A decisive breakout above CAD 4.90 would signal a continuation of the broader uptrend, potentially paving the way for further upside in the sessions ahead.
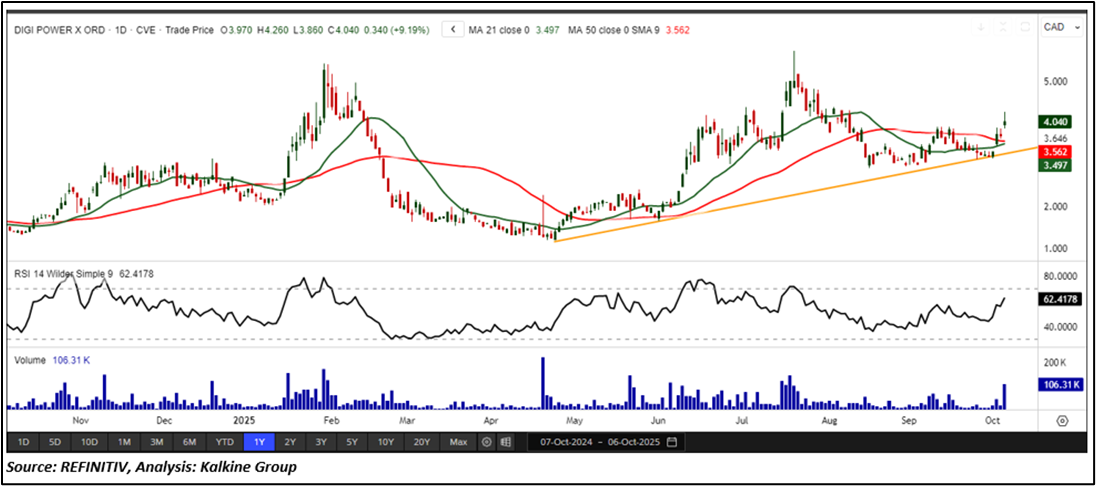
Technical Analysis (On the Daily Chart)
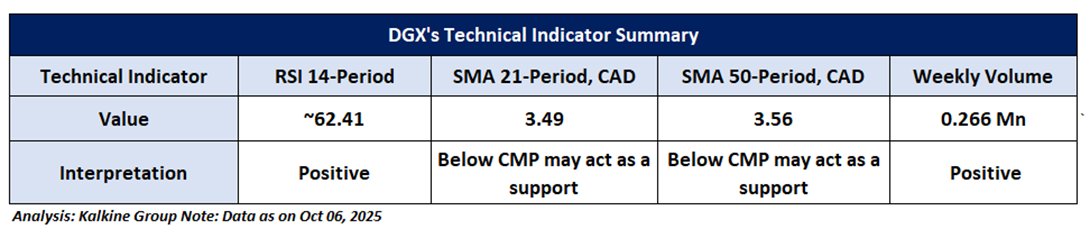
On the daily chart, the 14-period Relative Strength Index (RSI) stands at 62.41, indicating solid positive momentum and suggesting scope for renewed upside if buying interest continues to build. Consistently strong weekly trading volumes reinforce the prevailing trend, underscoring steady investor participation and healthy market activity. Furthermore, the stock remains above its 21-period Simple Moving Average (SMA), which serves as dynamic support, thereby strengthening the overall bullish outlook.
General Recommendation:
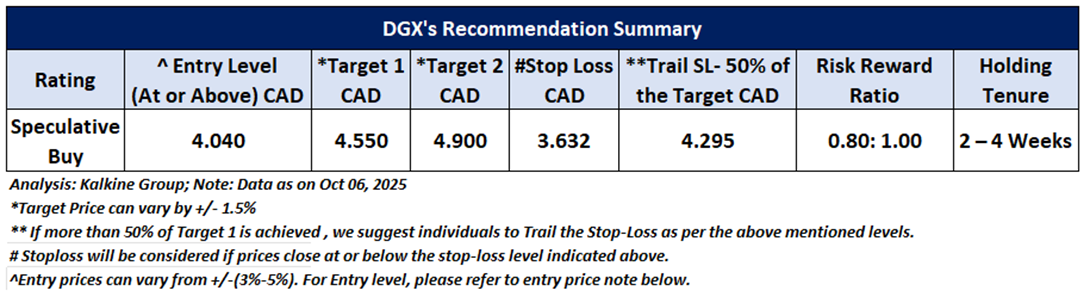
As per the above-mentioned price action and technical analysis, Digi Power X Inc. is looking technically well-placed on the chart, and a ‘Speculative Buy’ recommendation has been given on the stock. Investment decisions should be made depending on an individual’s appetite for upside potential, risks, and any previous holdings. This recommendation is purely based on technical analysis, and fundamental analysis has not been considered in this report. Below is the summary of our recommendation.
Upcoming Major Global Economic Events
Market events occur on a day-to-day basis depending on the frequency of the data and generally include updates on employment, inflation, GDP, consumer sentiments, etc. Noted below are the upcoming week's major global economic events that could impact the S&P/TSX Composite Index and listed stocks' prices.
Related Risks: This report may be looked at from high-risk perspective and recommendations are provided are for a short duration. Recommendations provided in this report are solely based on technical parameters, and the fundamental performance of the stocks has not been considered in the decision-making process. Other factors which could impact the stock prices include market risks, regulatory risks, interest rates risks, currency risks, social and political instability risks etc.
Note 1: Individuals can consider exiting from the stock if the Target Price or Stop loss mentioned as per the technical analysis has been achieved and subject to the factors discussed above.
Note 2: How to Read the Charts?
The Green color line reflects the 21-period moving average, while the Red color line indicates the 50-period moving average. SMA helps to identify existing price trend. If the prices are trading above the 21-period and 50-period moving average, then it shows prices are currently trading in a bullish trend.
The Black color line in the chart's lower segment reflects the Relative Strength Index (14-Period), which indicates price momentum and signals momentum in trend. A reading of 70 or above suggests overbought status, while a reading of 30 or below suggests an oversold status.
The Blue color bars in the chart's lower segment show the volume of the stock. The volume is the number of shares that changed hands during a given day. Stocks with high volumes are more liquid than stocks with lesser volume. Liquidity in stocks helps in easier and faster execution of the order.
The Orange color lines are the trend lines drawn by connecting two or more price points and used for trend identification purposes. The trend line also acts as a line of support and resistance.
Technical Indicators Defined: -
Support: A level at which the stock prices tend to find support if they are falling, and a downtrend may take a pause backed by demand or buying interest. Support 1 refers to the nearby support level for the stock and if the price breaches the level, then Support 2 may act as the crucial support level for the stock.
Resistance: A level at which the stock prices tend to find resistance when they are rising, and an uptrend may take a pause due to profit booking or selling interest. Resistance 1 refers to the nearby resistance level for the stock and if the price surpasses the level, then Resistance 2 may act as the crucial resistance level for the stock.
Stop-loss: It is a level to protect further losses in case of unfavorable movement in the stock prices.
Risk Reward Ratio: The risk reward ratio is the difference between an entry point to a stop loss and profit level. This report is based on ~80% Stop Loss of the Target 1 from the entry point.
A trailing stop-loss is a modification of stop-loss in case of favourable movement in the price to protect the gains. Individuals can Trail the Stop-Loss as per the aforementioned levels if the stock price achieves more than 50% of the Target 1. individuals should consider exiting from the position as per the Trailing Stop-Loss level if the price starts moving downwards after achieving more than 50% of the Target 1.
The reference date for all price data, currency, technical indicators, support, and resistance levels is October 06, 2025. The reference data in this report has been partly sourced from REFINITIV.
Abbreviations
CMP: Current Market Price
SMA: Simple Moving Average
CAD: Canadian Dollar
RSI: Relative Strength Index
Note: Trading decisions require a thorough analysis by individuals. Technical reports in general chart out metrics that may be assessed by individuals before any stock evaluation. The above are illustrative analytical factors used for evaluating the stocks; other parameters can be looked at along with additional risks per se. Past performance is neither an Indicator nor a guarantee of future performance.
Past performance is not a reliable indicator of future performance.

 Please wait processing your request...