Section 1: Company Overview and Fundamentals
1.1 Company Overview:
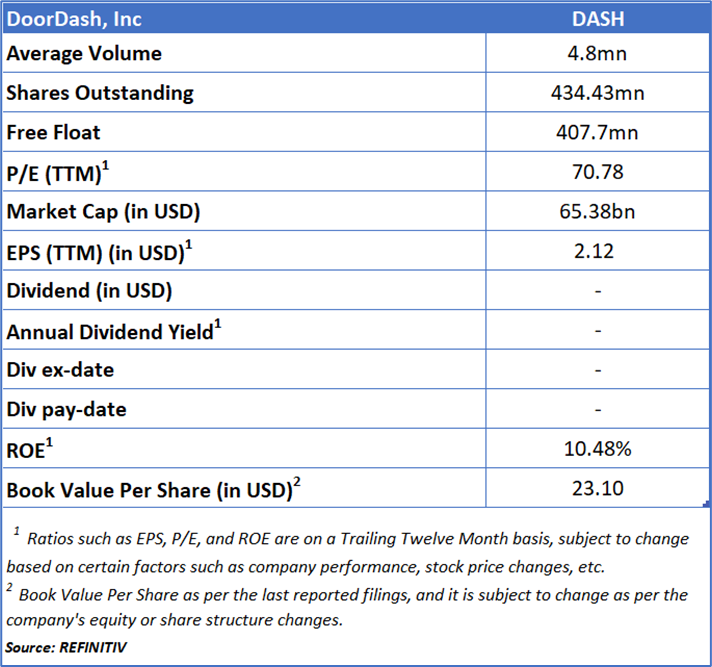
DoorDash, Inc (NASDAQ: DASH) operates a global local commerce platform designed to streamline connections between merchants and consumers. Through its Marketplaces and Commerce Platform, the company enables businesses to establish an online presence, drive demand, and manage order fulfillment, payments, and customer engagement, while also offering advertising solutions and white-label delivery services to enhance merchant capabilities.
Kalkine’s Diversified Opportunities Report covers the Company Overview, Key positives & negatives, Investment summary, Key investment metrics, Top 10 shareholding, Business updates and insights into company recent financial results, Key Risks & Outlook, Price performance and technical summary, Target Price, and Recommendation on the stock.
Stock Performance:
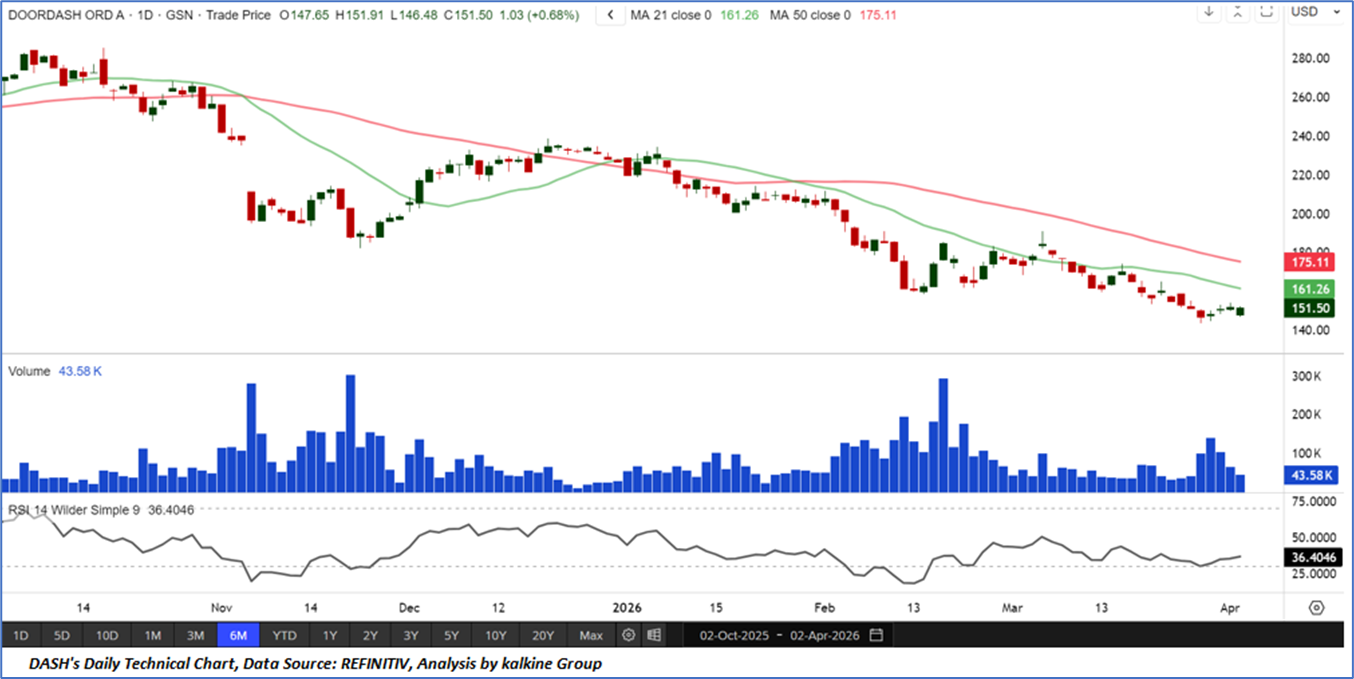
- Trend Structure and Moving Average Alignment: DoorDash, Inc. (DASH) is currently exhibiting a well-defined bearish trend structure, characterized by a persistent sequence of lower highs and lower lows since its peak near the USD ~280 zone. The stock is trading decisively below both the 21-day moving average (~USD 161.3) and the 50-day moving average (~USD 175.1), with both averages sloping downward, confirming a strong negative trend bias. The sustained inability to reclaim these moving averages suggests continued supply overhang, while the narrowing price action near USD ~150–155 indicates a potential consolidation phase within a broader downtrend rather than a confirmed base formation.
- Momentum Indicators and Relative Strength Profile: The Relative Strength Index (RSI ~36.4) reflects a weak momentum regime, hovering near the lower bound of the neutral zone and approaching oversold conditions. While this may indicate the potential for a short-term technical bounce, the absence of bullish divergence suggests that downside momentum remains structurally intact. The RSI’s repeated failure to sustain above the 50 level reinforces the dominance of sellers, and any recovery would require a decisive shift in momentum supported by improving breadth and higher RSI readings.
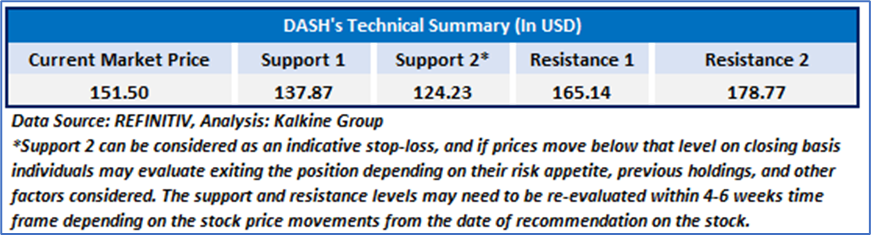
- Volume Dynamics and Key Support–Resistance Framework: Volume patterns indicate elevated activity during sharp declines, signaling distribution phases rather than accumulation, particularly during the February sell-off. Immediate support is observed near the USD 145–150 zone, with a more critical structural support level around USD 135, while resistance is concentrated in the USD 160–175 range, aligning with key moving averages. The broader technical setup suggests a range-bound consolidation with a bearish undertone, where a breakout above resistance could trigger a relief rally, but failure to hold current levels may extend the downtrend toward lower support zones.
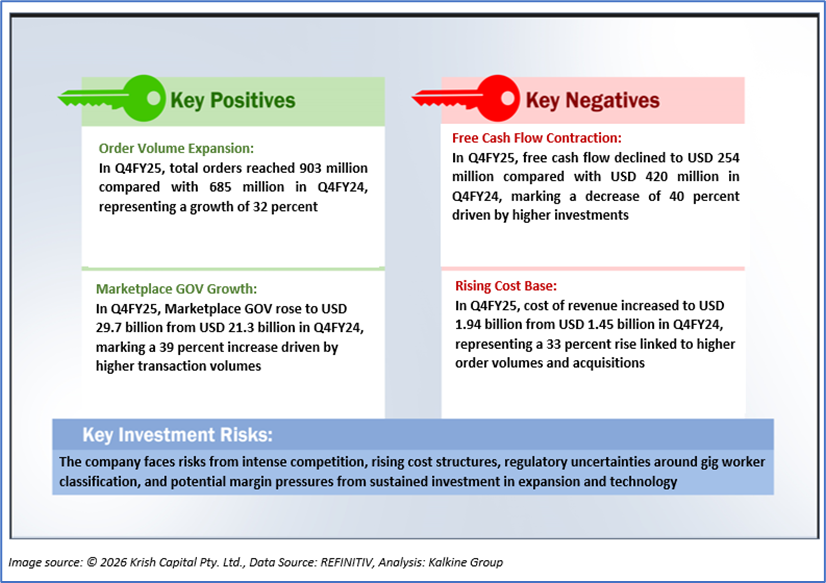
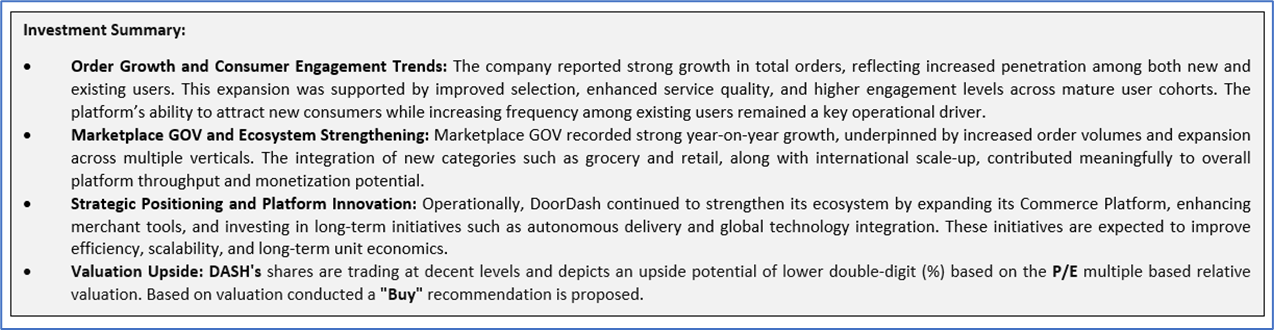
1.2 The Key Positives, Negatives, and Investment summary
1.3 Top 10 shareholders:
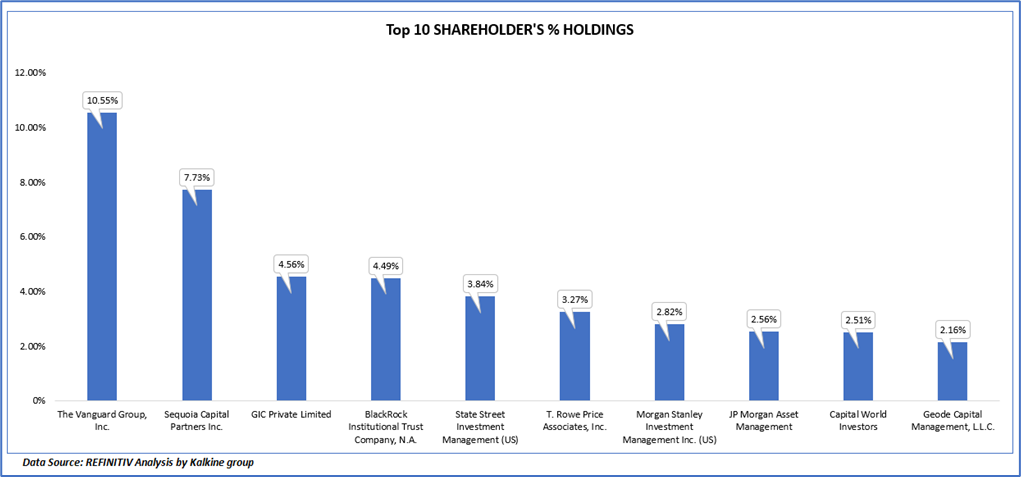
The top 10 shareholders together form ~ 44.49% of the total shareholding, signifying concentrated shareholding. The Vanguard Group, Inc. and Sequoia Capital Partners Inc. are the biggest shareholders, holding the maximum stake in the company at 10.55% and 7.73%, respectively.
1.4 Key Metrics:
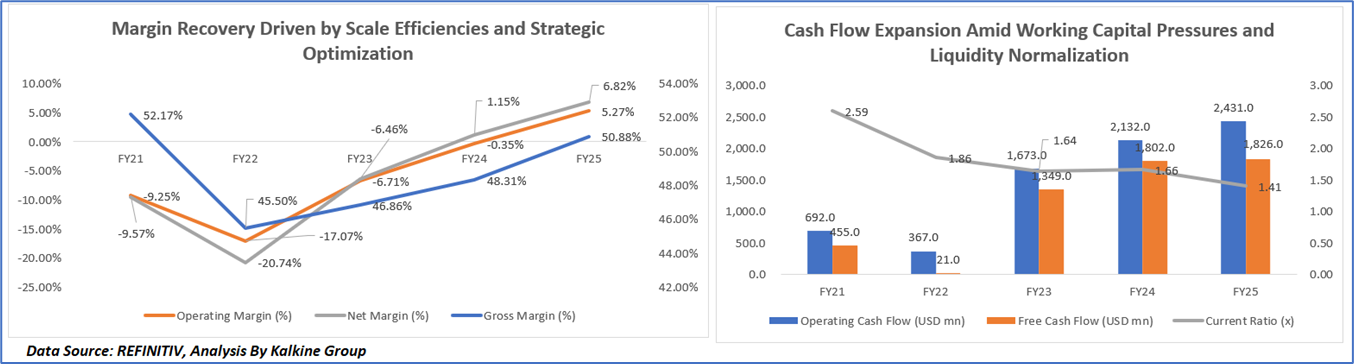
Margin Recovery Driven by Scale Efficiencies and Strategic Optimization
The margin trajectory reflects an initial phase of compression between FY21 and FY22, driven by elevated investments in customer acquisition, logistics, and geographic expansion, followed by a steady recovery through FY25 supported by improving order volumes and operating leverage. As the company scaled, better unit economics, reduced promotional intensity, and enhanced monetization through advertising and subscriptions contributed to margin expansion. Continued improvements in delivery efficiency and cost optimization supported gross margin recovery, while sustained investments in international markets and new verticals moderated the pace of margin expansion in the later years.
Cash Flow Expansion Amid Working Capital Pressures and Liquidity Normalization
The trend reflects a sharp dip in operating and free cash flows in FY22, primarily driven by elevated investments in growth, higher operating costs, and weaker profitability during the heavy expansion phase. From FY23 onwards, cash flows recovered significantly, supported by strong revenue growth, higher order volumes, and improved operating leverage, leading to better cash generation. However, the moderation in free cash flow relative to operating cash flow in later years indicates rising working capital requirements, including higher receivables, payment processor balances, and upfront payments linked to expansion initiatives. Meanwhile, the steady decline in the current ratio from FY21 to FY25 suggests normalization of liquidity levels as the company deployed cash toward growth investments, acquisitions, and operational scaling, reflecting a shift from a liquidity-heavy balance sheet to a more efficiently utilized capital structure.
Section 2: Business Updates and Corporate Business Highlights
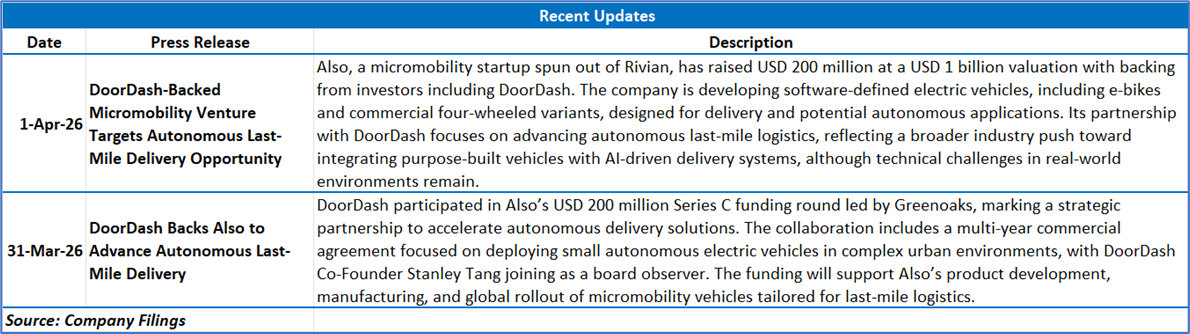
2.1 Recent Business Updates
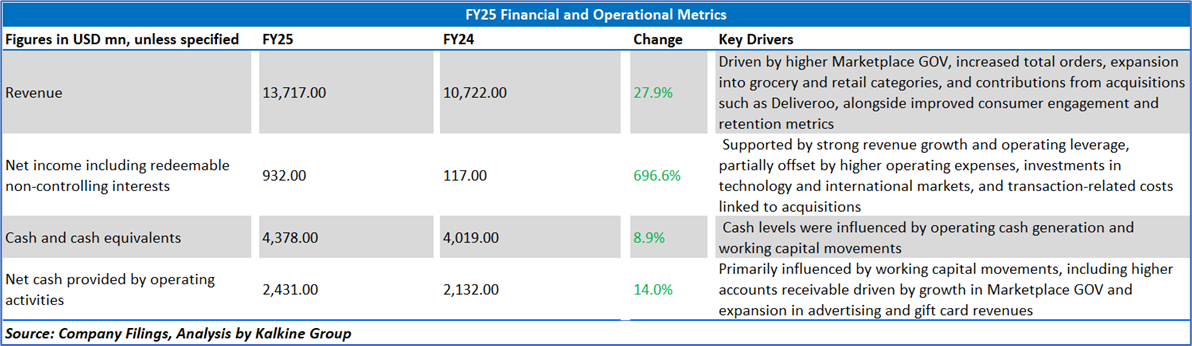
2.2 Insights of FY25:
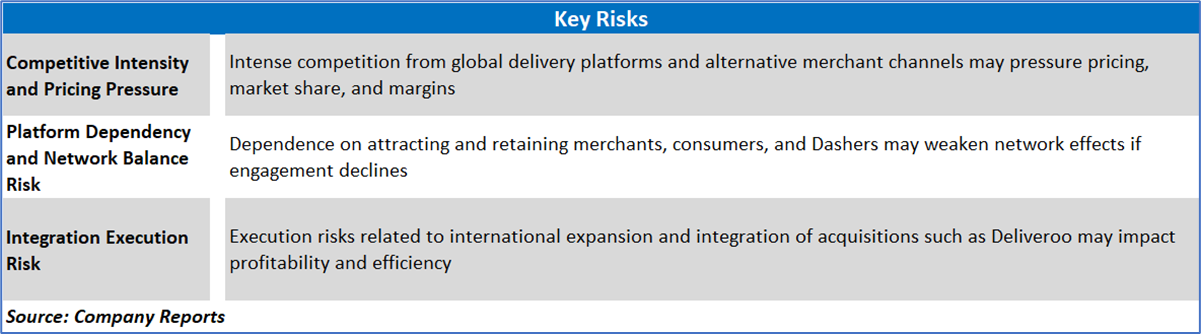
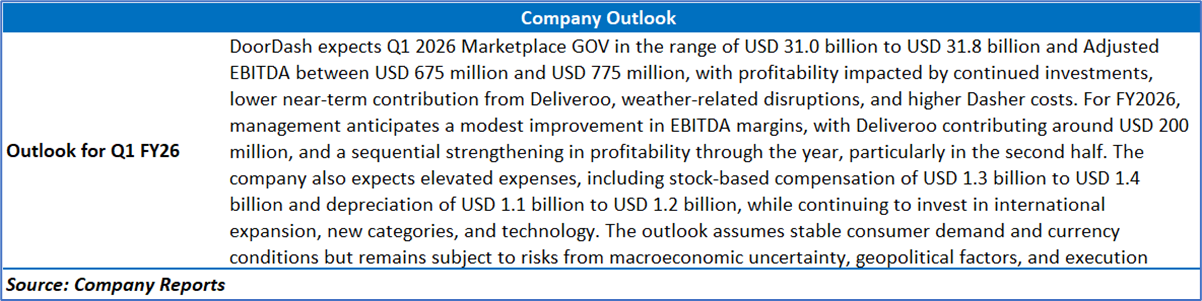
Section 3: Key Risks & Outlook
Section 4: Stock Recommendation Summary:
4.1 Price Performance and Technical Summary:
Stock Performance:
- Trend Structure and Moving Average Alignment: DoorDash, Inc. (DASH) is currently exhibiting a well-defined bearish trend structure, characterized by a persistent sequence of lower highs and lower lows since its peak near the USD ~280 zone. The stock is trading decisively below both the 21-day moving average (~USD 161.3) and the 50-day moving average (~USD 175.1), with both averages sloping downward, confirming a strong negative trend bias. The sustained inability to reclaim these moving averages suggests continued supply overhang, while the narrowing price action near USD ~150–155 indicates a potential consolidation phase within a broader downtrend rather than a confirmed base formation.
- Momentum Indicators and Relative Strength Profile: The Relative Strength Index (RSI ~36.4) reflects a weak momentum regime, hovering near the lower bound of the neutral zone and approaching oversold conditions. While this may indicate the potential for a short-term technical bounce, the absence of bullish divergence suggests that downside momentum remains structurally intact. The RSI’s repeated failure to sustain above the 50 level reinforces the dominance of sellers, and any recovery would require a decisive shift in momentum supported by improving breadth and higher RSI readings.
- Volume Dynamics and Key Support–Resistance Framework: Volume patterns indicate elevated activity during sharp declines, signaling distribution phases rather than accumulation, particularly during the February sell-off. Immediate support is observed near the USD 145–150 zone, with a more critical structural support level around USD 135, while resistance is concentrated in the USD 160–175 range, aligning with key moving averages. The broader technical setup suggests a range-bound consolidation with a bearish undertone, where a breakout above resistance could trigger a relief rally, but failure to hold current levels may extend the downtrend toward lower support zones.
4.2 Fundamental Valuation
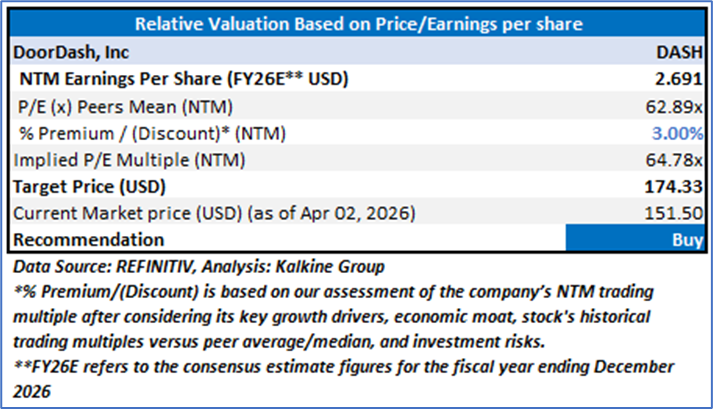
Valuation Methodology: Price/Earnings Per Share Multiple Based Relative Valuation
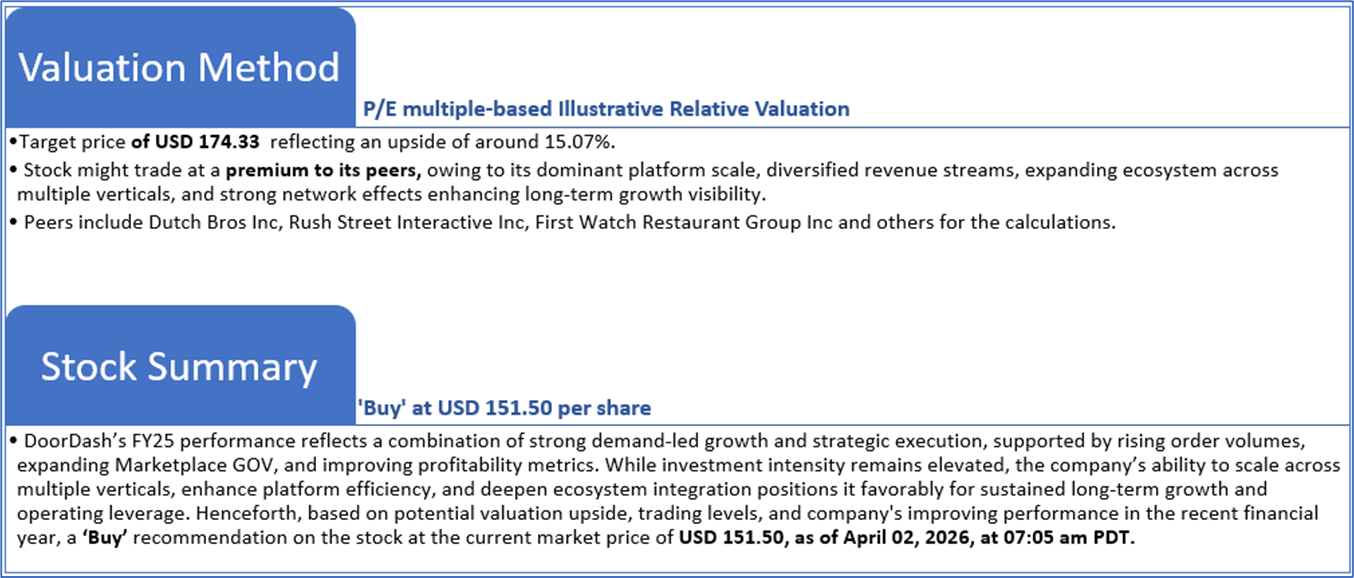
Markets are trading in a highly volatile zone currently due to certain macroeconomic issues and geopolitical tensions prevailing. Therefore, it is prudent to follow a cautious approach while investing.
Note 1: Past performance is not a reliable indicator of future performance.
Note 2: The reference date for all price data, currency, technical indicators, support, and resistance levels is April 02, 2026. The reference data in this report has been partly sourced from REFINITIV.
Note 3: Investment decisions should be made depending on an individual's appetite for upside potential, risks, holding duration, and any previous holdings. An 'Exit' from the stock can be considered if the Target Price mentioned as per the Valuation and or the technical levels provided has been achieved and is subject to the factors discussed above.
Note 4: The report publishing date is as per the Pacific Time Zone.
Technical Indicators Defined: -
Support: A level at which the stock prices tend to find support if they are falling, and a downtrend may take a pause backed by demand or buying interest. Support 1 refers to the nearby support level for the stock and if the price breaches the level, then Support 2 may act as the crucial support level for the stock.
Resistance: A level at which the stock prices tend to find resistance when they are rising, and an uptrend may take a pause due to profit booking or selling interest. Resistance 1 refers to the nearby resistance level for the stock and if the price surpasses the level, then Resistance 2 may act as the crucial resistance level for the stock.
Stop-loss: It is a level to protect against further losses in case of unfavorable movement in the stock prices.
Past performance is not a reliable indicator of future performance.

 NZ
 UK
 US
 AU
 IND

 CA

 Please wait processing your request...