Section 1: Company Fundamentals
1.1 Company Overview and Performance summary
Company Overview:
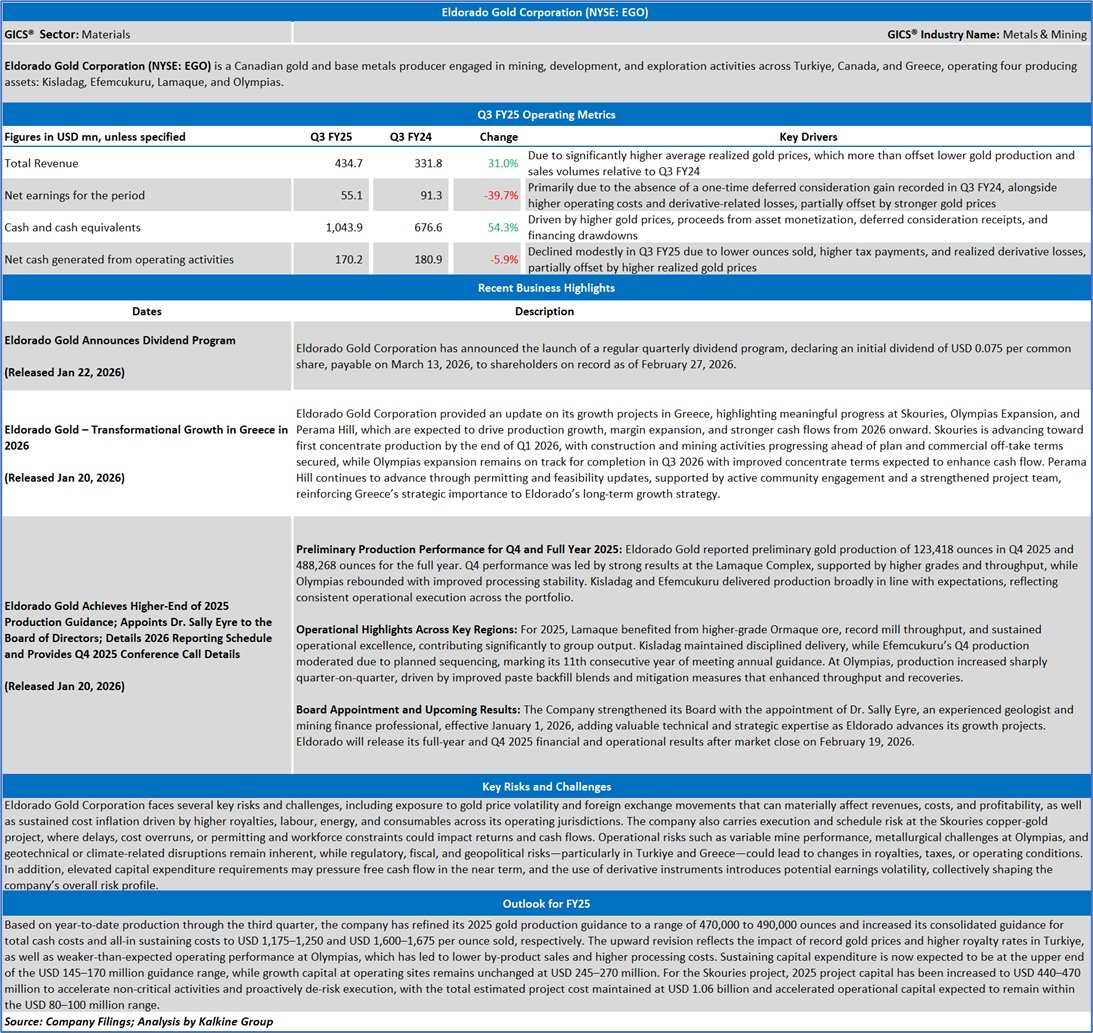
Eldorado Gold Corporation (NYSE: EGO) is a Canadian gold and base metals producer engaged in mining, development, and exploration activities across Turkiye, Canada, and Greece, operating four producing assets: Kisladag, Efemcukuru, Lamaque, and Olympias.
This US Inflation Report covers the Company Overview & Price performance, Summary table, Key positives & negatives, Key metrics, Company details, technical guidance & Stock recommendation, and Price chart.
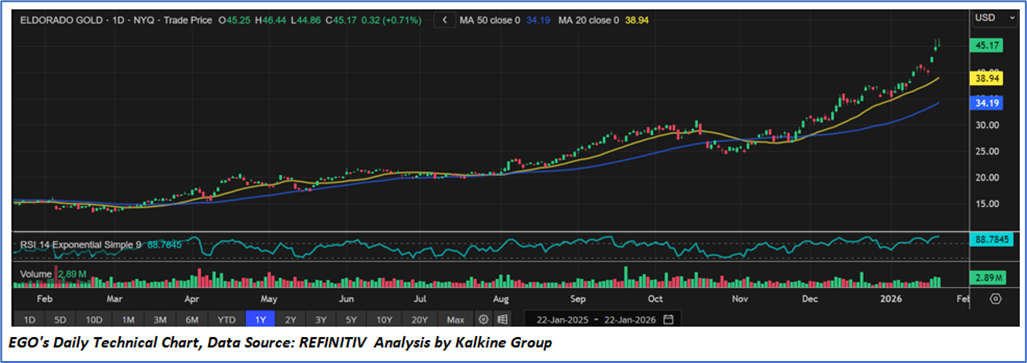
Price Performance:
- Eldorado Gold is in a strong and sustained uptrend, characterized by a consistent pattern of higher highs and higher lows. The recent breakout to fresh multi-month and all-time highs in the USD 45–46 range confirms trend continuation and reflects strong bullish sentiment in the stock.
- The price is trading decisively above its key moving averages, with the 20-day moving average near USD 38.9 acting as short-term dynamic support and the 50-day moving average around USD 34.2 defining the medium-term trend. The upward slope and widening separation between these averages indicate robust trend strength and sustained upside momentum.
- The 14-day RSI is elevated near 88, signaling overbought conditions. While this highlights strong buying pressure, such high RSI readings in a trending market typically suggest the possibility of short-term consolidation or a mild pullback rather than an immediate reversal of the prevailing uptrend.
- Volume patterns remain supportive, with increased participation accompanying recent price advances. This confirms the strength and reliability of the breakout, as rising prices backed by healthy volume suggest accumulation rather than distribution at current levels.
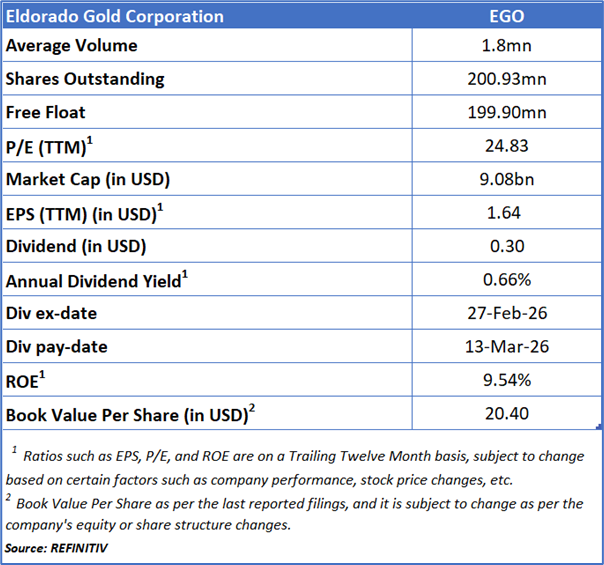
1.2 Summary Table
1.3 The Key Positives & Negatives
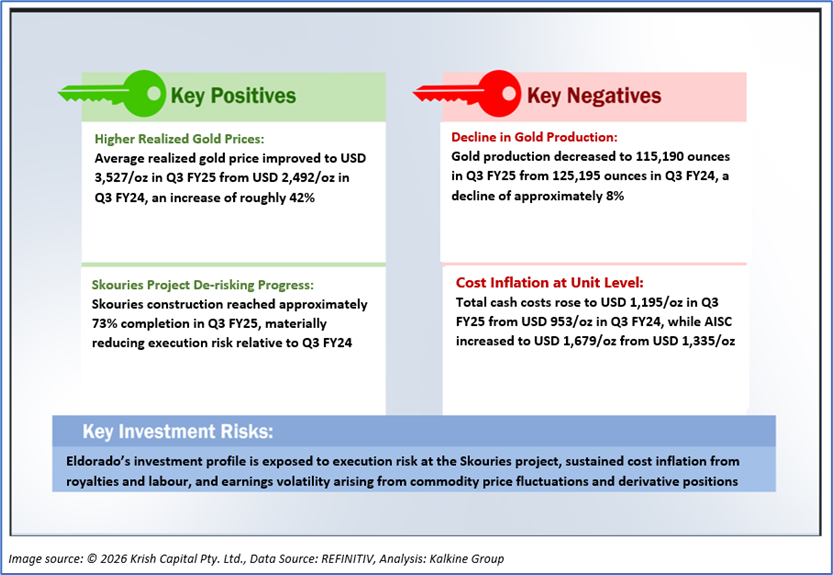
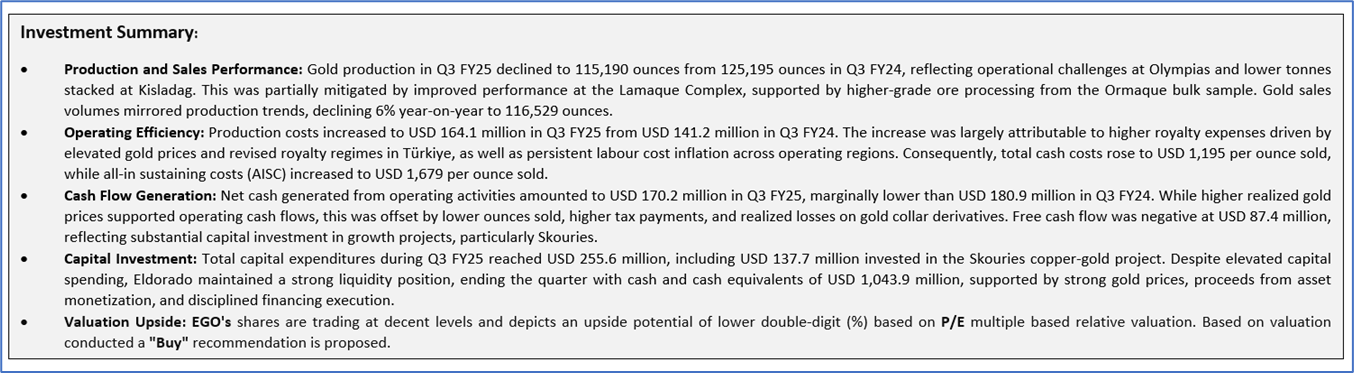
1.4 Key Metrics
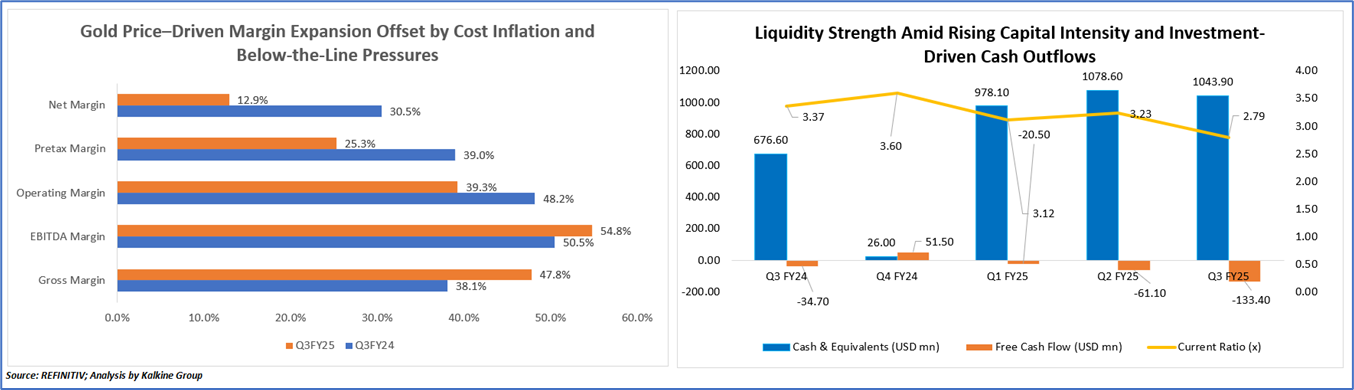
The margin trends reflect the combined impact of strong gold pricing and elevated cost and non-operating pressures in Q3 FY25 relative to Q3 FY24. Gross margin expanded as significantly higher realized gold prices more than offset lower production volumes and rising unit costs, while EBITDA margin also improved on the back of robust revenue growth and operating leverage. However, operating and pretax margins contracted due to higher royalty expenses linked to increased gold prices, continued labour and energy cost inflation, and higher depreciation and finance costs associated with an expanded asset base and increased debt. Net margin declined sharply, primarily due to the absence of a one-time deferred consideration gain recorded in Q3 FY24, alongside higher tax expense and derivative-related losses in Q3 FY25, underscoring how non-recurring items and below-the-line costs diluted otherwise strong operating-level profitability.
Considering the liquidity parameter, the observed trends indicate Eldorado Gold’s progression into a capital-intensive growth phase, with cash and cash equivalents increasing from Q3 FY24 to Q3 FY25, supported by higher realized gold prices, strong year-to-date operating cash flows, asset monetisation proceeds including deferred consideration receipts, and drawdowns under the Skouries project financing facilities, partly offset by elevated capital expenditure and shareholder returns in certain quarters. In contrast, free cash flow weakened materially from Q1 FY25 onward as intensified investment in growth capital; most notably at the Skouries copper-gold project; alongside higher sustaining capital across operating mines, outpaced operating cash generation, resulting in deeper negative free cash flow in Q2 FY25 and Q3 FY25. Concurrently, the gradual decline in the current ratio reflects rising current liabilities relative to current assets, driven by increased short-term obligations, higher payables, and elevated working capital requirements associated with active construction and project execution, underscoring the company’s transition into a more capital-heavy phase despite maintaining a strong absolute liquidity position.
Section 2: Eldorado Gold Corporation (NYSE: EGO) (“Buy” at the closing market price of USD 45.17, as of Jan 22,2026)
2.1 Company Details
2.2 Technical Guidance and Stock Recommendation
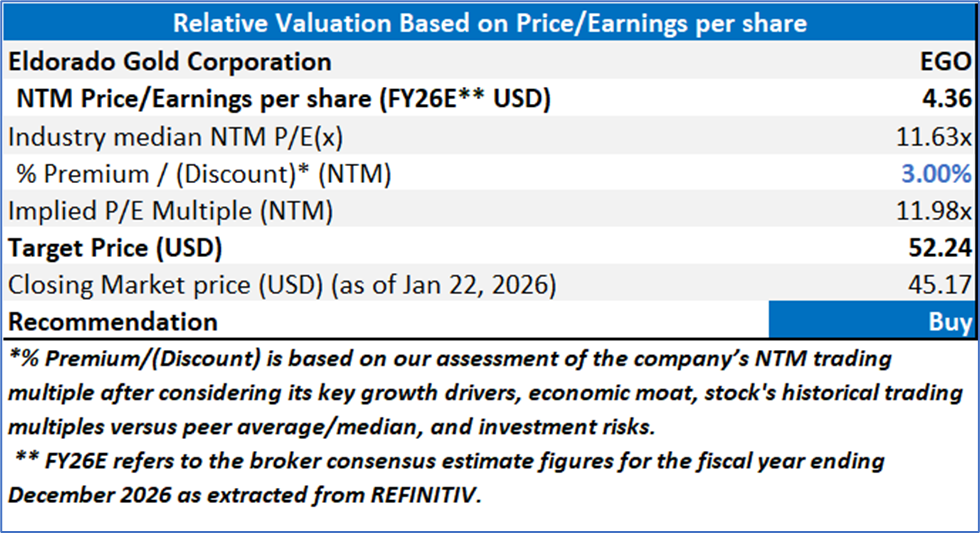
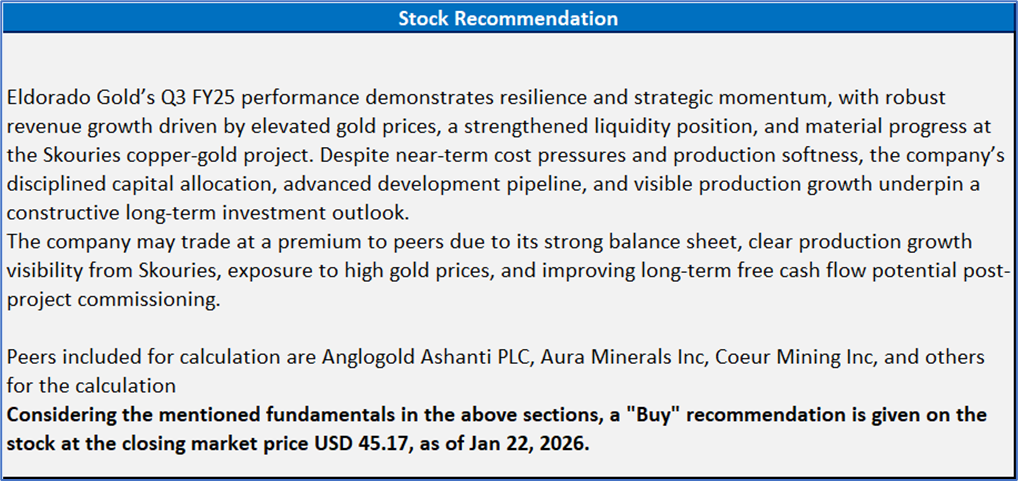
Markets are trading in a highly volatile zone currently due to certain macroeconomic issues and geopolitical tensions prevailing. Therefore, it is prudent to follow a cautious approach while investing.
Note 1: Past performance is not a reliable indicator of future performance.
Note 2: The reference date for all price data, currency, technical indicators, support, and resistance levels is Jan 22, 2026. The reference data in this report has been partly sourced from REFINITIV.
Note 3: Investment decisions should be made depending on an individual's appetite for upside potential, risks, holding duration, and any previous holdings. An 'Exit' from the stock can be considered if the Target Price mentioned as per the Valuation and or the technical levels provided has been achieved and is subject to the factors discussed above.
Note 4: The report publishing date is as per the Pacific Time Zone.
Technical Indicators Defined: -
Support: A level at which the stock prices tend to find support if they are falling, and a downtrend may take a pause backed by demand or buying interest. Support 1 refers to the nearby support level for the stock and if the price breaches the level, then Support 2 may act as the crucial support level for the stock.
Resistance: A level at which the stocks prices tend to find resistance when they are rising, and an uptrend may take a pause due to profit booking or selling interest. Resistance 1 refers to the nearby resistance level for the stock and if the price surpasses the level, then Resistance 2 may act as the crucial resistance level for the stock.
Stop-loss: It is a level to protect against further losses in case of unfavorable movement in the stock prices.
Past performance is not a reliable indicator of future performance.

 NZ
 UK
 US
 AU
 IND

 CA

 Please wait processing your request...