
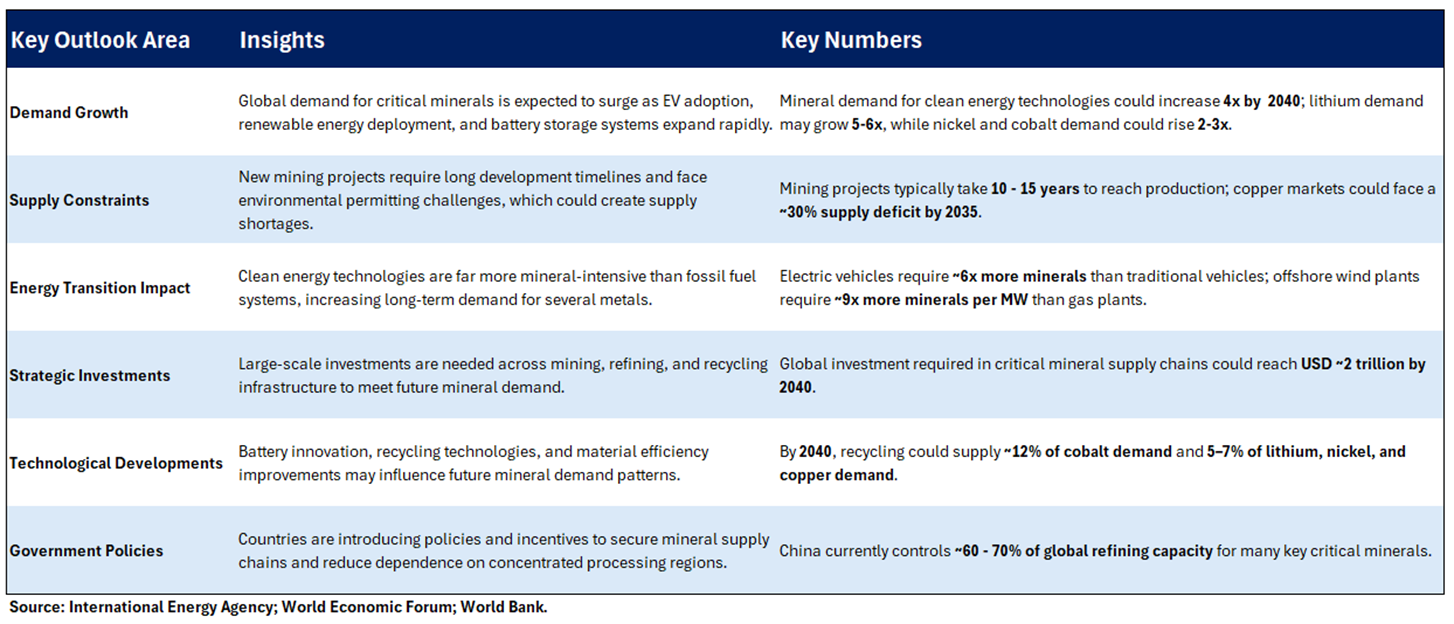
Kalkine’s “Global Critical Minerals Report” provides an overview of the minerals driving the global energy transition and advanced technologies. The report examines key regions including Australia, Canada, the United States, and the United Kingdom, covering the value chain from mining and refining to battery, semiconductor, and defence manufacturing.
The report analyses strategic raw-material supply chains and geopolitical resource positioning across global markets, highlighting how access to critical minerals is increasingly shaping national security, industrial policy, and economic competitiveness. It also evaluates the critical minerals value chain across upstream mining, midstream processing and refining, and downstream manufacturing, where supply concentration and processing bottlenecks continue to influence global supply dynamics.
As demand from electric vehicles, renewable energy infrastructure, AI hardware, and defence technologies continues to rise, governments and corporations are strengthening supply security through mining investments, strategic partnerships, and the development of domestic reserves. While the sector faces challenges such as long project development timelines and commodity price volatility, structural demand and supportive policy initiatives are expected to drive long-term growth across the critical minerals sector.

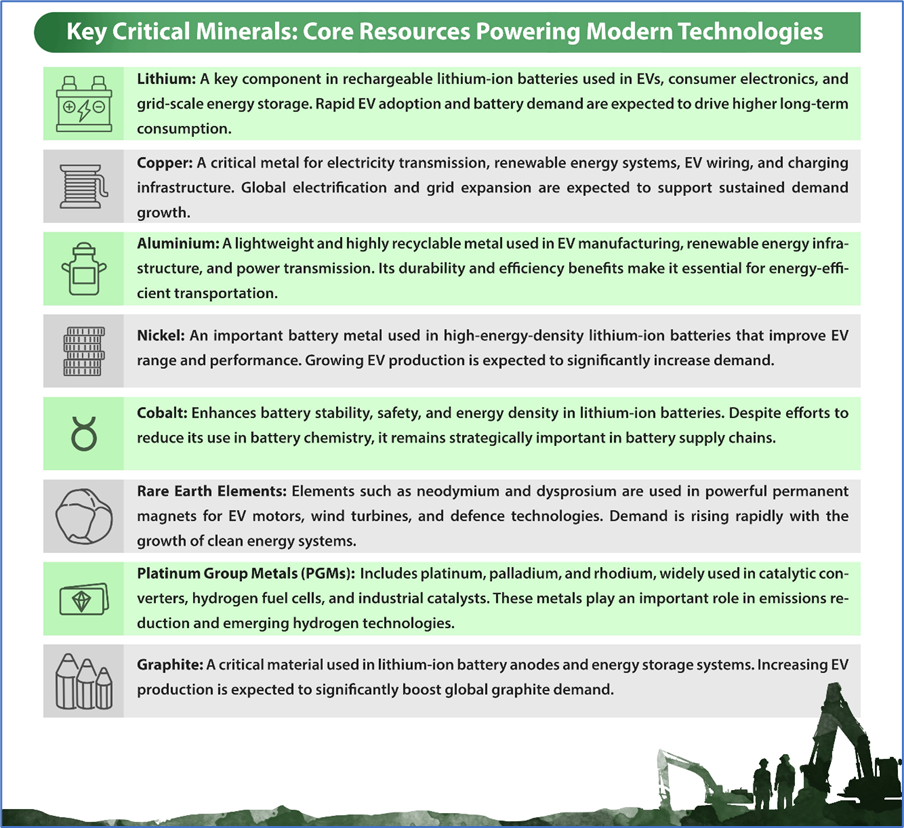
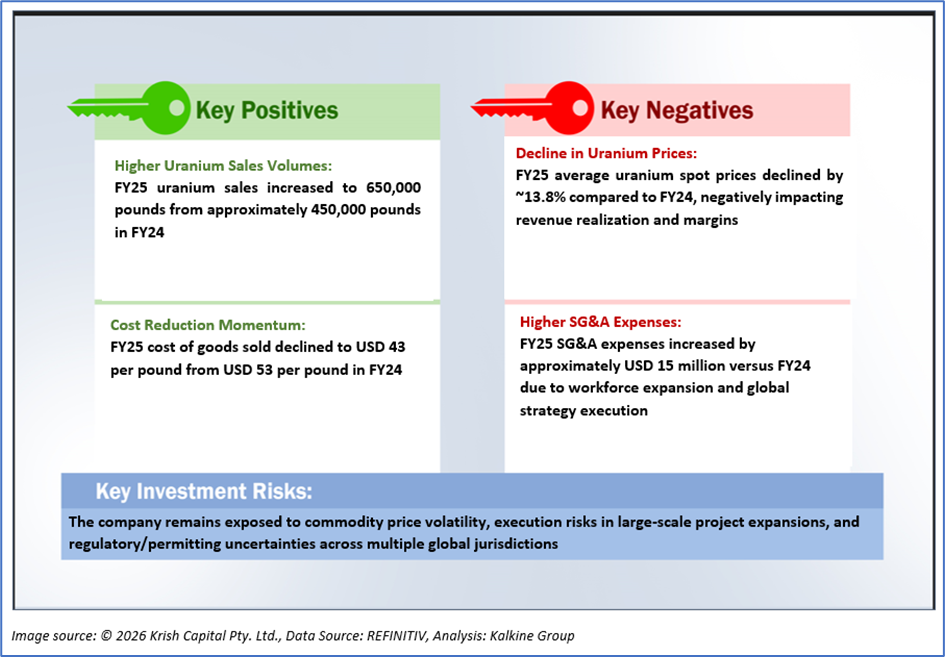
Image source: © 2026 Krish Capital Pty. Ltd., Analysis: Kalkine Group

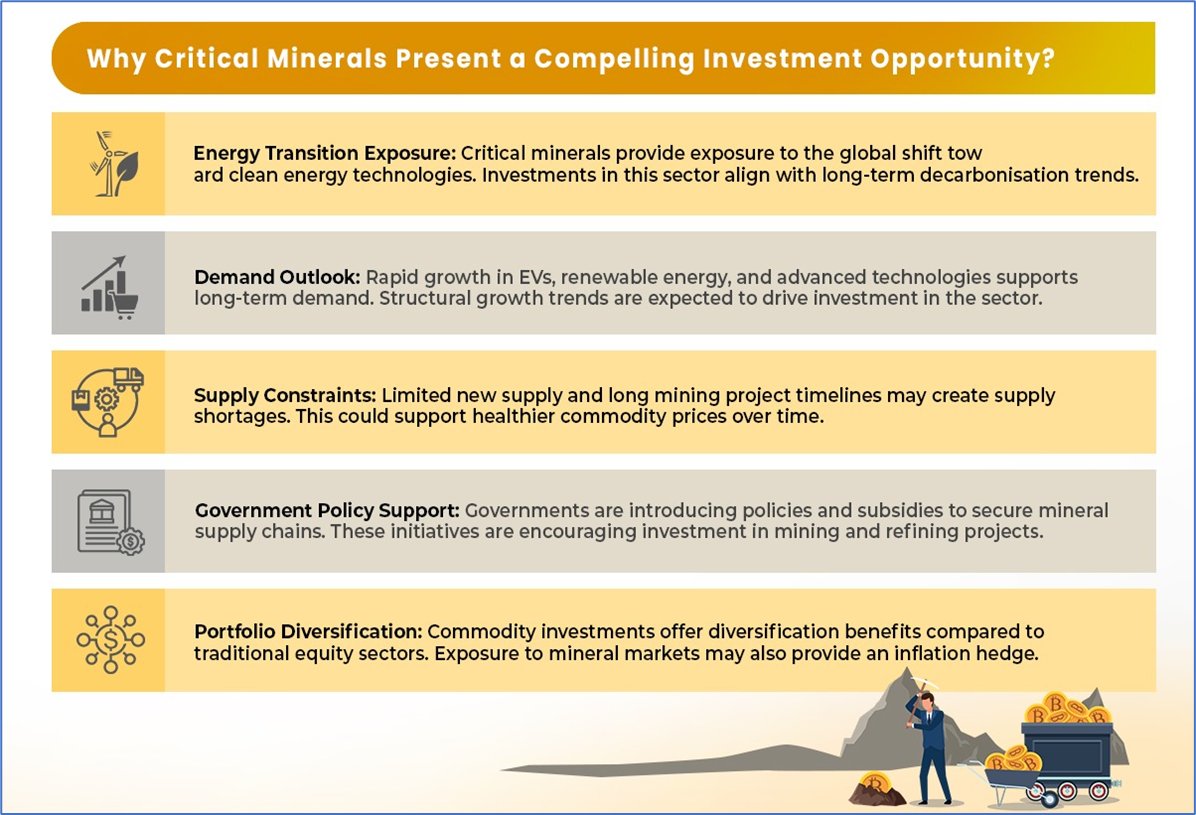
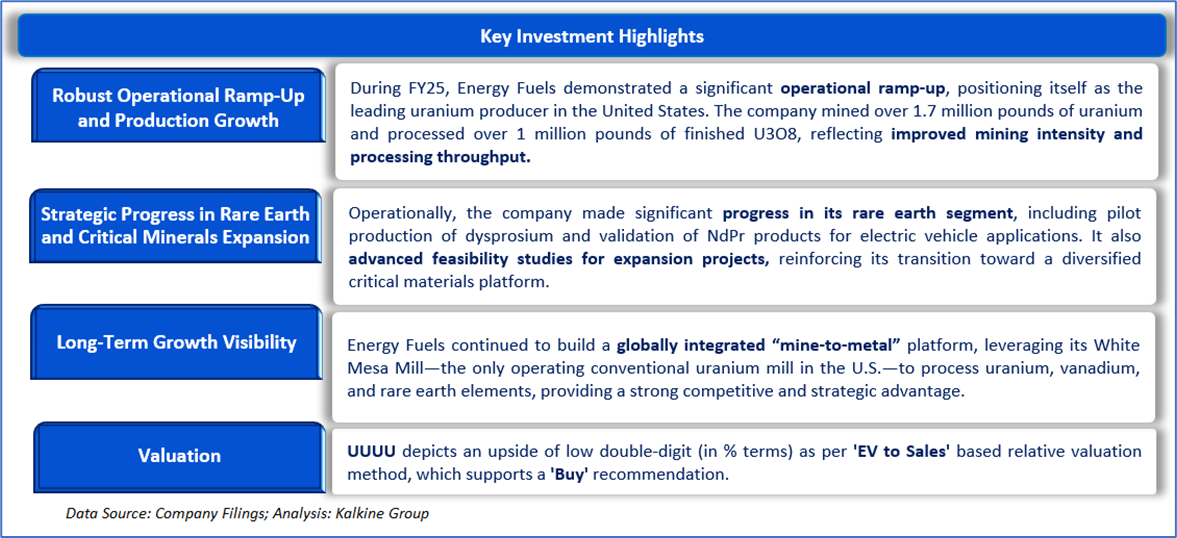
Image source: © 2026 Krish Capital Pty. Ltd., Analysis: Kalkine Group

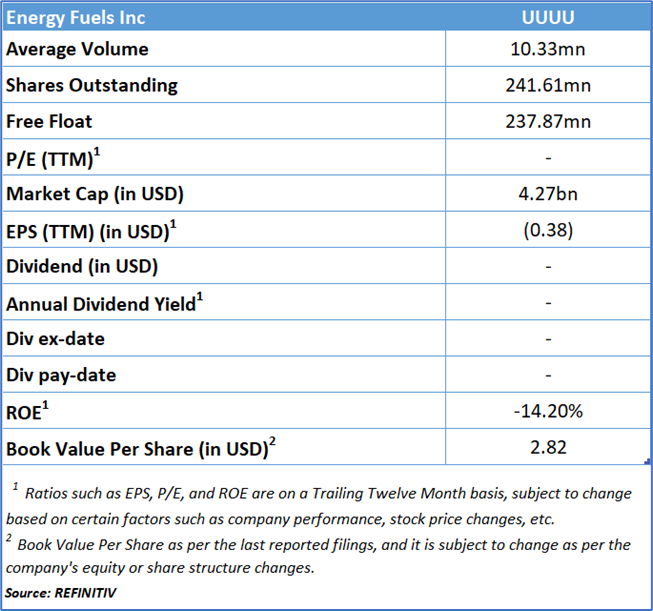
Amid elevated Market Volatility and Global Economic Headwinds, Energy Fuels Inc (NYSE: UUUU) stands out as our defensive pick within the Energy Sector, supported by rigorous fundamental and technical research.
Section1: Company Overview and Fundamental Insights:

Energy Fuels Inc (NYSE: UUUU) is a globally focused critical minerals company with a diversified asset base across uranium, rare earth elements (REEs), heavy mineral sands, vanadium, and medical isotopes. The company operates a range of conventional and in-situ recovery uranium assets in the western United States. It also holds three key heavy mineral sands projects, including the wholly owned Toliara (Vara Mada) Project in Madagascar, the Bahia Project in Brazil, and a stake in the Donald Project in Australia.
Kalkine’s “Global Critical Minerals Report” covers the Investment Highlights, Key Financial Metrics, Risks, Technical Analysis along with the Valuation, Target Price, and Recommendation on the stock.


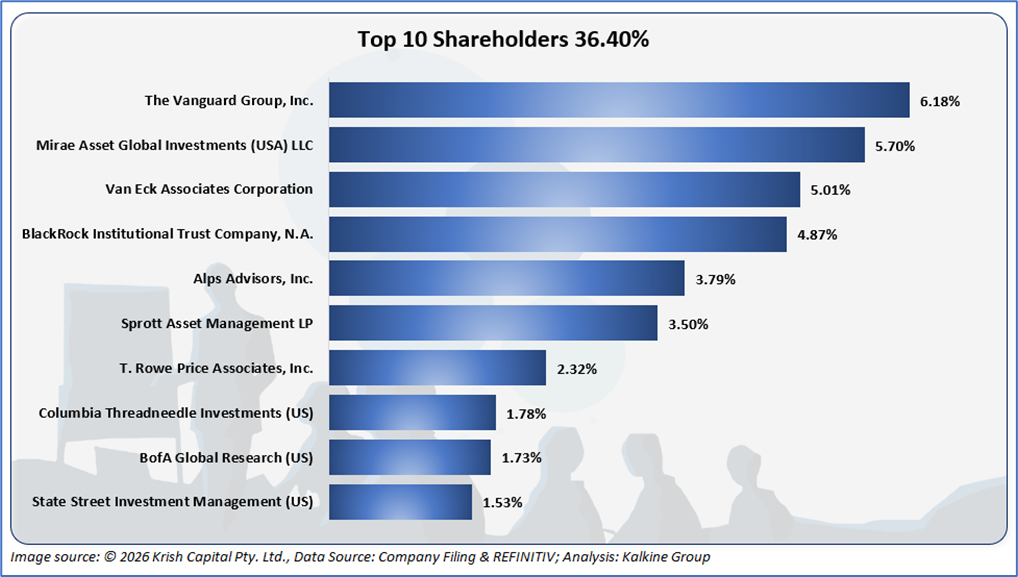
The top 8 shareholders together form ~36.40% of the total shareholding, signifying concentrated shareholding. The Vanguard Group, Inc. and Mirae Asset Global Investments (USA) LLC hold a maximum stake in the company at ~6.18% and ~5.70%, respectively.

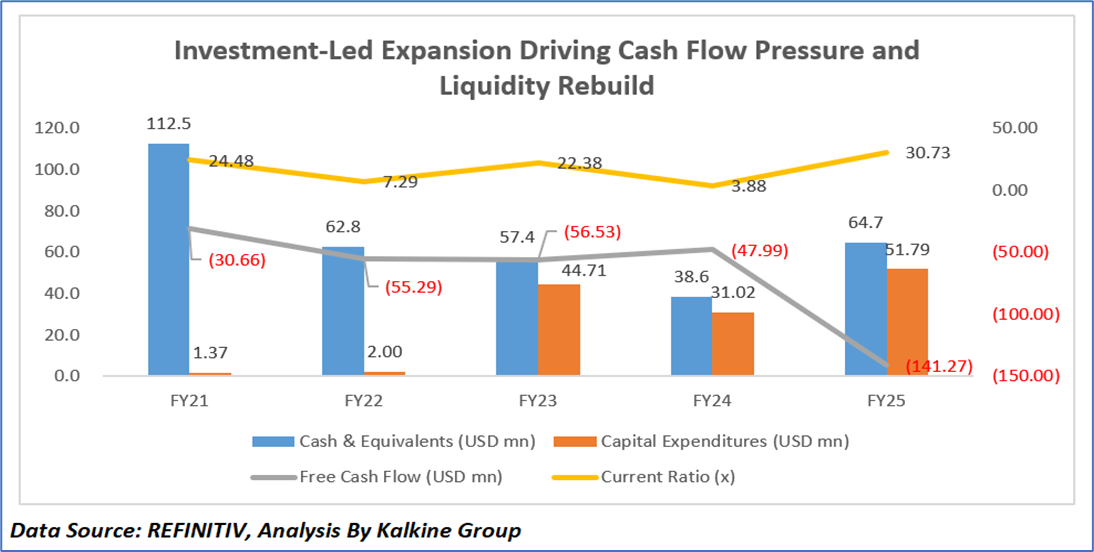
Capital Deployment and Cash Flow Pressure Amid Growth Transition
The chart reflects a clear shift from a conservative capital structure in FY21–FY22 to an investment-heavy growth phase from FY23 onwards. Cash & cash equivalents declined steadily through FY24 as the company deployed capital toward uranium production ramp-up, rare earth initiatives, and global project development. This period also saw a sharp increase in capital expenditures, particularly from FY23 to FY25, driven by investments in the White Mesa Mill, mine restarts, and heavy mineral sands projects. As a result, free cash flow remained consistently negative and deteriorated further in FY25, reflecting elevated operating costs, exploration spending, and expansion-related investments
Liquidity Strengthening, Elevated Current Ratio, and Financial Positioning
Despite sustained cash outflows, the company’s liquidity profile improved notably in FY25, supported by significant financing inflows, including proceeds from convertible debt issuance, which led to a recovery in cash balances and an improvement in the current ratio. The unusually high current ratio—particularly in FY21 and FY25—primarily reflects large cash holdings relative to modest short-term liabilities, driven by capital preservation in earlier periods and substantial fund-raising ahead of project execution in FY25. This indicates pre-deployment of capital for future investments rather than operational inefficiency, with the company maintaining strong liquidity buffers to support its long-term expansion strategy.
Section 2: Business Updates and Financial Highlights

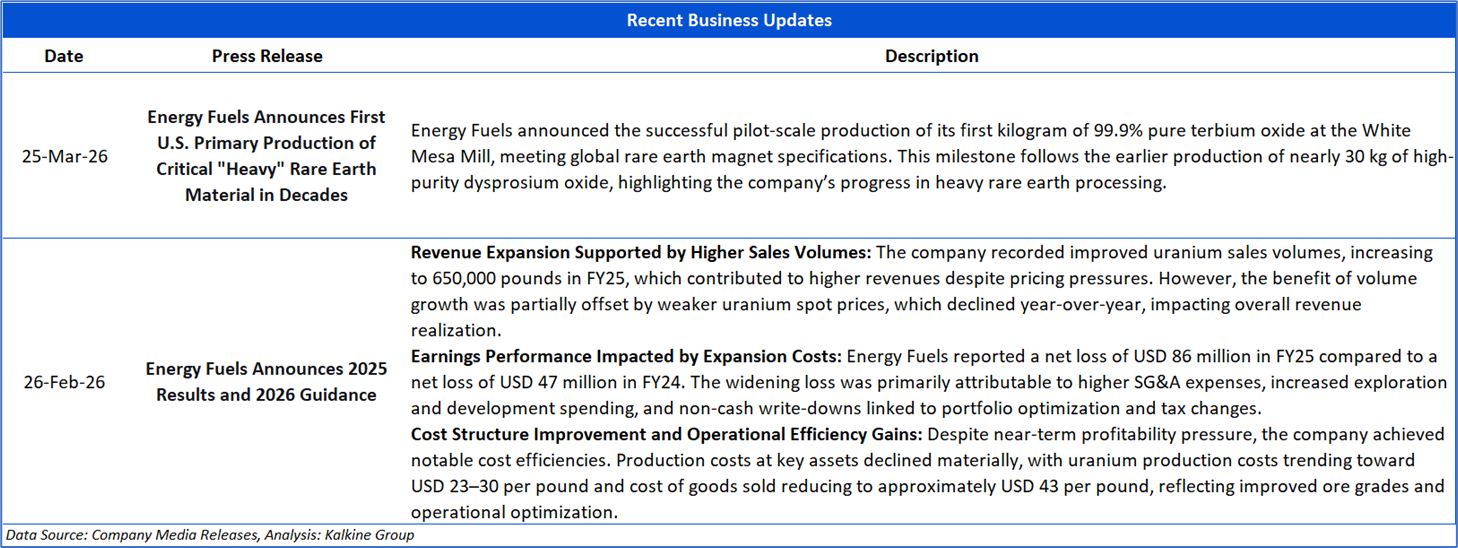

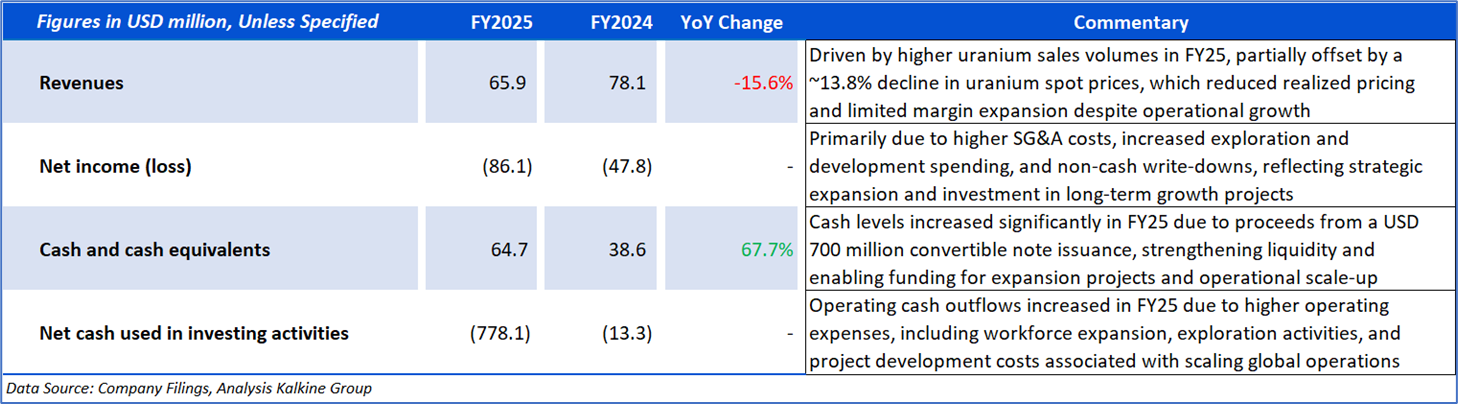
Section 3: Key Risks and Company Outlook
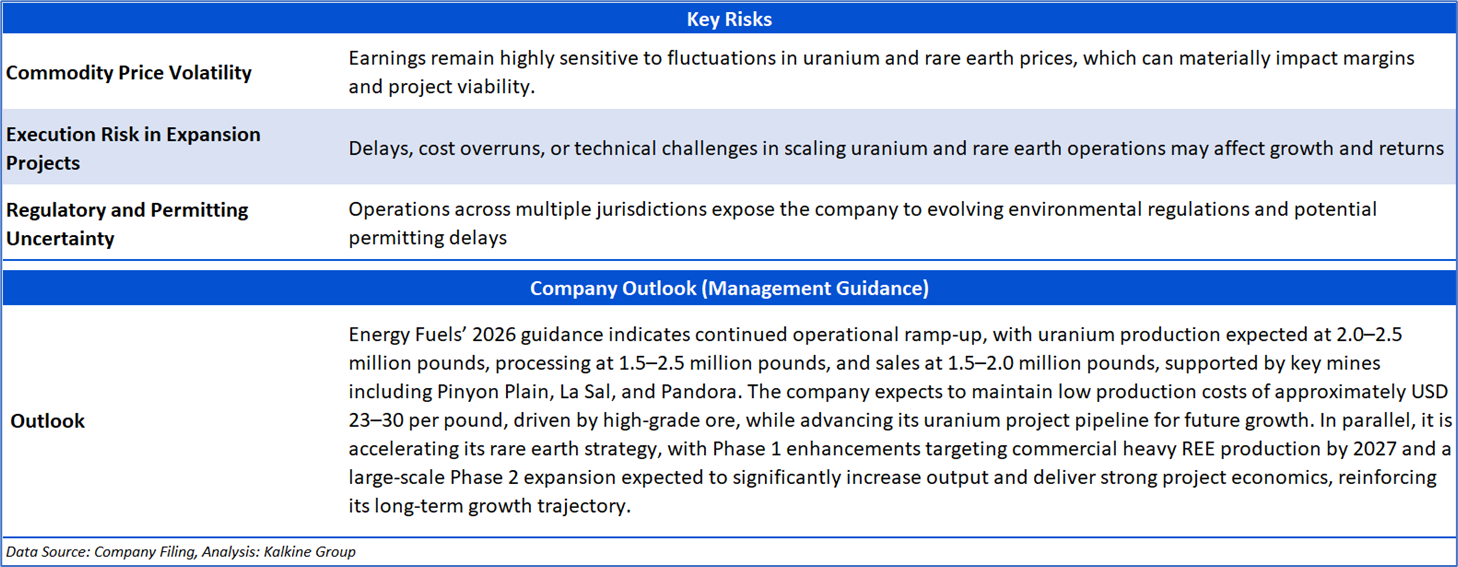
Section 4: Stock Recommendation Summary

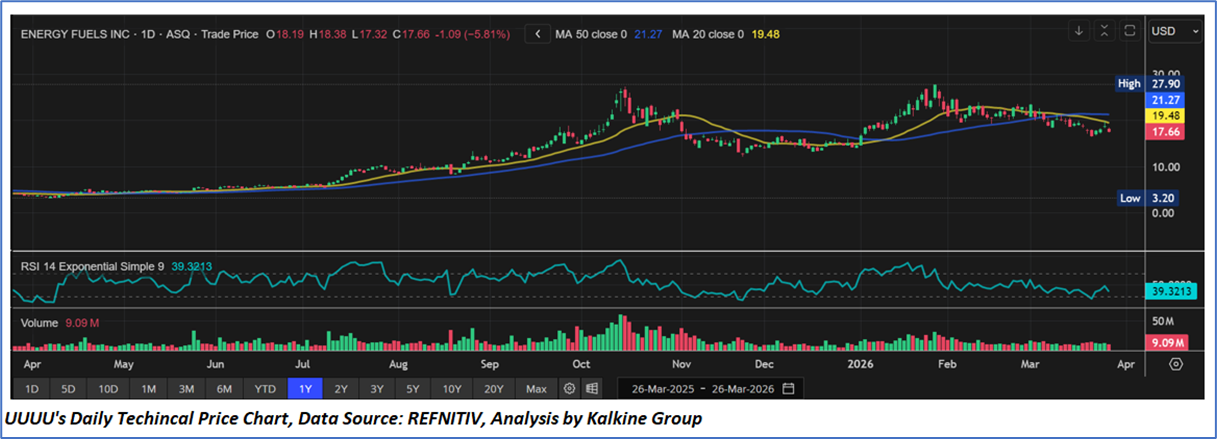
Stock Performance:
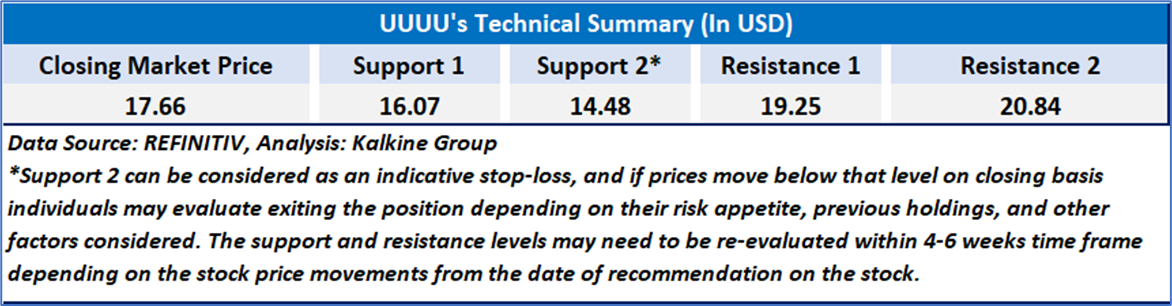
- The stock witnessed a strong upward trend through mid-to-late 2025, supported by higher highs and higher lows, before transitioning into a consolidation phase in recent months.
- The price is currently trading below the 50-day moving average (USD 21.27) and near the 20-day moving average (USD 19.48), indicating weakening short-term momentum and a neutral-to-bearish near-term bias.
- After peaking near USD 27–28, the stock has failed to sustain higher levels, forming a pattern of lower highs, suggesting reduced buying strength.
- The RSI is around 39, reflecting subdued momentum and approaching the lower end of the neutral range, which may indicate mild selling pressure but not yet oversold conditions.
- Volume spikes during earlier rallies have not been sustained, and recent volumes appear moderate, indicating lack of strong conviction from buyers at current levels.

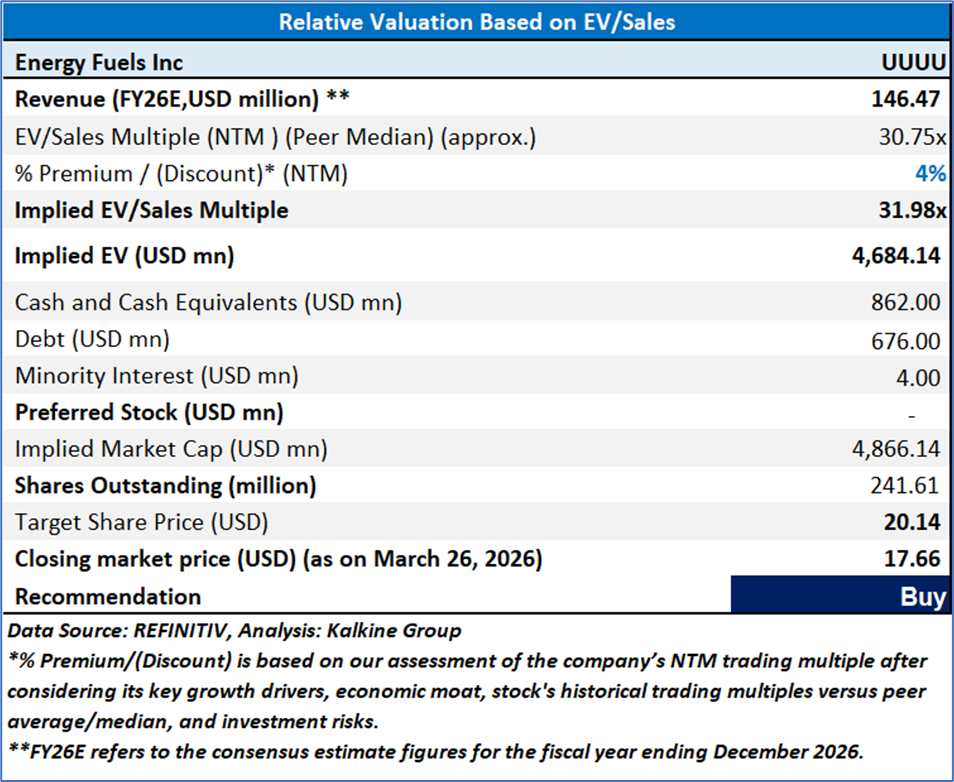
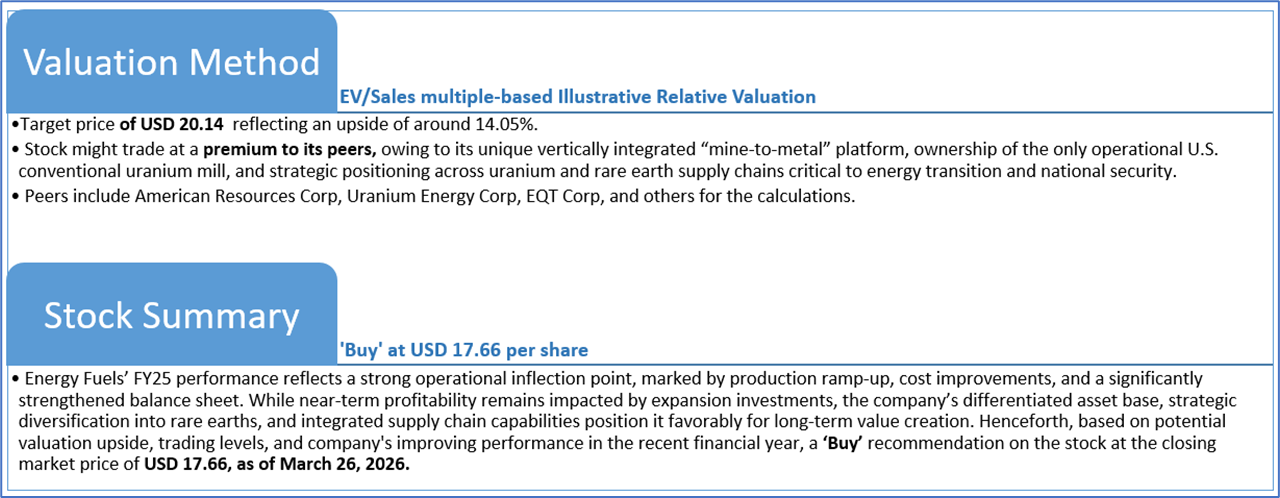
Valuation Methodology: EV to Sales Based Relative Valuation (Illustrative)
Markets are trading in a highly volatile zone currently due to certain macroeconomic issues and geopolitical tensions prevailing. Therefore, it is prudent to follow a cautious approach while investing.
Note 1: Past performance is not a reliable indicator of future performance.
Note 2: The reference date for all price data, currency, technical indicators, support, and resistance levels is March 26, 2026. The reference data in this report has been partly sourced from REFINITIV.
Note 3: Investment decisions should be made depending on an individual's appetite for upside potential, risks, holding duration, and any previous holdings. An 'Exit' from the stock can be considered if the Target Price mentioned as per the Valuation and or the technical levels provided has been achieved and is subject to the factors discussed above.
Note 4: Dividend Yield may vary as per the stock price movement.
Note 5: Kalkine reports are prepared based on the stock prices captured either from REFINITIV or Trading View. Typically, REFINITIV or Trading View may reflect stock prices with a delay which could be a lag of 25-30 minutes. There can be no assurance that future results or events will be consistent with the information provided in the report. The information is subject to change without any prior notice.
Technical Indicators Defined: -
Support: A level at which the stock prices tend to find support if they are falling, and a downtrend may take a pause backed by demand or buying interest. Support 1 refers to the nearby support level for the stock and if the price breaches the level, then Support 2 may act as the crucial support level for the stock.
Resistance: A level at which the stock prices tend to find resistance when they are rising, and an uptrend may take a pause due to profit booking or selling interest. Resistance 1 refers to the nearby resistance level for the stock and if the price surpasses the level, then Resistance 2 may act as the crucial resistance level for the stock.
Stop-loss: It is a level to protect further losses in case of unfavourable movement in the stock prices.
Past performance is not a reliable indicator of future performance.

 NZ
 UK
 US
 AU
 IND

 CA

 Please wait processing your request...