Section 1: Company Overview and Fundamentals
1.1Company Overview:
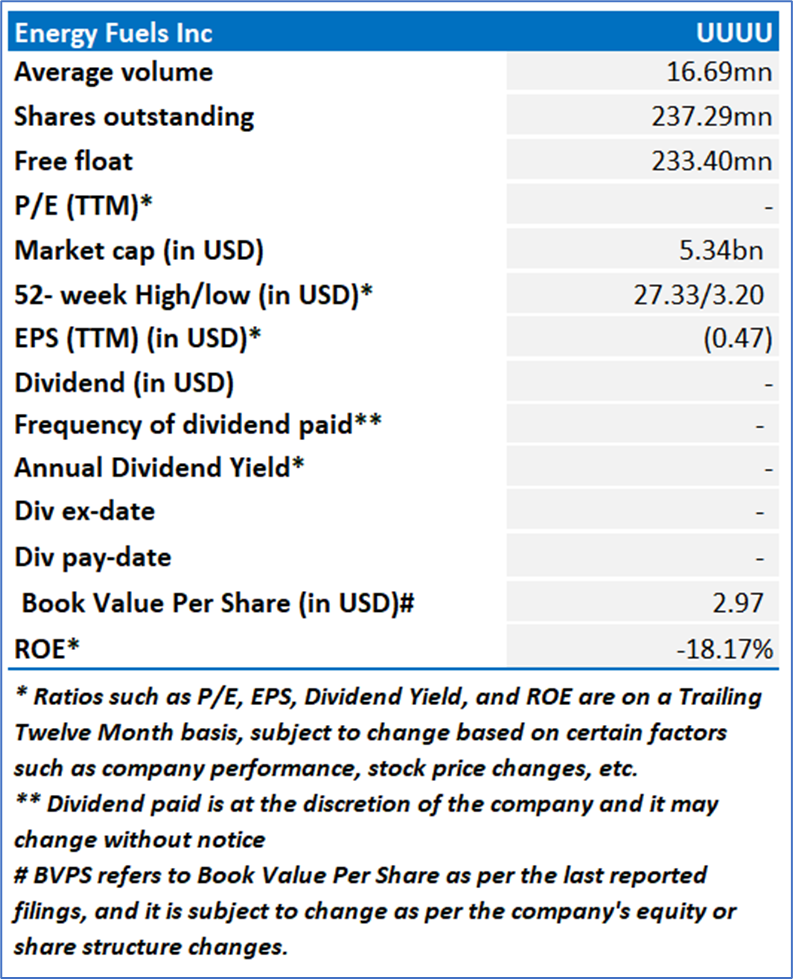
Energy Fuels Inc. (NYSE: UUUU) is a global critical mineral company. The Company focuses on uranium, rare earth elements (REEs), heavy mineral sands, vanadium and medical isotopes. The Company owns and operates several conventional and in-situ recovery uranium projects in the western United States.
Kalkine’s Diversified Opportunities Report covers the Company Overview, Key positives & negatives, Investment summary, Key investment metrics, Top 10 shareholding, Business updates and insights into company recent financial results, Key Risks & Outlook, Price performance and technical summary, Target Price, and Recommendation on the stock.
Stock Performance:
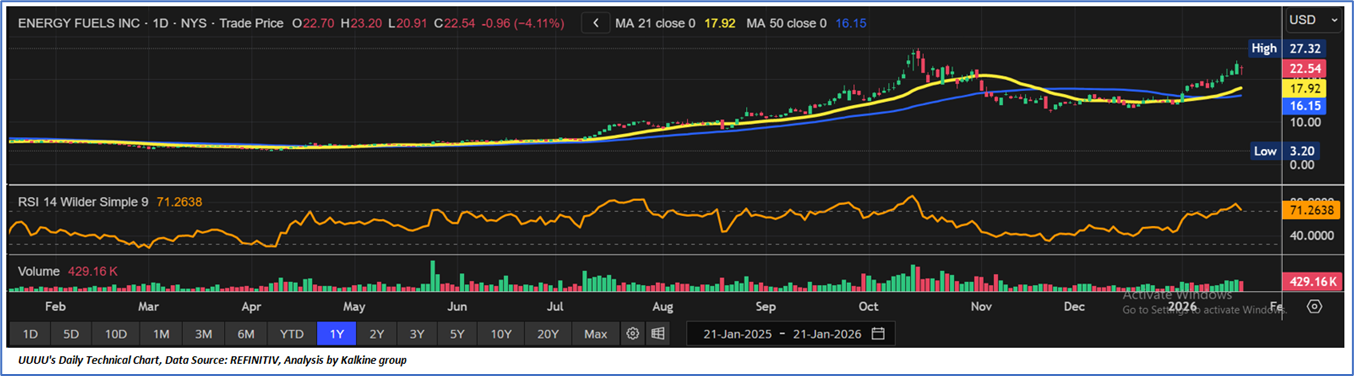
- Trend Structure and Moving Averages: Energy Fuels Inc. (UUUU) remains in a medium-term uptrend, with price holding above rising short- and medium-term moving averages. Recent weakness appears corrective, and trend integrity remains intact so long as these dynamic support levels are maintained.
- Momentum Indicators: The RSI reflects strong momentum and relative strength, albeit at elevated levels that may invite short-term consolidation. The absence of clear bearish divergence suggests momentum continues to support the prevailing uptrend rather than indicating a reversal.
- Volume and Technical Bias: Volume patterns indicate accumulation during advances, supporting the constructive technical structure. Overall, the technical bias remains positive, with upside continuation dependent on sustained volume support, while a breakdown below key averages would weaken the near-term outlook.
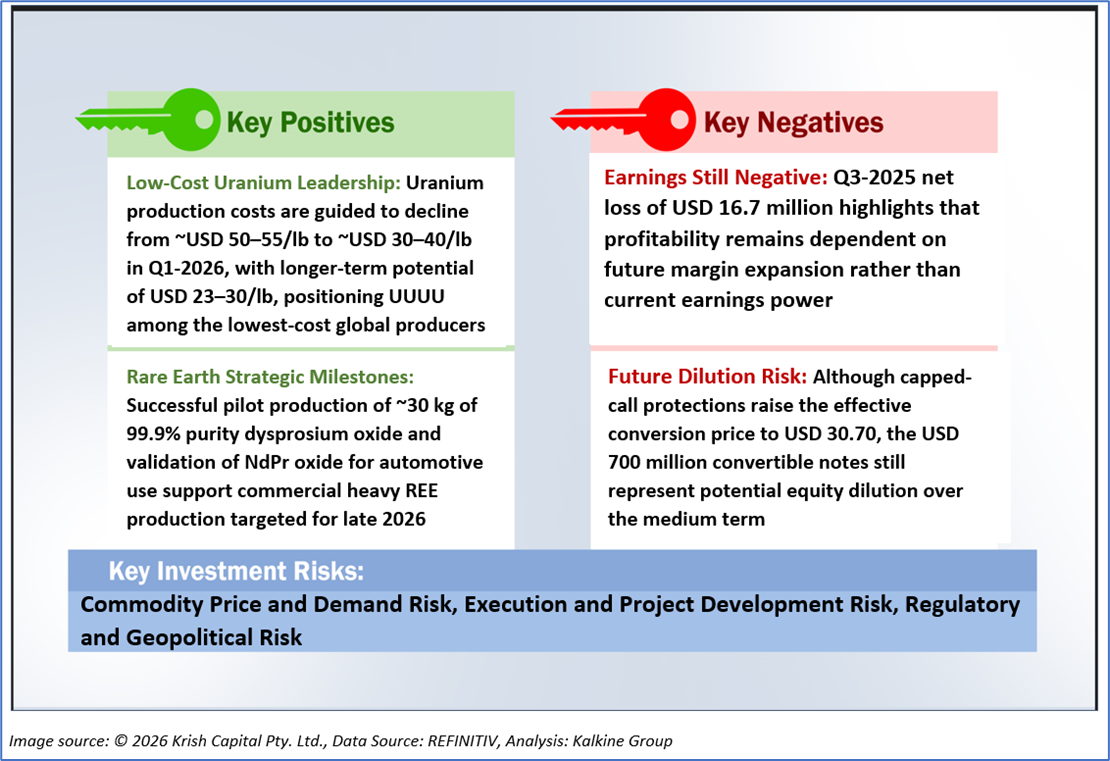
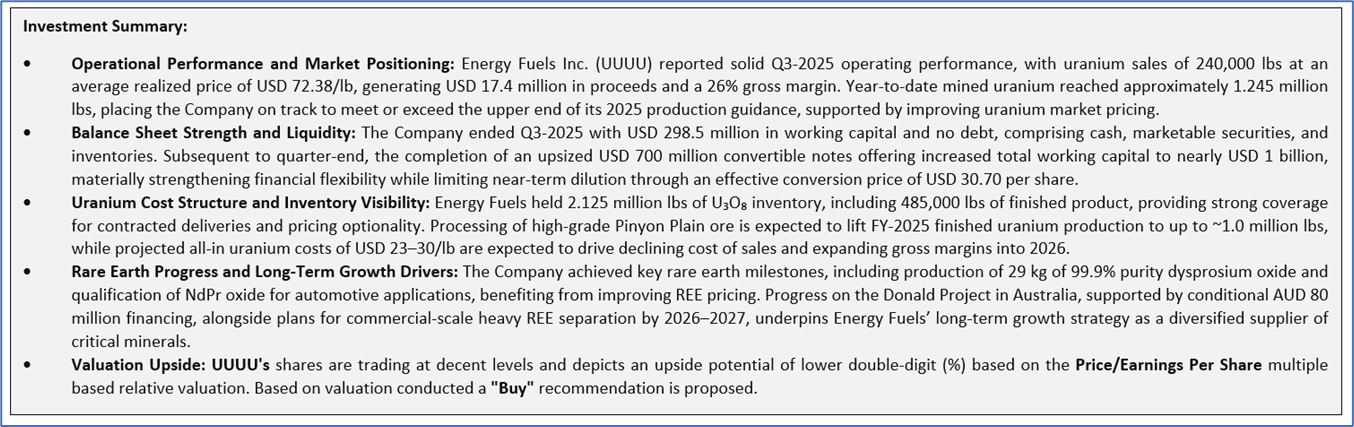
1.2 The Key Positives, Negatives, and Investment summary
1.3 Top 10 shareholders:
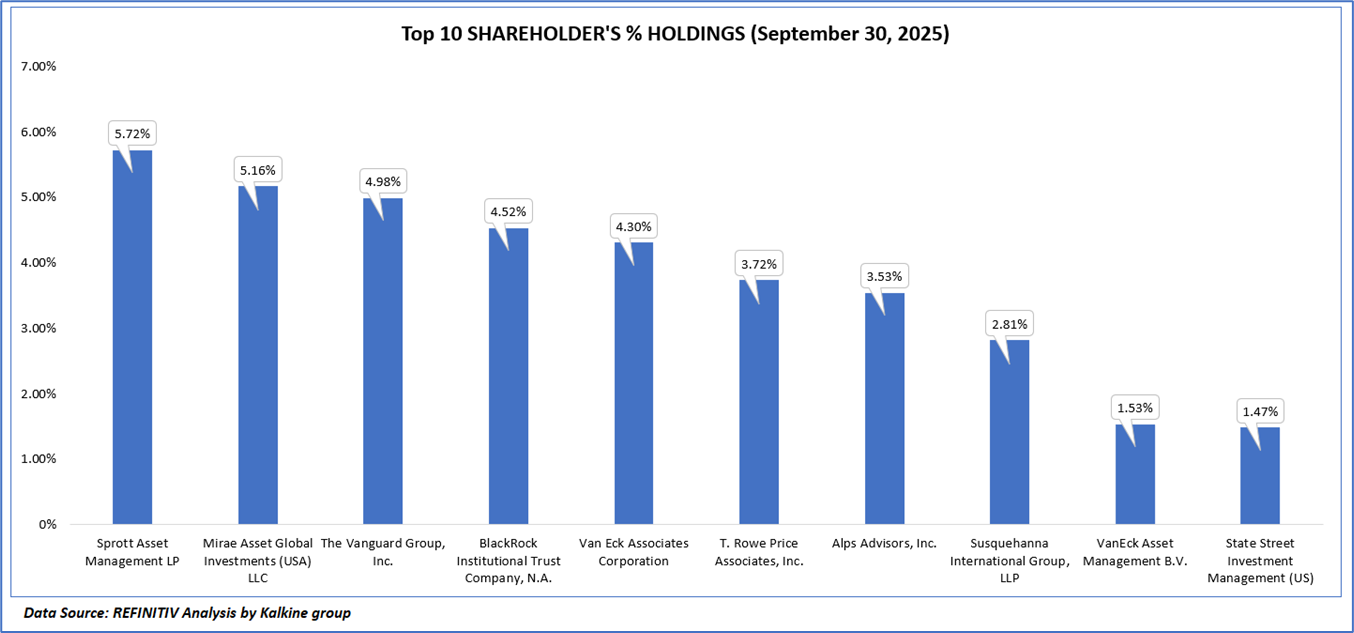
The top 10 shareholders together form ~37.74% of the total shareholding, signifying concentrated shareholding. Sprott Asset Management LP, Mirae Asset Global Investments (USA) LLC are the biggest shareholders, holding the maximum stake in the company at 5.72% and 5.16%, respectively.
1.4 Key Metrics
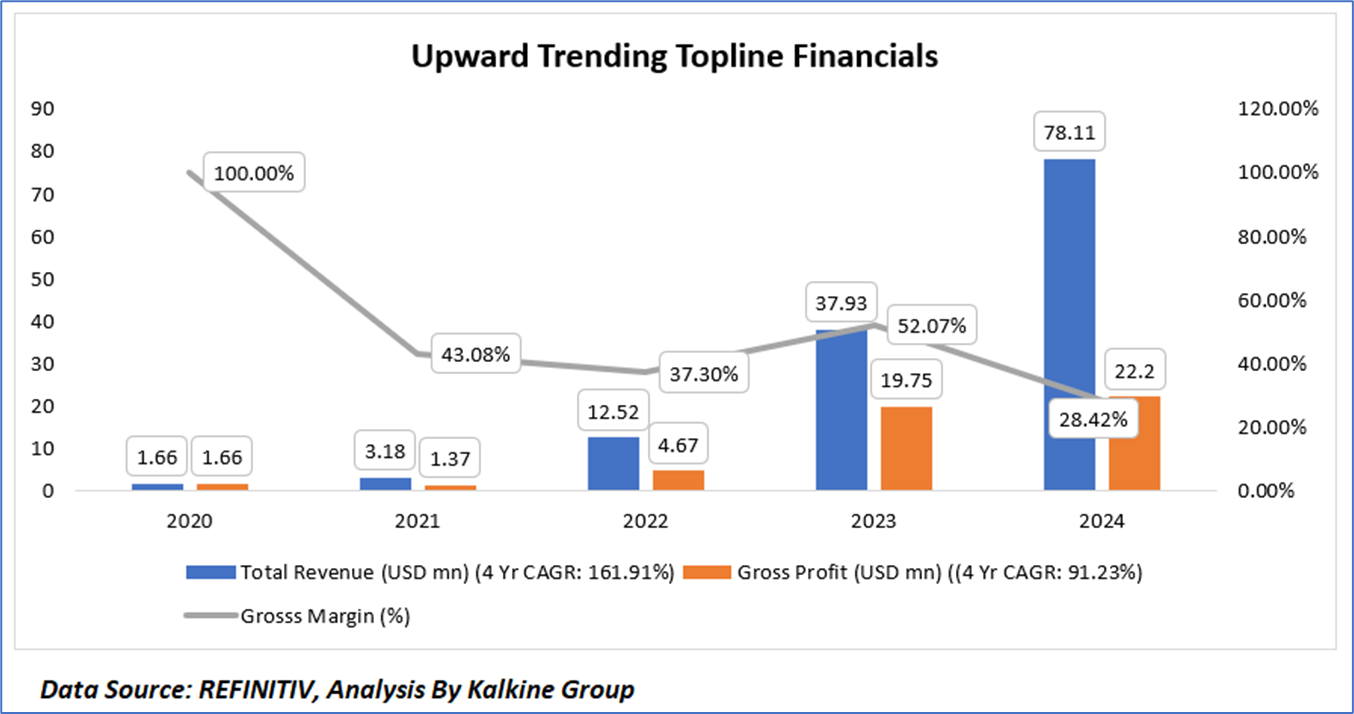
Energy Fuels Inc. (UUUU) has demonstrated a strong top-line expansion over the period 2020–2024, with total revenue increasing from USD 1.66 million to USD 78.11 million, reflecting a four-year CAGR of 161.91%, driven primarily by the ramp-up in uranium sales and improved market pricing. Gross profit also expanded meaningfully from USD 1.66 million to USD 22.2 million, translating into a solid four-year CAGR of 91.23%, underscoring the Company’s ability to scale operations despite sector cyclicality. However, gross margin performance has been volatile, declining from 100% in 2020 to 28.42% in 2024, after peaking at 52.07% in 2023, reflecting a combination of inventory cost mix, timing of sales, production ramp-up inefficiencies, and exposure to commodity price fluctuations. Overall, the data indicates a transition from a very low revenue base to a materially larger operating scale, with near-term margin compression offset by management’s stated focus on cost reductions and higher-margin production as low-cost uranium output increases.
Section 2: Business Updates and Corporate Business Highlights
2.1 Recent Updates:
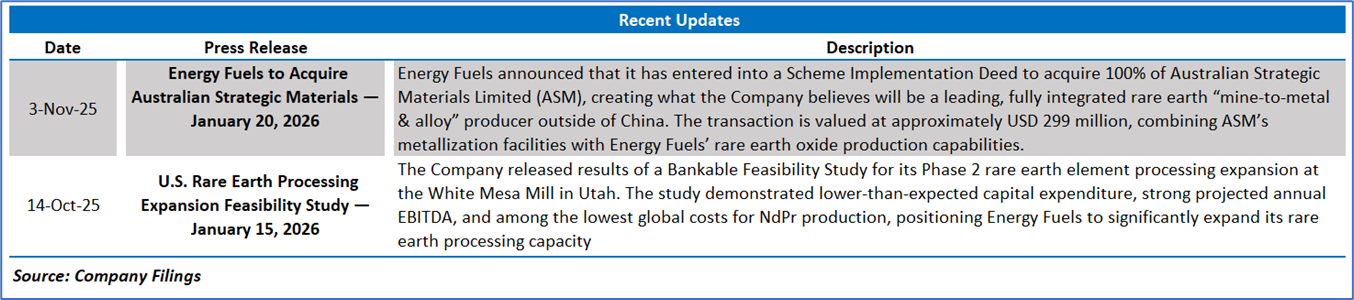
The below picture gives an overview of the recent updates:
2.2 Insights of Q3FY25:
Section 3: Key Risks & Outlook
Section 4: Stock Recommendation Summary:
4.1 Price Performance and Technical Summary:
Stock Performance:
- Trend Structure and Moving Averages: Energy Fuels Inc. (UUUU) remains in a medium-term uptrend, with price holding above rising short- and medium-term moving averages. Recent weakness appears corrective, and trend integrity remains intact so long as these dynamic support levels are maintained.
- Momentum Indicators: The RSI reflects strong momentum and relative strength, albeit at elevated levels that may invite short-term consolidation. The absence of clear bearish divergence suggests momentum continues to support the prevailing uptrend rather than indicating a reversal.
- Volume and Technical Bias: Volume patterns indicate accumulation during advances, supporting the constructive technical structure. Overall, the technical bias remains positive, with upside continuation dependent on sustained volume support, while a breakdown below key averages would weaken the near-term outlook.
4.2 Fundamental Valuation
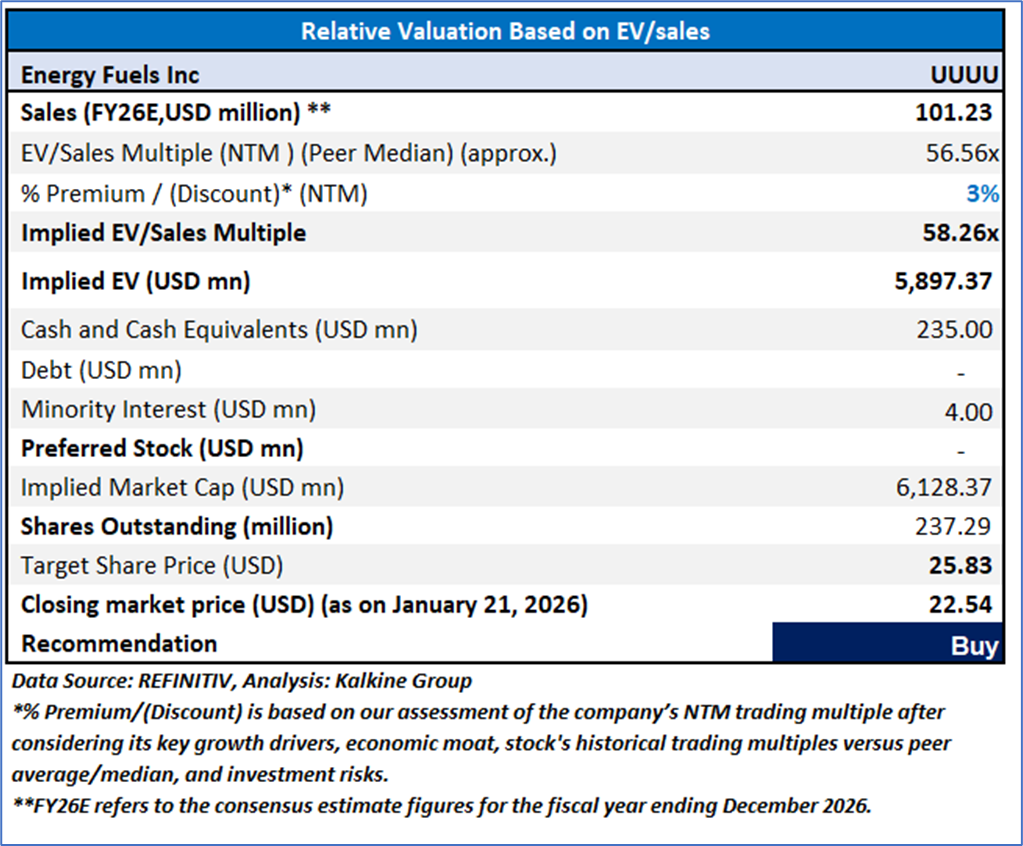
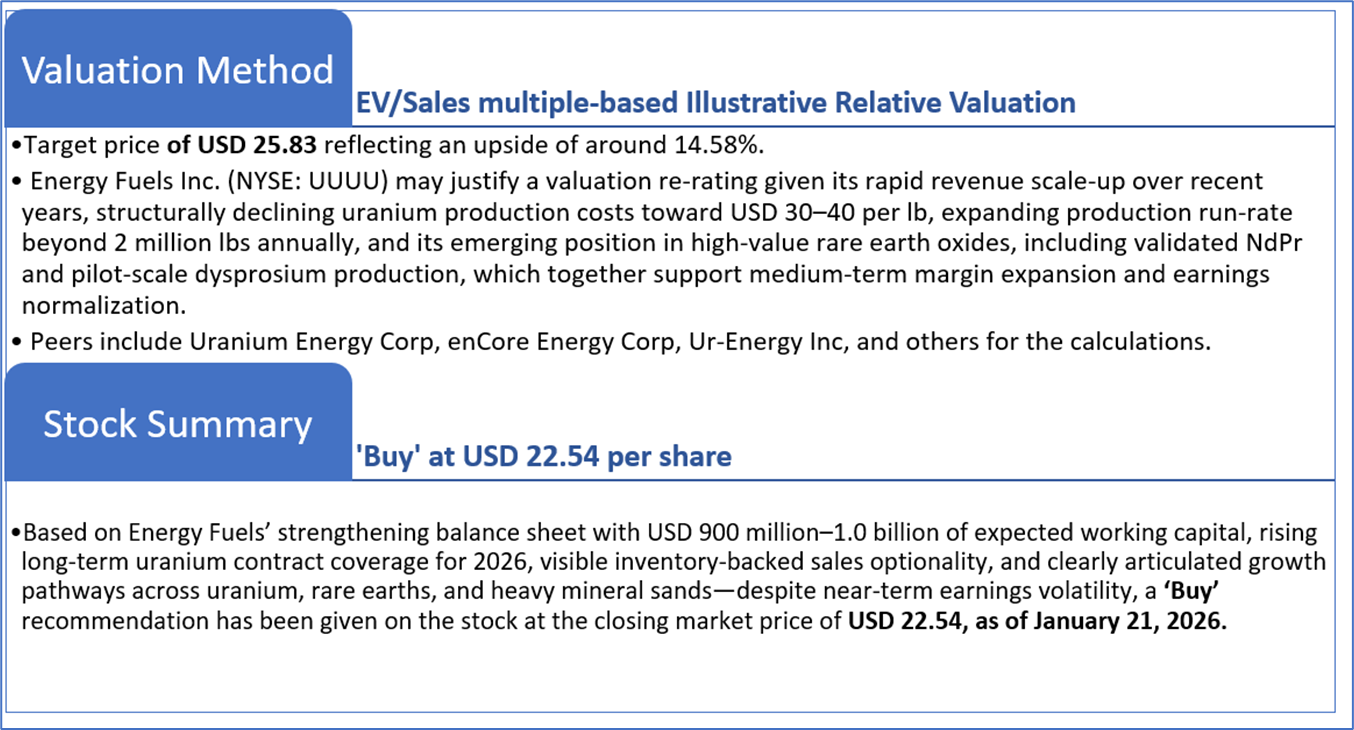
Valuation Methodology: EV/Sales Multiple Based Relative Valuation
Markets are trading in a highly volatile zone currently due to certain macroeconomic issues and geopolitical tensions prevailing. Therefore, it is prudent to follow a cautious approach while investing.
Note 1: Past performance is not a reliable indicator of future performance.
Note 2: The reference date for all price data, currency, technical indicators, support, and resistance levels is January 21, 2026. The reference data in this report has been partly sourced from REFINITIV.
Note 3: Investment decisions should be made depending on an individual's appetite for upside potential, risks, holding duration, and any previous holdings. An 'Exit' from the stock can be considered if the Target Price mentioned as per the Valuation and or the technical levels provided has been achieved and is subject to the factors discussed above.
Note 4: The report publishing date is as per the Pacific Time Zone.
Technical Indicators Defined: -
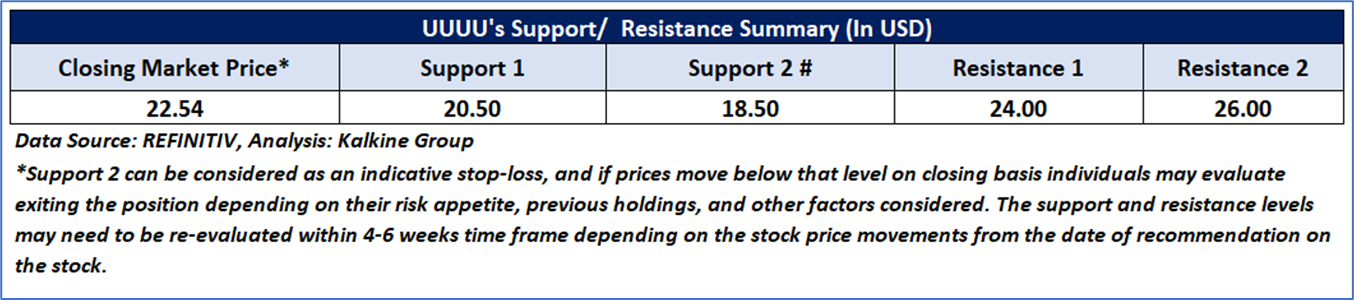
Support: A level at which the stock prices tend to find support if they are falling, and a downtrend may take a pause backed by demand or buying interest. Support 1 refers to the nearby support level for the stock and if the price breaches the level, then Support 2 may act as the crucial support level for the stock.
Resistance: A level at which the stock prices tend to find resistance when they are rising, and an uptrend may take a pause due to profit booking or selling interest. Resistance 1 refers to the nearby resistance level for the stock and if the price surpasses the level, then Resistance 2 may act as the crucial resistance level for the stock.
Stop-loss: It is a level to protect against further losses in case of unfavorable movement in the stock prices.
Past performance is not a reliable indicator of future performance.

 NZ
 UK
 US
 AU
 IND

 CA

 Please wait processing your request...