Section 1: Company Overview and Fundamentals
1.1 Company Overview:
Energy Fuels Inc (NYSE: UUUU) is an international critical minerals producer with a diversified portfolio spanning uranium, rare earth elements (REEs), heavy mineral sands, vanadium, and medical isotopes. The company owns and operates multiple conventional and in-situ recovery uranium assets across the western United States. In addition, it holds three heavy mineral sands projects, including the wholly owned Toliara (Vara Mada) Project in Madagascar, the fully owned Bahia Project in Brazil, and an interest in the Donald Project located in Australia.
Kalkine’s Low Carbon Research Report covers the Investment Highlights, Low Carbon Emission Initiatives, Key Financial Metrics, Risks, and Technical Analysis along with the Valuation, Target Price, and Recommendation on the stock.
Stock Performance:
- The stock remains in a broader medium-term uptrend despite a corrective pullback from its 52-week high near USD 27.89.
- Current price (USD 21.39) is trading between the 20-day moving average (USD 22.52) and the 50-day moving average (USD 19.35), indicating short-term consolidation within a constructive intermediate trend.
- The 50-day moving average continues to slope upward, supporting a positive medium-term bias, while the flattening 20-day moving average reflects near-term sideways movement.
- Price action since December shows a pattern of higher lows, suggesting accumulation on dips rather than distribution.
- Immediate resistance is seen in the USD 22.52–USD 23.00 zone, with stronger overhead resistance near USD 27.50–USD 28.00.
- Key support is positioned around USD 19.00–USD 20.00, aligned with the 50-day moving average and prior breakout levels.
- RSI (14) near 48 indicates neutral momentum, consistent with a base-building phase rather than an overextended condition.
- Volume has moderated during consolidation, implying reduced volatility and a potential setup for a directional breakout.
1.2 Why do Low Carbon Emissions matter?
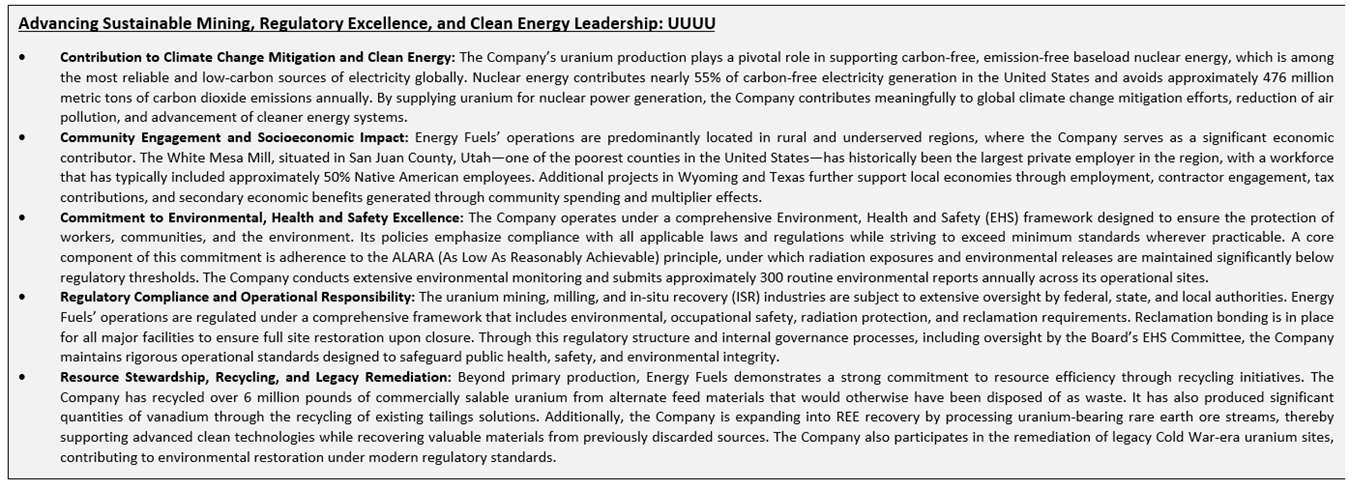
The shift toward a low-carbon economy is one of the most significant challenges of current time, spurred by the urgent need to combat climate change and reduce the environmental impact of corporate activities. This report covers the US-listed low-carbon emission company Energy Fuels Inc (NYSE: UUUU), that is committed to sustainability and responsible environmental practices.
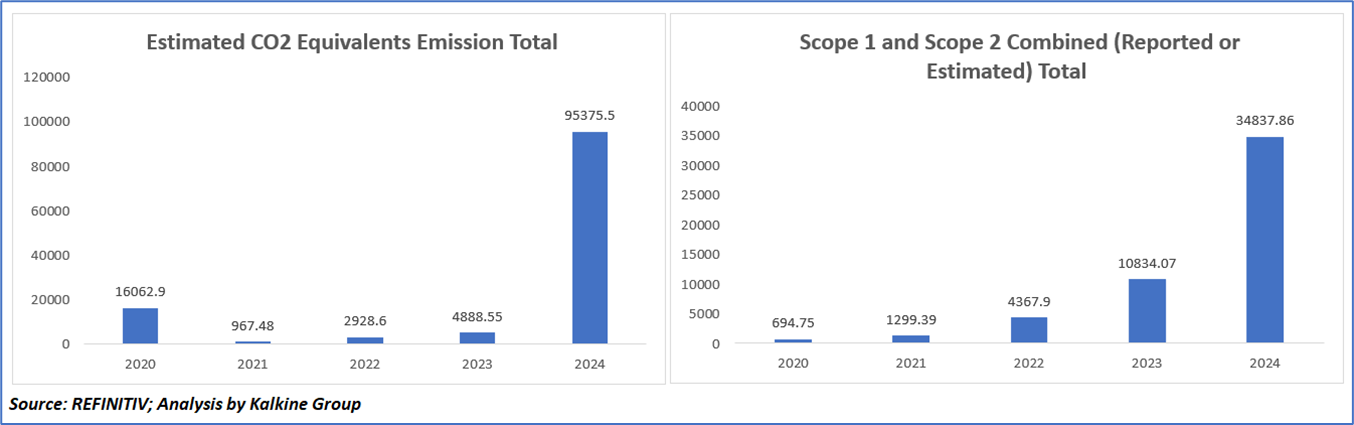
Sharp Emissions Expansion Driven by 2024 Operational Scale-Up
The emissions data reflects moderate volatility between 2020 and 2023, followed by a pronounced structural escalation in 2024. Total estimated CO₂ equivalent emissions declined sharply in 2021 before gradually increasing through 2023, but surged significantly to 95,375.5 in 2024, indicating a substantial expansion in operational activity or reporting scope. Similarly, Scope 1 and Scope 2 emissions exhibited a steady upward trajectory over the five-year period, culminating in a sharp rise to 34,837.86 in 2024. The widening gap between total emissions and Scope 1 and 2 in 2024 suggests a material increase in indirect or value-chain-related emissions. Overall, the data points to accelerated operational intensity in 2024, with implications for environmental management and sustainability oversight.
Peer Comparison:

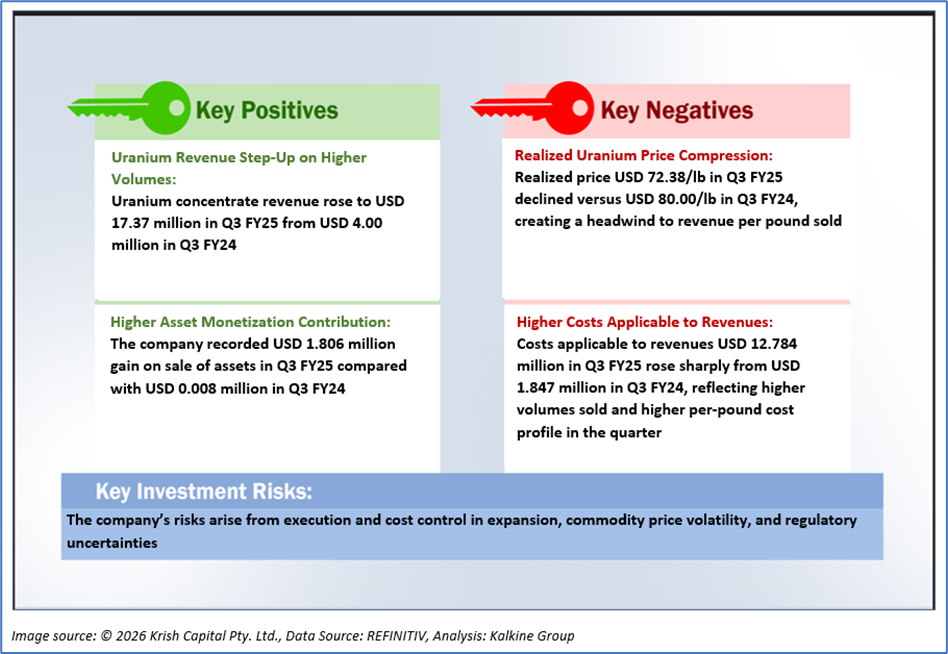
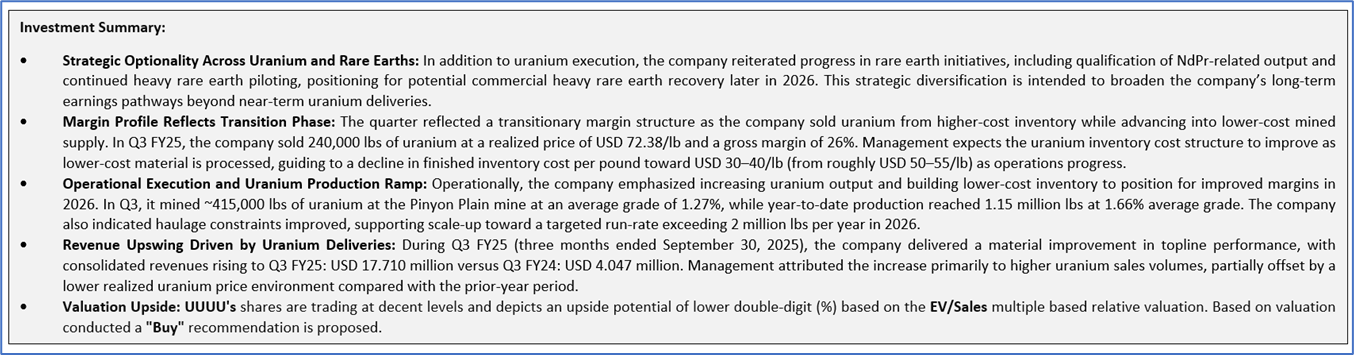
1.2 The Key Positives, Negatives, and Investment summary
1.3 Top 10 shareholders:
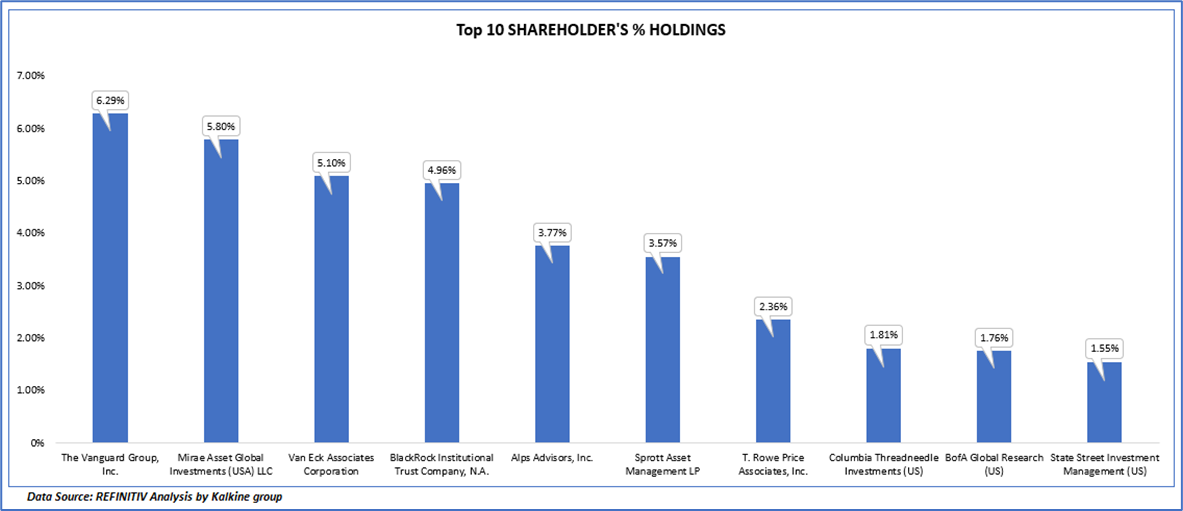
The top 10 shareholders together form ~36.97% of the total shareholding, signifying concentrated shareholding. The Vanguard Group, Inc. and Mirae Asset Global Investments (USA) LLC are the biggest shareholders, holding the maximum stake in the company at 6.29% and 5.80%, respectively.
1.4 Key Metrics
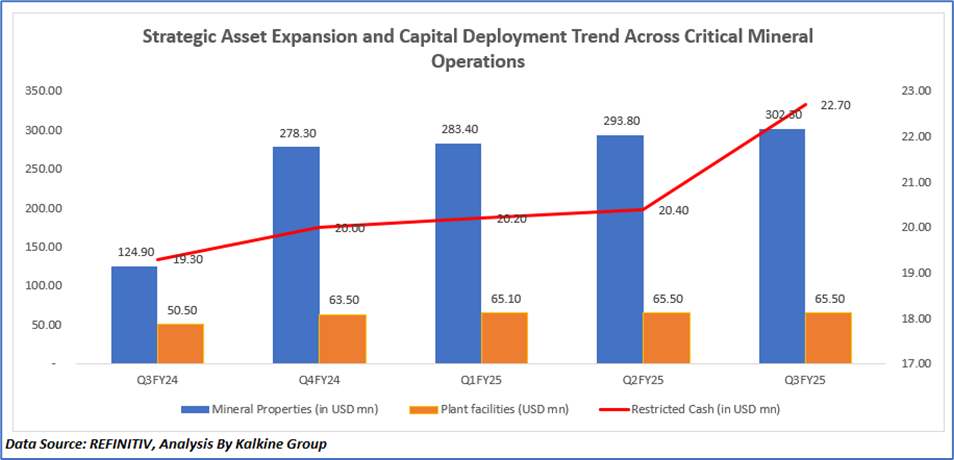
Strategic Asset Expansion and Capital Deployment Trend Across Critical Mineral Operations
The chart indicates that the expansion in the balance sheet is structural in nature, reflecting a strategic reconfiguration of the asset base rather than cyclical operational movements. The sharp inflection in mineral properties in Q4 FY24 marks a transformative capital event, namely the acquisition of Base Resources, which materially diversified the Company’s revenue optionality by integrating large-scale heavy mineral sands and rare earth assets such as Toliara and Kwale. The subsequent quarter-over-quarter accretion through FY25 suggests ongoing capitalization of development-stage expenditures, including drilling at Pinyon Plain and advancement activities at Bahia and Toliara, signaling progression along the project lifecycle curve rather than passive asset holding.
The measured increase in plant facilities reflects calibrated capital allocation toward downstream integration, particularly the expansion of rare earth separation capacity at the White Mesa Mill, positioning the Company to capture greater value within the REE supply chain while supporting uranium production scalability. Meanwhile, the steady rise in restricted cash implies growing regulatory, reclamation, and bonding commitments, consistent with an enlarging operational footprint and higher compliance intensity. Overall, the trajectory underscores deliberate balance sheet build-out aligned with long-term critical mineral positioning, vertical integration, and production ramp strategy, suggesting capital is being deployed with an emphasis on scale, optionality, and future margin leverage.
Section 2: Business Updates and Corporate Business Highlights
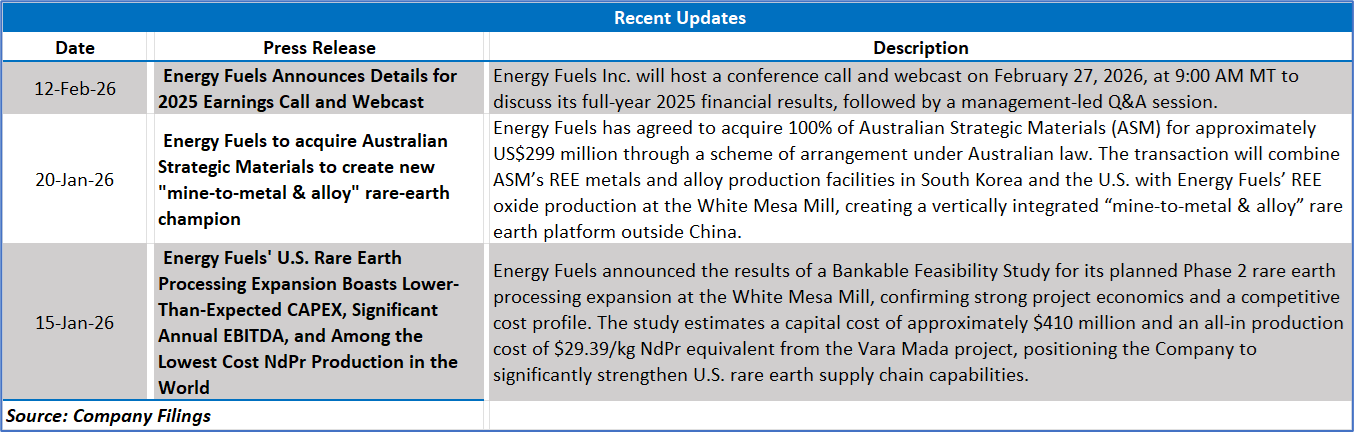
2.1 Key Business Updates:
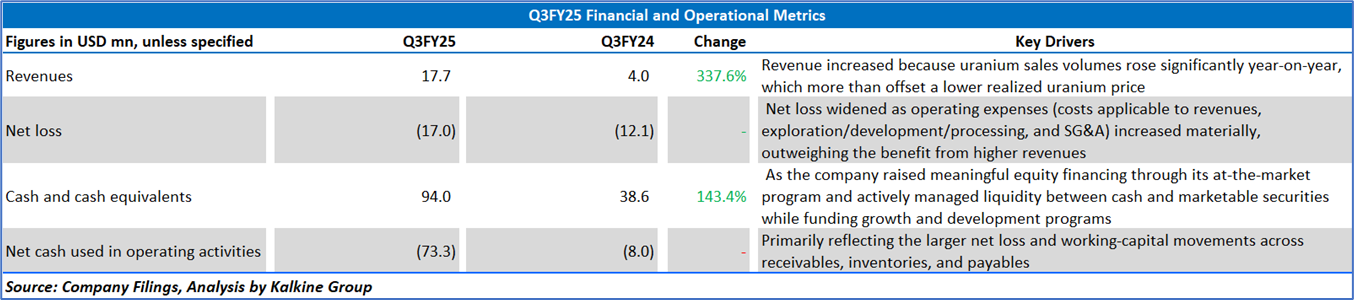
2.2 Insights of Q3 FY25:
Section 3: Key Risks & Outlook
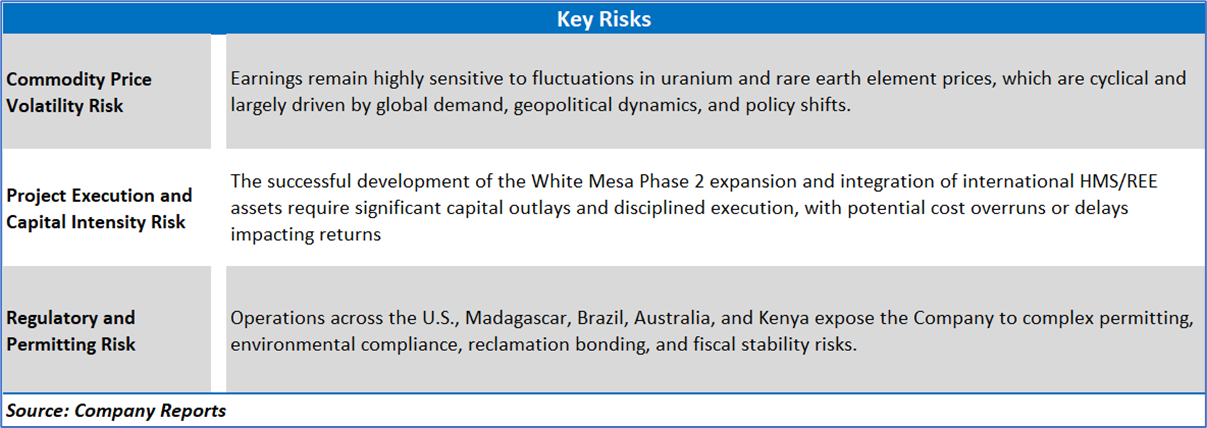
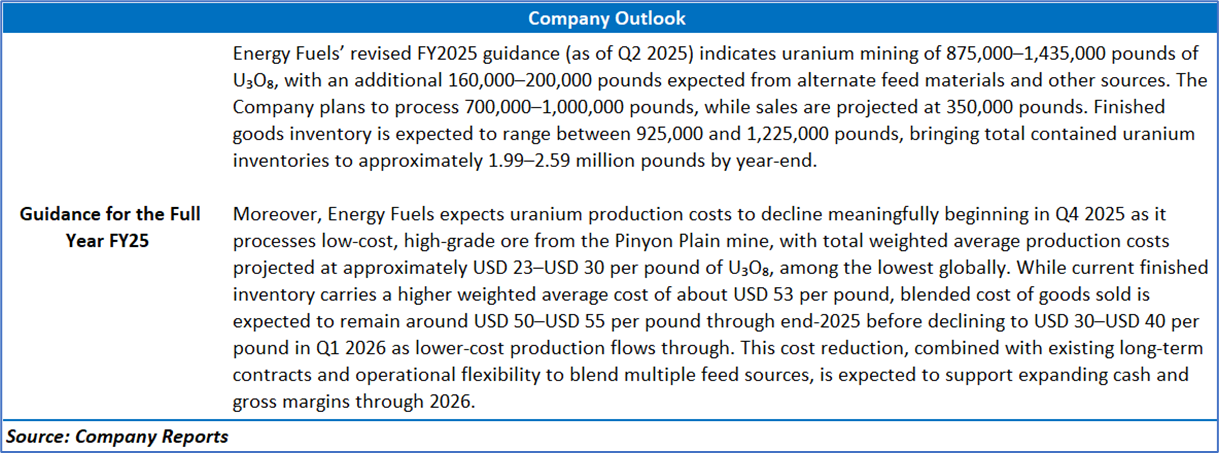
Section 4: Stock Recommendation Summary:
4.1 Price Performance and Technical Summary:
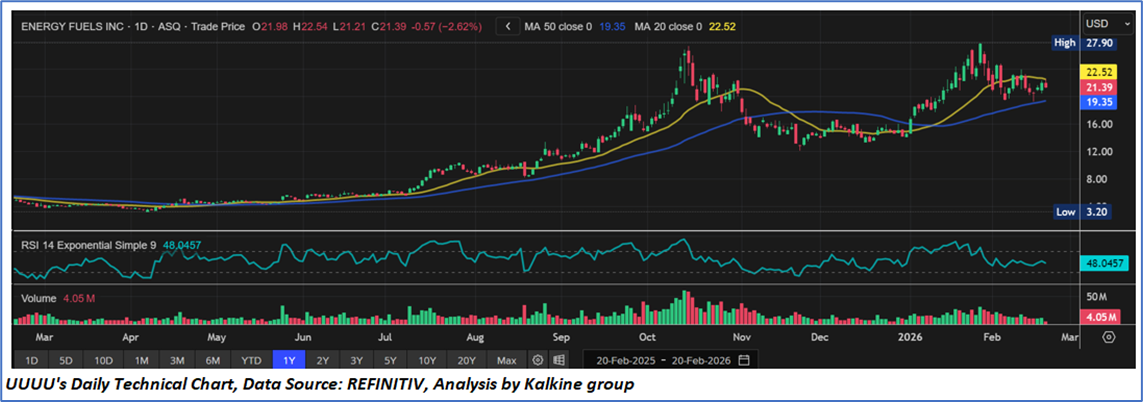
Stock Performance:
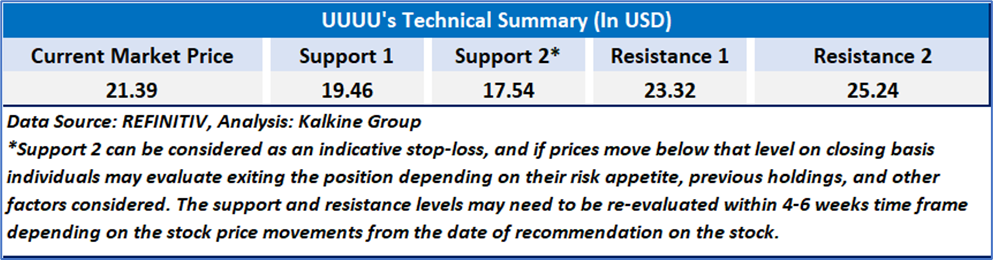
- The stock remains in a broader medium-term uptrend despite a corrective pullback from its 52-week high near USD 27.89.
- Current price (USD 21.39) is trading between the 20-day moving average (USD 22.52) and the 50-day moving average (USD 19.35), indicating short-term consolidation within a constructive intermediate trend.
- The 50-day moving average continues to slope upward, supporting a positive medium-term bias, while the flattening 20-day moving average reflects near-term sideways movement.
- Price action since December shows a pattern of higher lows, suggesting accumulation on dips rather than distribution.
- Immediate resistance is seen in the USD 22.52–USD 23.00 zone, with stronger overhead resistance near USD 27.50–USD 28.00.
- Key support is positioned around USD 19.00–USD 20.00, aligned with the 50-day moving average and prior breakout levels.
- RSI (14) near 48 indicates neutral momentum, consistent with a base-building phase rather than an overextended condition.
- Volume has moderated during consolidation, implying reduced volatility and a potential setup for a directional breakout.
4.2 Fundamental Valuation
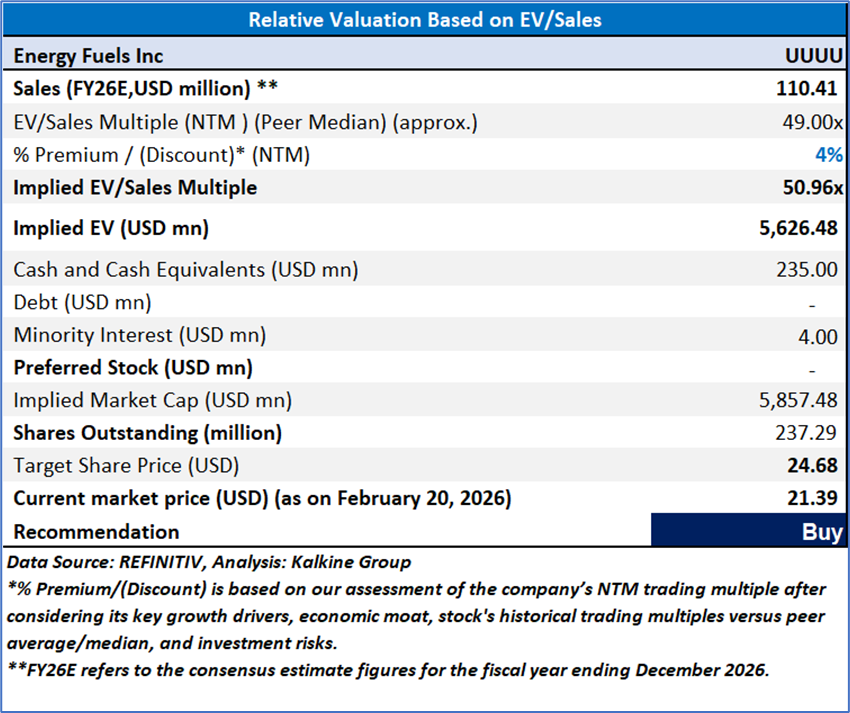
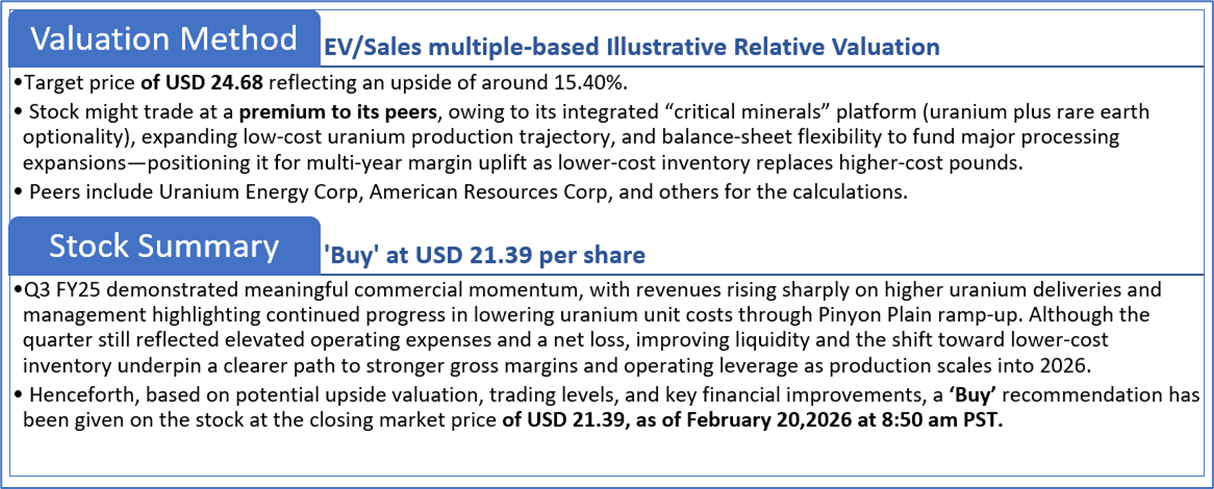
Valuation Methodology: Enterprise Value to Sales (EV/Sales) Multiple Based Relative Valuation
Markets are trading in a highly volatile zone currently due to certain macroeconomic issues and geopolitical tensions prevailing. Therefore, it is prudent to follow a cautious approach while investing.
Note 1: Past performance is not a reliable indicator of future performance.
Note 2: The reference date for all price data, currency, technical indicators, support, and resistance levels is Feb 20,2026. The reference data in this report has been partly sourced from REFINITIV.
Note 3: Investment decisions should be made depending on an individual's appetite for upside potential, risks, holding duration, and any previous holdings. An 'Exit' from the stock can be considered if the Target Price mentioned as per the Valuation and or the technical levels provided has been achieved and is subject to the factors discussed above.
Note 4: The report publishing date is as per the Pacific Time Zone.
Technical Indicators Defined: -
Support: A level at which the stock prices tend to find support if they are falling, and a downtrend may take a pause backed by demand or buying interest. Support 1 refers to the nearby support level for the stock and if the price breaches the level, then Support 2 may act as the crucial support level for the stock.
Resistance: A level at which the stock prices tend to find resistance when they are rising, and an uptrend may take a pause due to profit booking or selling interest. Resistance 1 refers to the nearby resistance level for the stock and if the price surpasses the level, then Resistance 2 may act as the crucial resistance level for the stock.
Stop-loss: It is a level to protect against further losses in case of unfavorable movement in the stock prices.
Past performance is not a reliable indicator of future performance.

 NZ
 UK
 US
 AU
 IND

 CA

 Please wait processing your request...