Kalkine's Global Tariff Report offers independent, data-driven analysis of key global sectors impacted by tariff adjustments. It evaluates the potential implications these changes may have for equity valuations within those industries. The report prioritizes trade-sensitive sectors, which typically face increased investor scrutiny during periods of tariff uncertainty, while also identifying defensive and countercyclical segments that demonstrate resilience or potential for outperformance amidst global trade disruptions.
As illustrated in the table below, several key sectors in different countries are directly impacted by the recent tariff announcement from President Trump.


Key Developments
United States / Global Tariff Framework
- Following the 20 February 2026 Supreme Court ruling, the U.S. administration has transitioned to a temporary ~10% broad-based tariff framework for ~150 days, replacing invalidated country-specific reciprocal tariffs.
- The policy shift is being supplemented by new tariff investigations under alternative legal provisions, indicating a move toward a more structured but still evolving regime.
- Legal challenges from multiple U.S. states have introduced incremental uncertainty, suggesting the framework remains interim rather than finalised.
- Overall, global tariff escalation risk has moderated, but policy direction remains fluid with episodic volatility tied to legal and political developments.
Canada
- The ~35% U.S. tariff on non-USMCA-compliant Canadian exports remains in effect, continuing to impact goods failing rules-of-origin thresholds.
- USMCA-aligned trade flows remain insulated, preserving stability across autos, energy, and integrated supply chains.
- Canada’s retaliatory tariff framework remains partially in place, with selective rollbacks already implemented but core measures (metals, autos) retained.
- Political rhetoric has intensified, including threats of materially higher tariffs linked to Canada - China trade alignment, adding headline risk without concrete policy action to date.
India
- U.S. tariffs on key Indian export segments remain unchanged, sustaining pressure on metals, select industrials, and manufactured goods.
- Bilateral trade negotiations have slowed, with the previously anticipated near-term deal timeline now deferred amid new U.S. trade probes.
- India-EU free trade agreement discussions have advanced meaningfully, with a potential conclusion nearing and expected to improve market access.
- India continues to diversify trade exposure, increasing focus on Europe, the Middle East, and Asia-Pacific to mitigate U.S.-centric risks.
China
- The U.S.–China tariff truce framework remains in place, maintaining reduced tariffs and temporary easing of non-tariff barriers (e.g., rare earth controls).
- Despite the truce, cumulative U.S. tariffs on Chinese exports remain elevated (~25–30% effective range), limiting meaningful relief.
- Recent bilateral engagements have stabilised near-term expectations but have not delivered structural rollback of existing tariffs.
- Additional U.S. trade investigations and delayed decisions on strategic sectors (e.g., semiconductors) keep medium-term policy risk intact.
European Union
- The U.S.–EU tariff arrangement continues to cap most EU-origin exports at ~15% effective tariff levels under a negotiated structure.
- The European Commission has extended the suspension of retaliatory tariffs, reinforcing a de-escalatory stance.
- Legislative and procedural steps to formalise elements of the agreement are ongoing, with partial implementation risk remaining.
- Sector-specific negotiations (steel, aluminium, semiconductors) are unresolved, sustaining targeted tariff exposure despite broader stability.
Summary
- The global trade environment has shifted from escalation to managed stability following the U.S. court ruling, but not to full normalisation.
- Broad-based tariff risks have eased, while sector-specific measures, legal uncertainty, and political signalling continue to drive intermittent volatility.
- Trade diversification strategies (notably India, EU) and rule-based frameworks are increasingly central in shaping medium-term global trade flows.

In January 2026, Canada’s trade balance weakened as exports declined while imports remained relatively stable. Services trade moved from a CAD ~0.44 bn surplus in December to a CAD ~0.13 bn deficit, with exports falling 1.1% to ~CAD 19.78 bn and imports rising 1.8% to ~CAD 19.90 bn. The decline was mainly due to weaker commercial and transportation services, partly offset by better travel exports. On the goods side, exports dropped 4.7% to ~CAD 62.48 bn, while imports fell 1.1% to ~CAD 66.12 bn, widening the goods deficit to ~CAD 3.64 bn. Overall, the combined trade deficit expanded to about CAD ~3.78 bn.
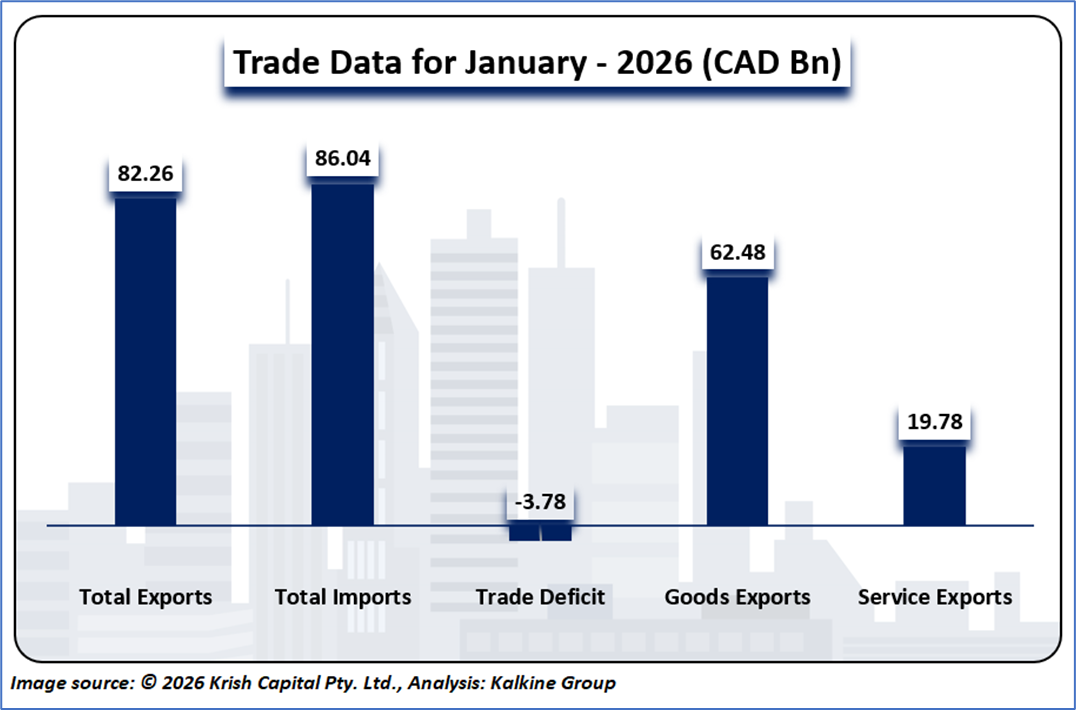


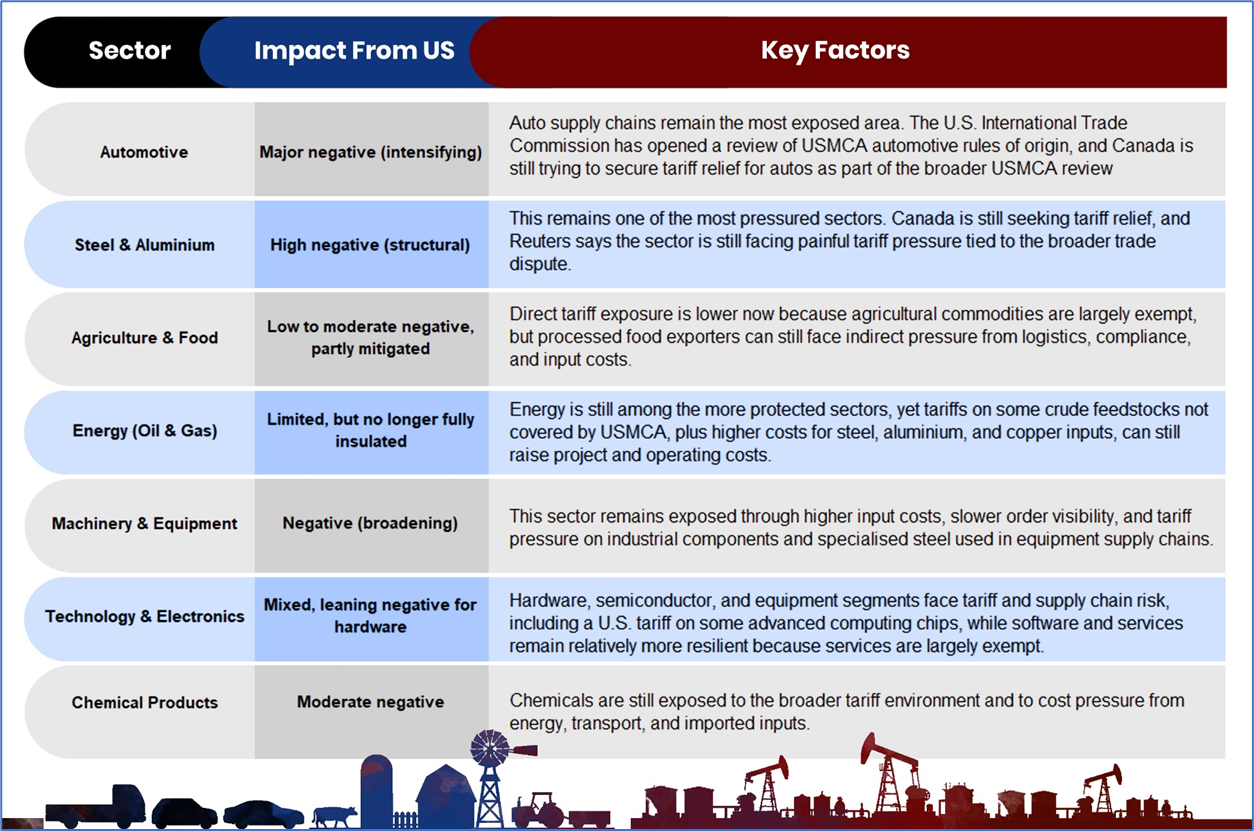
Image source: © 2026 Krish Capital Pty. Ltd., Analysis: Kalkine Group

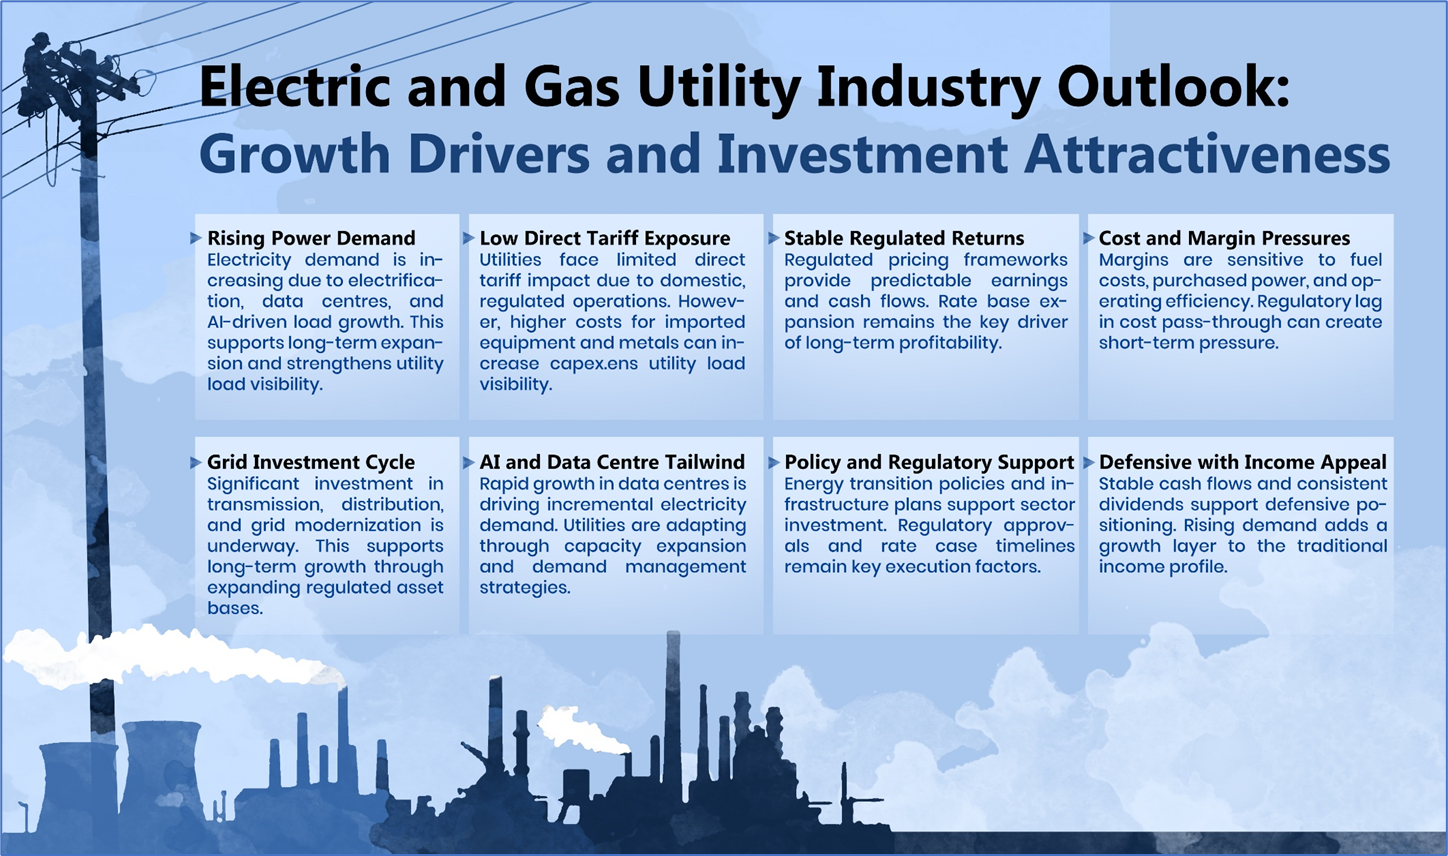
Image source: © 2026 Krish Capital Pty. Ltd., Analysis: Kalkine Group
Amid elevated Market Volatility and Tariff pressures, Fortis Inc. (TSX: FTS) stands out as our defensive pick within the Utility sector, supported by rigorous fundamental and technical research
Section1: Company Overview and Fundamental Insights:

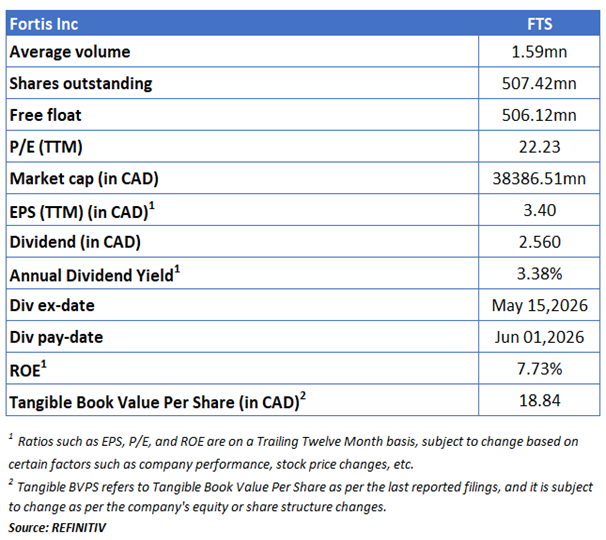
Fortis Incorporation (TSX: FTS) owns and operates 10 utility transmission and distribution assets in Canada and the United States, serving more than 3.4 million electricity and gas customers. The company has smaller stakes in electricity generation and several Caribbean utilities. ITC operates electric transmission in seven U.S. states, with more than 16,000 miles of high-voltage transmission lines in operation serving a peak load in excess of 23 gigawatts.
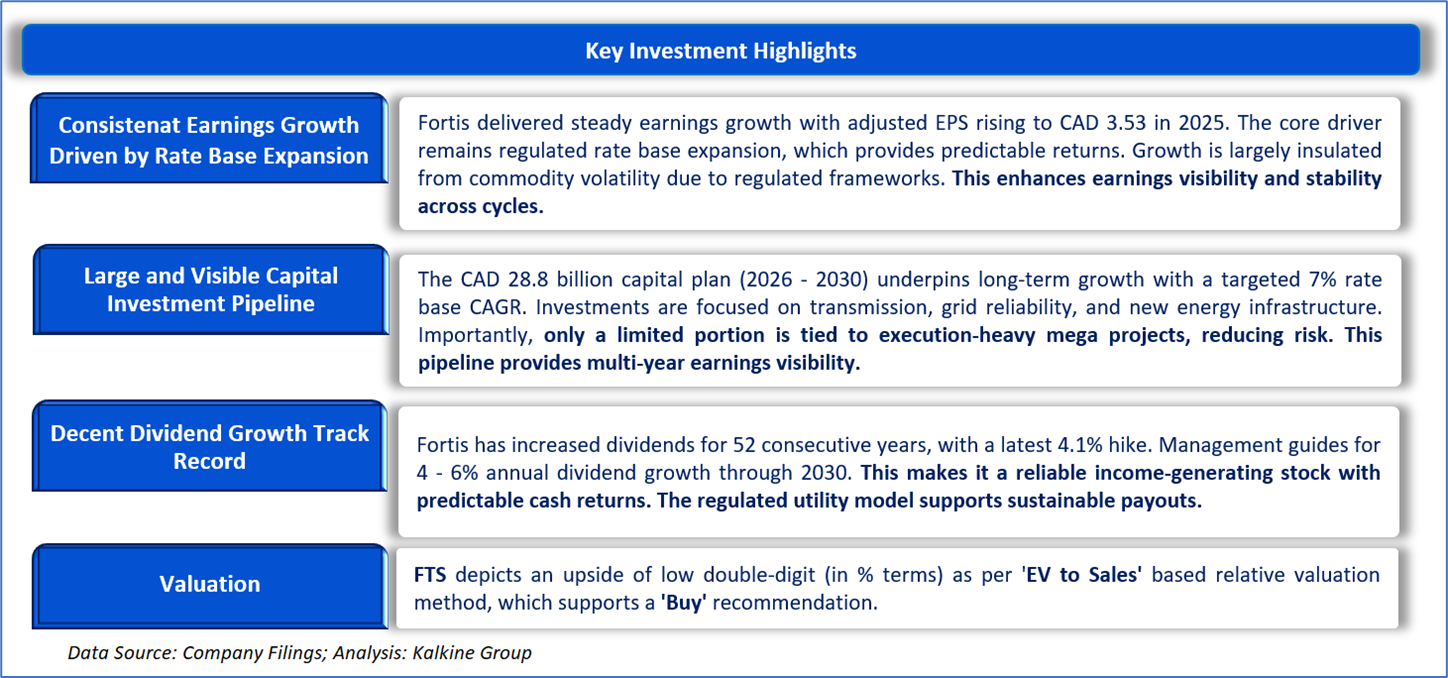
Kalkine’s Global Tariff Report covers the Investment Highlights, Key Financial Metrics, Risks, Technical Analysis along with the Valuation, Target Price, and Recommendation on the stock.


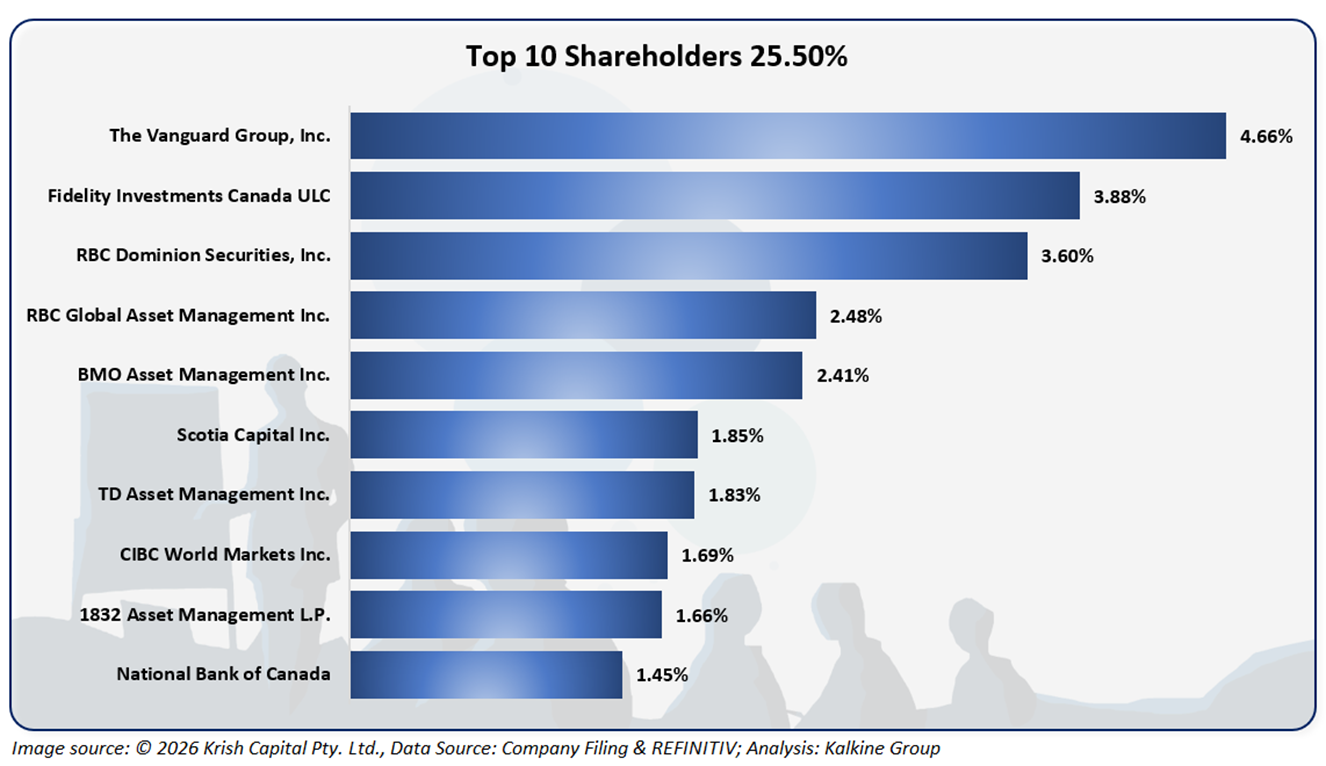
The top 10 shareholders together form ~25.50% of the total shareholding. The Vanguard Group, Inc. and Fidelity Investments Canada ULC hold a maximum stake in the company at ~4.66% and ~3.88%, respectively.

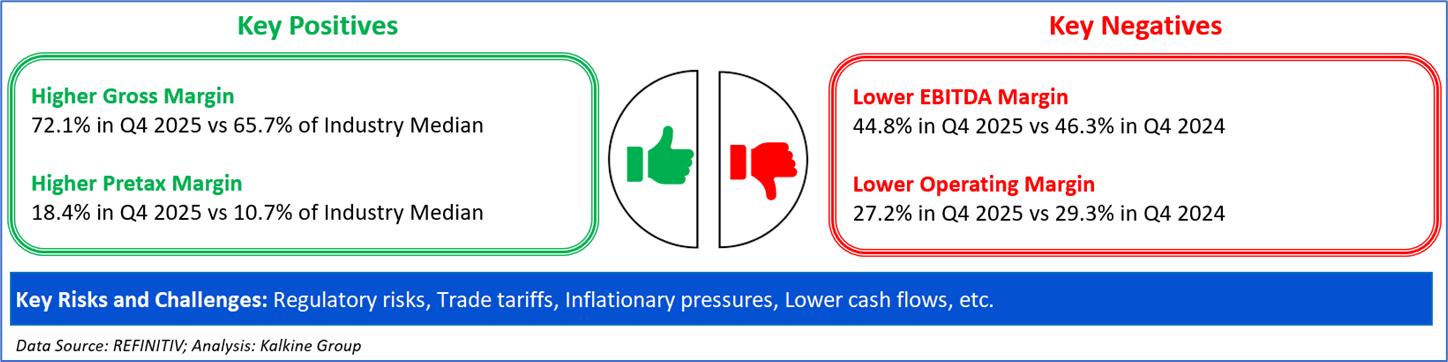
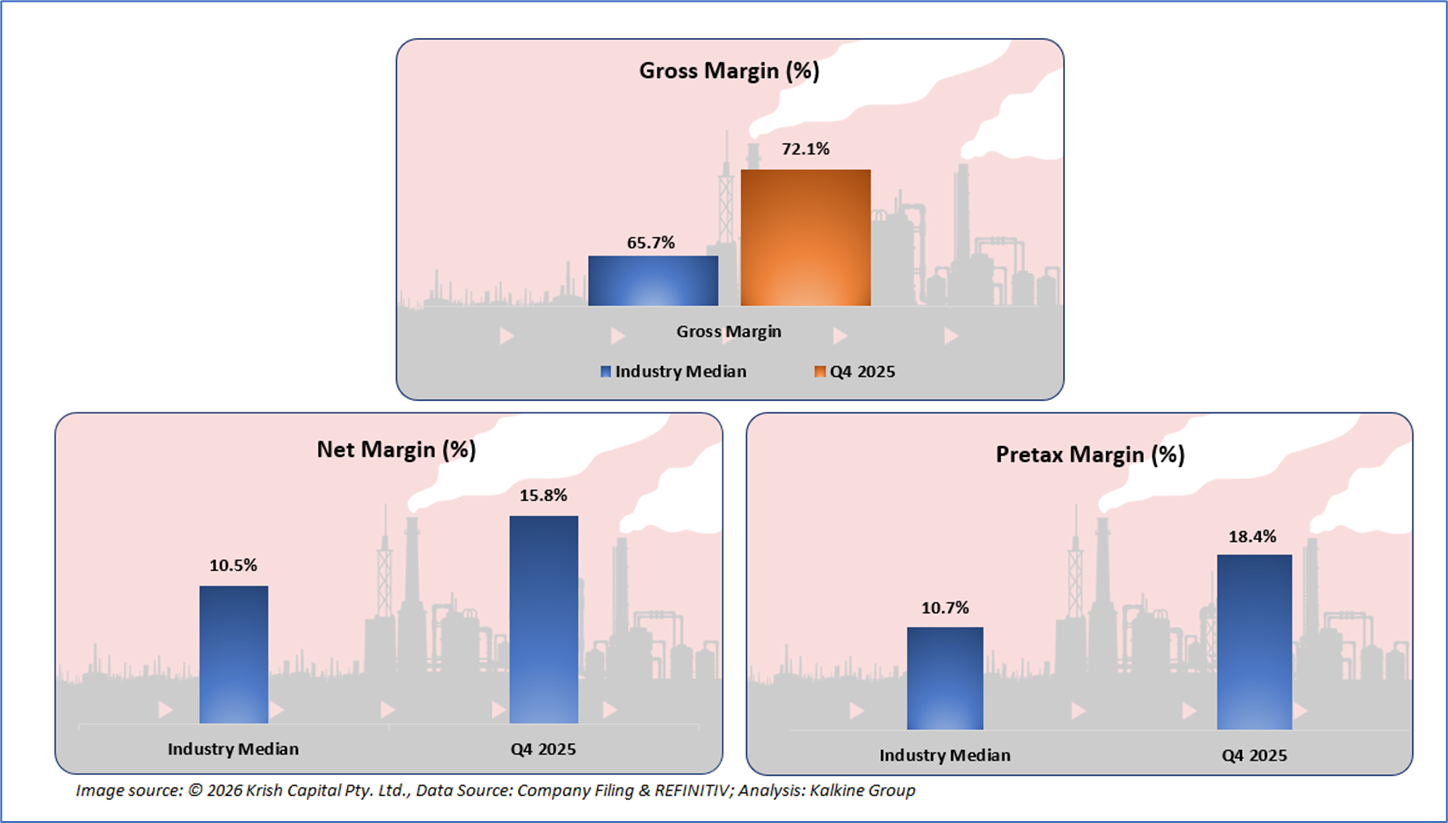
The company reported rising financials in Q4 2025, where it clocked healthy growth under its Gross Margin, which is a key positive. Furthermore, it witnessed elevated Net Margin and Pretax Margin, displaying the company’s operational efficiency and optimum margins.
Section 2: Business Updates and Financial Highlights

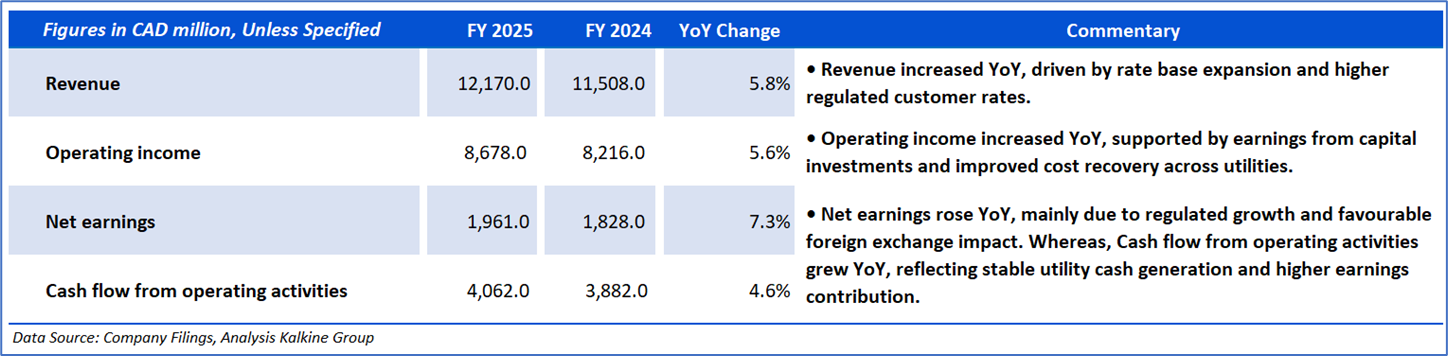
The picture below gives an overview of the company’s recent activities, such as an announcement regarding Strategic Focus on Energy Transition and Grid Modernization.


Section 3: Key Risks and Company Outlook
Section 4: Stock Recommendation Summary


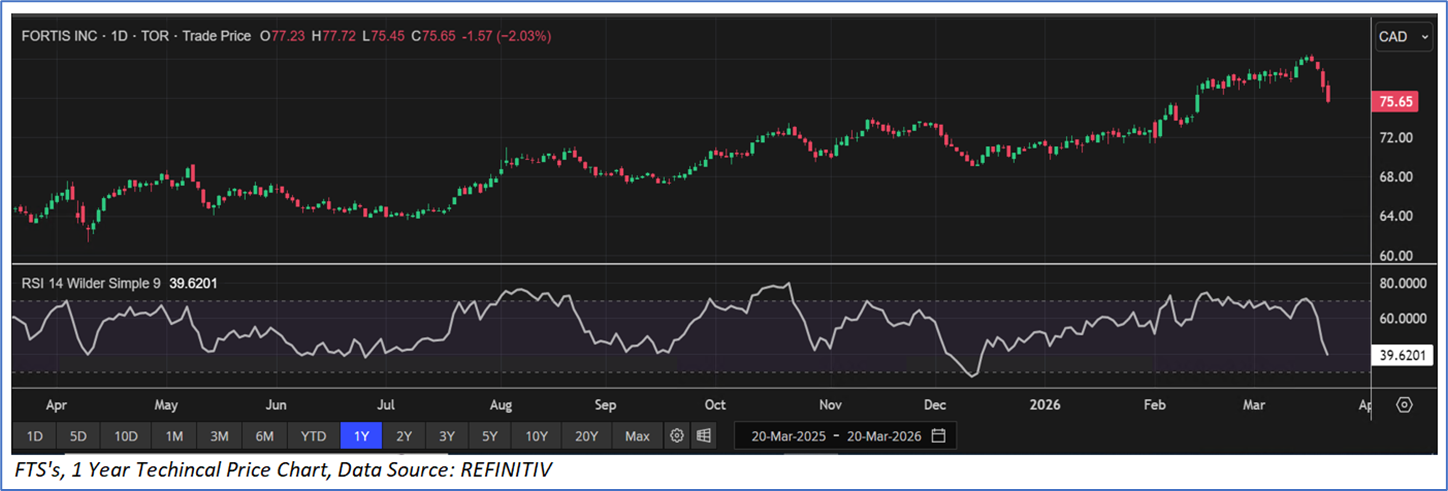
The stock has witnessed a downside of ~5.34% and an upside of ~7.91% over the last 1 week and 3 months respectively. Moreover, it is trading above the average 52-week high price of CAD 80.44 and 52-week low price of CAD 61.32, providing an opportunity to ride the trend.
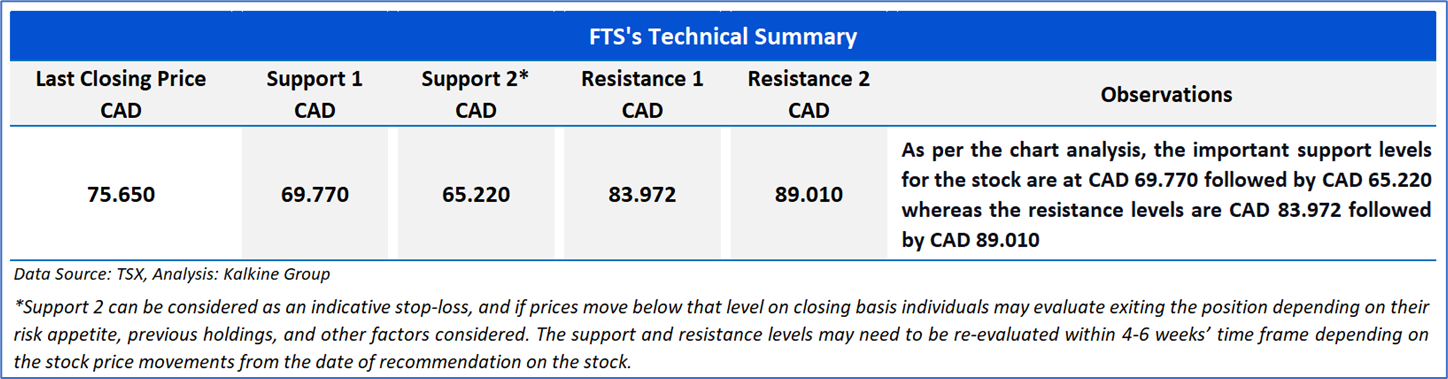

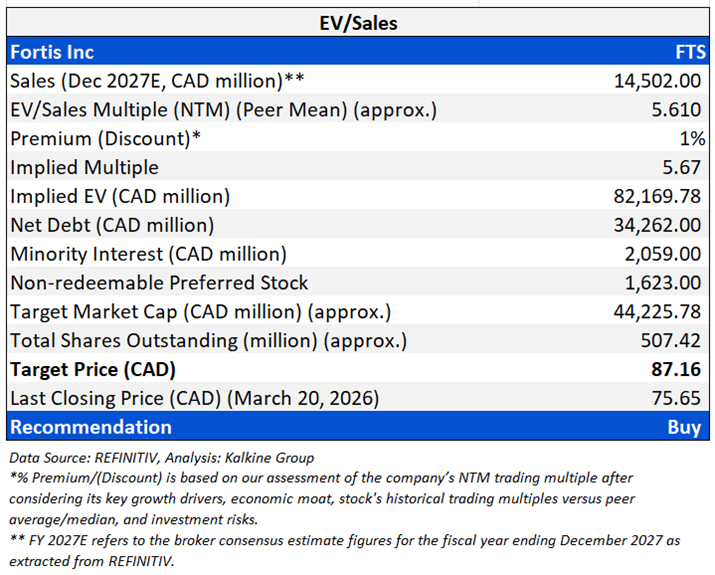
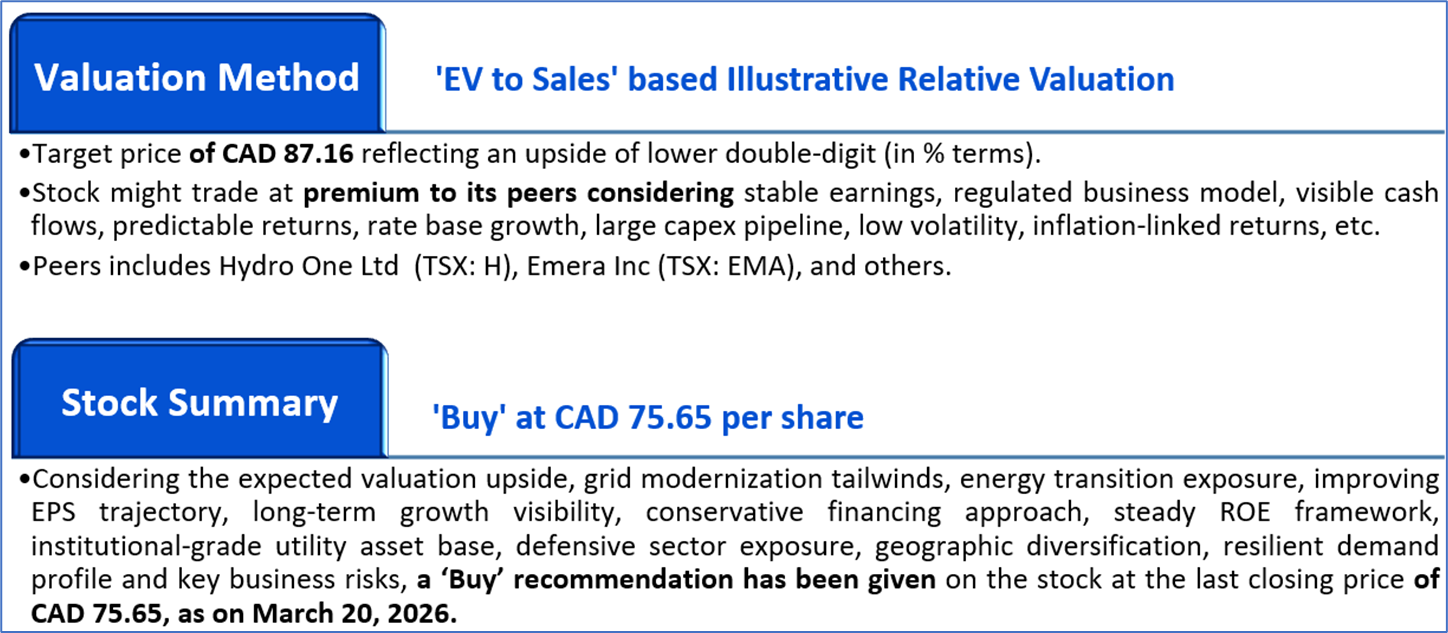
Valuation Methodology: EV to Sales Based Relative Valuation (Illustrative):
Markets are trading in a highly volatile zone currently due to certain macroeconomic issues and geopolitical tensions prevailing. Therefore, it is prudent to follow a cautious approach while investing.
Note 1: Past performance is not a reliable indicator of future performance.
Note 2: The reference date for all price data, currency, technical indicators, support, and resistance levels is March 20, 2026. The reference data in this report has been partly sourced from REFINITIV.
Note 3: Investment decisions should be made depending on an individual's appetite for upside potential, risks, holding duration, and any previous holdings. An 'Exit' from the stock can be considered if the Target Price mentioned as per the Valuation and or the technical levels provided has been achieved and is subject to the factors discussed above.
Note 4: Dividend Yield may vary as per the stock price movement.
Note 5: Kalkine reports are prepared based on the stock prices captured either from REFINITIV or Trading View. Typically, REFINITIV or Trading View may reflect stock prices with a delay which could be a lag of 25-30 minutes. There can be no assurance that future results or events will be consistent with the information provided in the report. The information is subject to change without any prior notice.
Technical Indicators Defined: -
Support: A level at which the stock prices tend to find support if they are falling, and a downtrend may take a pause backed by demand or buying interest. Support 1 refers to the nearby support level for the stock and if the price breaches the level, then Support 2 may act as the crucial support level for the stock.
Resistance: A level at which the stock prices tend to find resistance when they are rising, and an uptrend may take a pause due to profit booking or selling interest. Resistance 1 refers to the nearby resistance level for the stock and if the price surpasses the level, then Resistance 2 may act as the crucial resistance level for the stock.
Stop-loss: It is a level to protect further losses in case of unfavourable movement in the stock prices.
Past performance is not a reliable indicator of future performance.

 NZ
 UK
 US
 AU
 IND

 CA

 Please wait processing your request...