Section 1: Company Overview and Fundamentals
1.1 Company Overview:
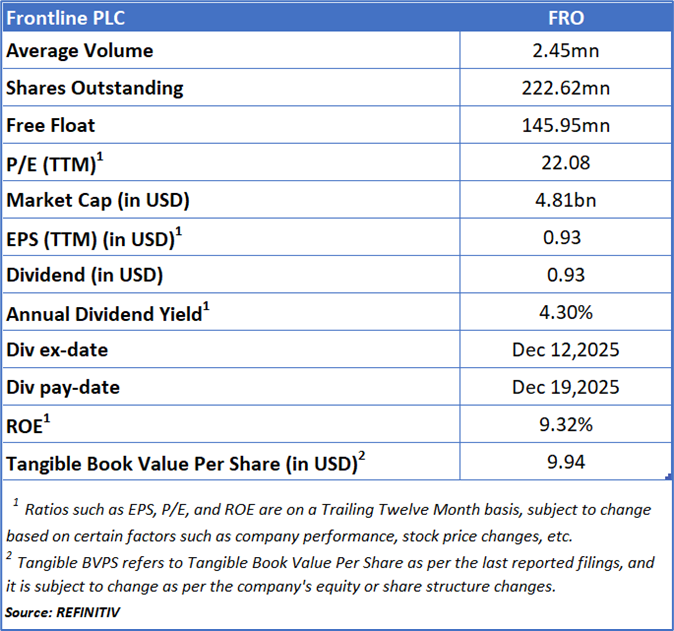
Frontline PLC (NYSE: FRO) headquartered in Cyprus, operates within the global marine transportation industry with a primary focus on the seaborne shipment of crude oil and refined petroleum products. The Company manages a diversified fleet comprising VLCC, Suezmax and LR2/Aframax tankers, which are deployed internationally to support oil and product freight operations.
Kalkine’s Dividend Income Report covers the Company Overview, Key positives & negatives, Investment summary, Key investment metrics, Top 10 shareholding, Business updates and insights into company recent financial results, Key Risks & Outlook, Price performance and technical summary, Target Price, and Recommendation on the stock.
Price Performance:
- The stock shows a strong uptrend from mid-April to early November, with the price generally trading above both the 20-day and 50-day moving averages. Trading volume during the rebound appears supportive, indicating renewed buying interest.
- Momentum weakened in late November as the price first broke below the 20-day moving average and then the 50-day moving average, signalling a short-term trend reversal. A corrective pullback followed into late December, after which the price began to stabilise around the USD 21–USD 22 support range.
- The stock has recently rebounded and moved back above the 20-day moving average, indicating improving near-term sentiment. The 50-day moving average, currently above the share price, may act as near-term resistance. A sustained break above the 50-day moving average could confirm a resumption of the broader uptrend, while failure to clear it may result in continued consolidation
- The RSI around 63 suggests bullish momentum is building but the stock is not yet overbought.
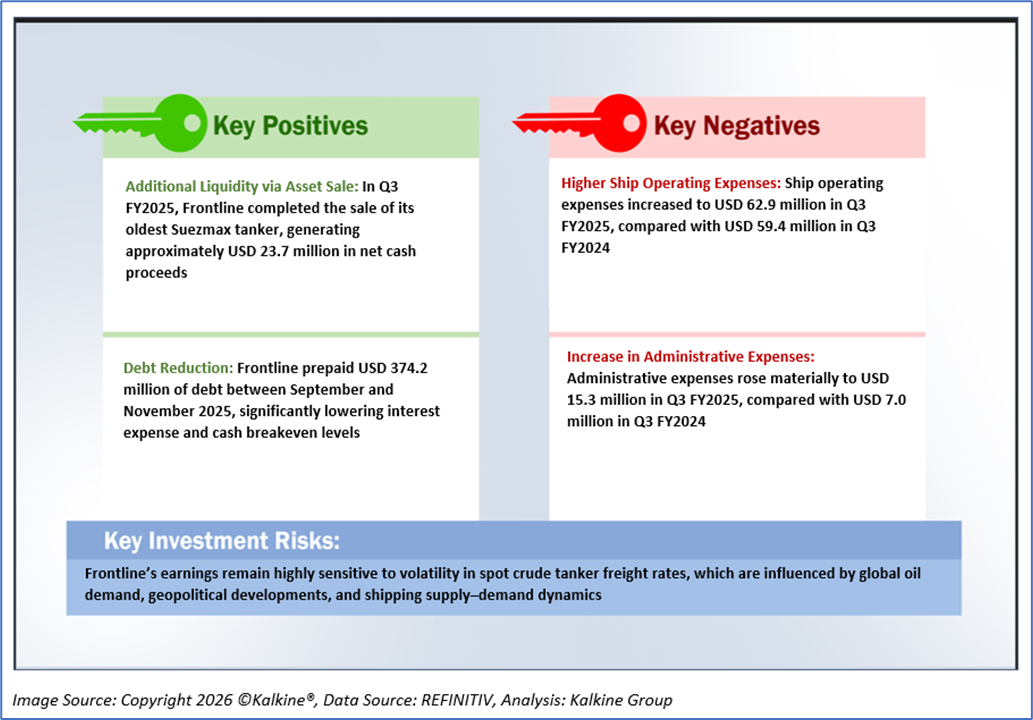
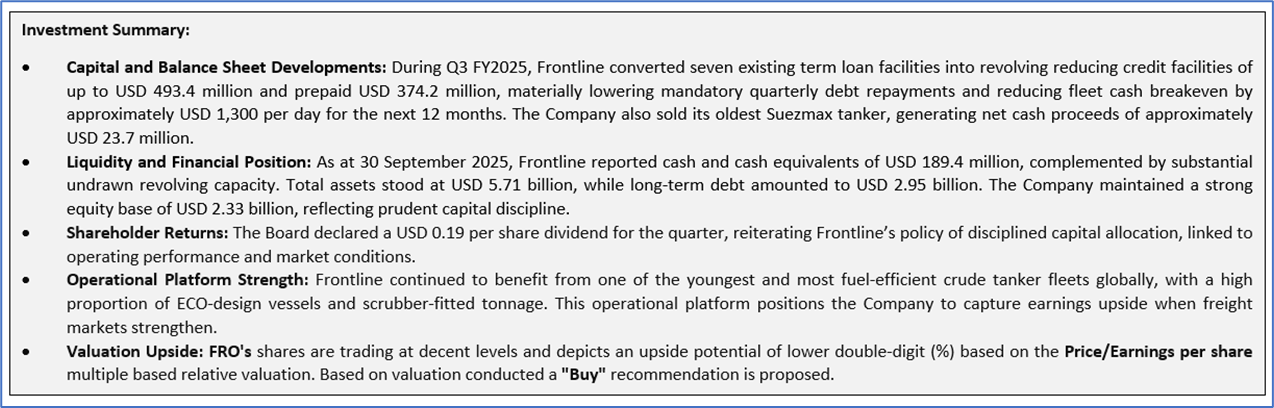
1.2 The Key Positives, Negatives, and Investment summary
1.3 Top 10 shareholders:
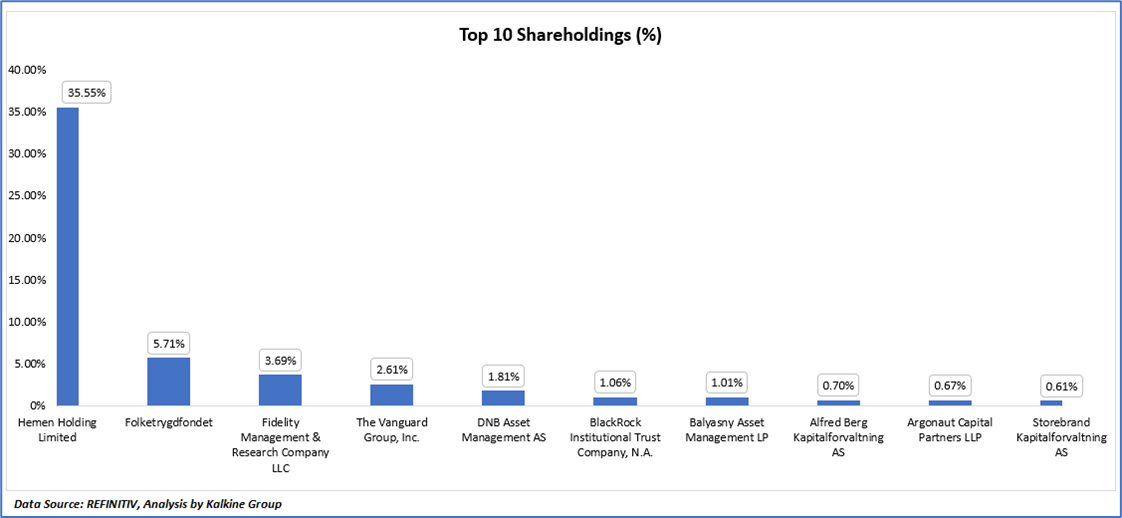
The top 10 shareholders together form ~ 53.43% of the total shareholding, signifying concentrated shareholding. Hemen Holding Limited and Folketrygdfondet are the biggest shareholders, holding the maximum stake in the company at ~35.55% and ~5.71%, respectively.
1.4 Dividend payments with impressive dividend yield:
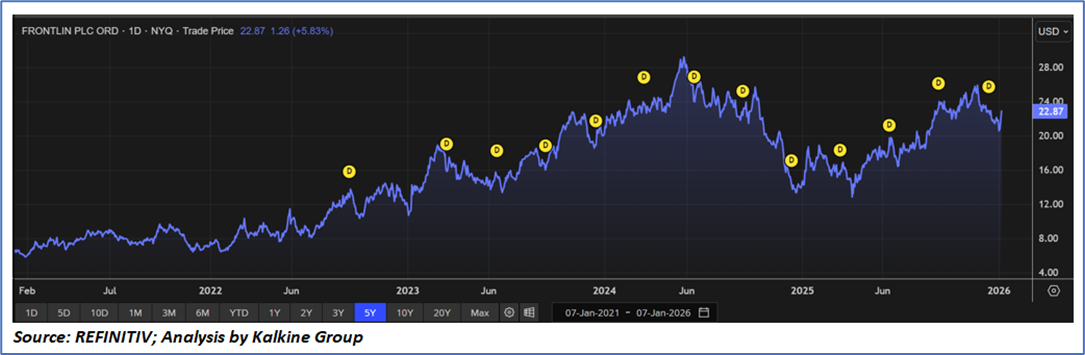
Frontline plc follows an earnings-linked dividend policy in which distributions rise and fall with tanker market conditions rather than being fixed, resulting in a clear cyclical pattern over time. Dividends increased significantly through 2023 and early-2024 during a period of strong spot charter rates and profitability, before moderating in mid-2024 to early-2025 as freight markets softened, although the Company continued to make quarterly payments throughout. The dividend yield has remained elevated but volatile, generally fluctuating between high single-digit and mid-teen percentages, with spikes in yield typically occurring when the share price weakens rather than as a result of dividend distress. More recently, the yield has normalised to around 8–13% on forward estimates, still well above broader market averages. Overall, the Company demonstrates a disciplined and transparent capital-return framework that prioritises cash distribution during profitable periods while retaining balance-sheet strength, meaning investors should expect attractive but variable income aligned to the shipping cycle.
1.5 Key Metrics
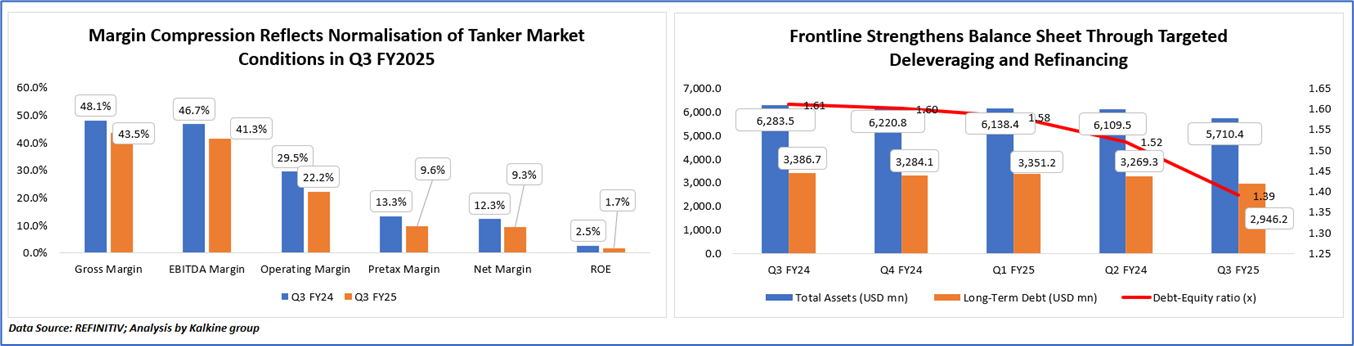
The margin compression shown in the chart primarily reflects the shift from exceptionally strong tanker market conditions in Q3 FY2024 to more normalised but still profitable trading conditions in Q3 FY2025. Lower average spot charter rates reduced voyage-adjusted revenues and vessel earnings, which in turn narrowed gross and EBITDA margins as fixed operating costs were spread over weaker daily returns. Operating and pretax margins declined more sharply due to higher operating and administrative expenses, creating negative operating leverage as revenue softened. Net margins were also affected by ongoing finance costs, and Return on Equity fell as earnings declined relative to a broadly stable equity base. Overall, the downward trend across the margin metrics reflects the cyclical cooling of tanker freight markets rather than structural weakness, with Frontline still maintaining profitability thanks to its efficient fleet and disciplined cost and capital management.
On the balance sheet front, while Frontline’s total assets have declined modestly from Q3 FY2024 to Q3 FY2025, the more material change has been the significant reduction in long-term debt and gearing levels, reflected in the fall in the debt-equity ratio from around 1.6x to 1.39x over the same period. This trend is directly linked to the Company’s strategy of strengthening its balance sheet through active deleveraging and refinancing activity, including the conversion of term loans into revolving reducing credit facilities and the prepayment of approximately USD 374 million of debt during late 2025. These actions reduced mandatory principal repayments and cash breakeven levels, resulting in a structurally lower leverage profile. The slight decline in total assets also reflects vessel disposals and fair-value movements, consistent with Frontline’s ongoing fleet optimisation strategy. Overall, the chart illustrates a clear shift toward a more conservative capital structure, with lower leverage, improved liquidity flexibility, and enhanced financial resilience despite a softer earnings backdrop in FY2025 compared with the exceptionally strong tanker market conditions of the prior year.
Section 2: Business Updates and Financial Highlights
2.1 Recent Updates:
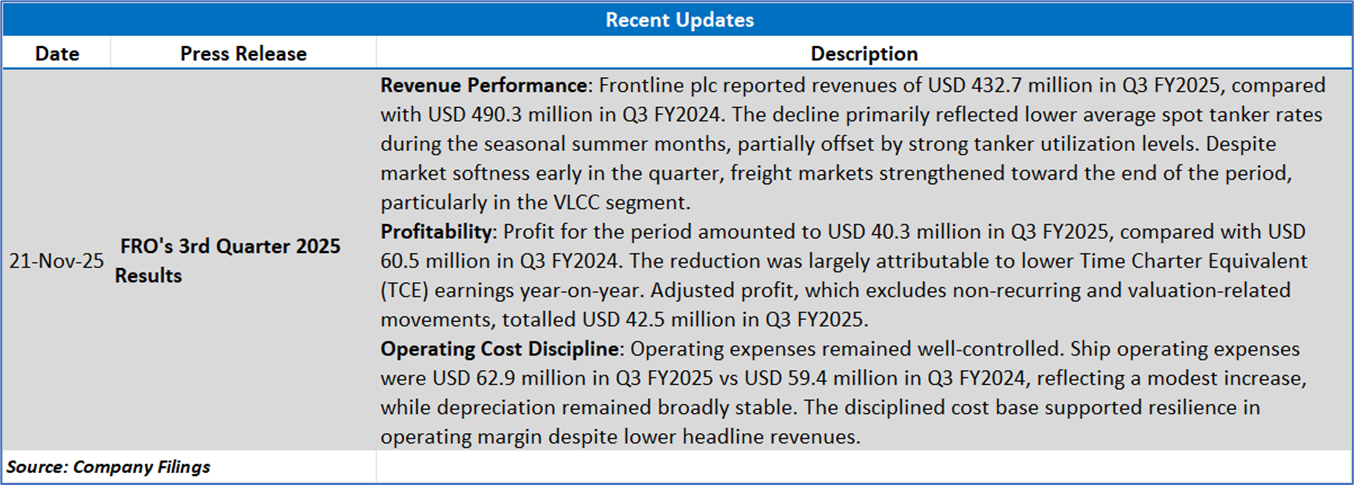
The below picture gives an overview of the recent updates:
2.2 Insights of 9M FY25:
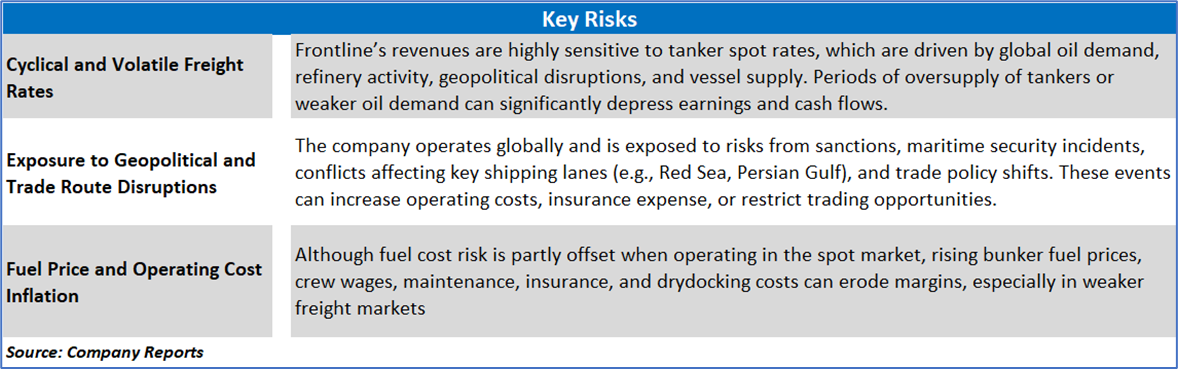
Section 3: Key Risks and Outlook:
Section 4: Stock Recommendation Summary:
4.1 Technical Summary:
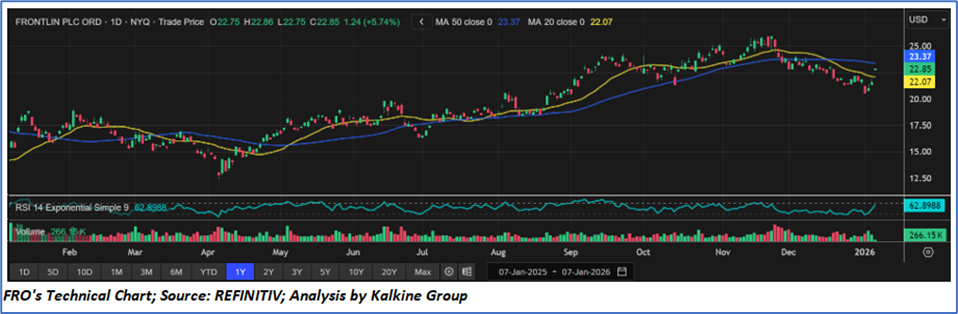
Price Performance:
- The stock shows a strong uptrend from mid-April to early November, with the price generally trading above both the 20-day and 50-day moving averages. Trading volume during the rebound appears supportive, indicating renewed buying interest.
- Momentum weakened in late November as the price first broke below the 20-day moving average and then the 50-day moving average, signalling a short-term trend reversal. A corrective pullback followed into late December, after which the price began to stabilise around the USD 21–USD 22 support range.
- The stock has recently rebounded and moved back above the 20-day moving average, indicating improving near-term sentiment. The 50-day moving average, currently above the share price, may act as near-term resistance. A sustained break above the 50-day moving average could confirm a resumption of the broader uptrend, while failure to clear it may result in continued consolidation
- The RSI around 63 suggests bullish momentum is building but the stock is not yet overbought.
4.2 Fundamental Valuation
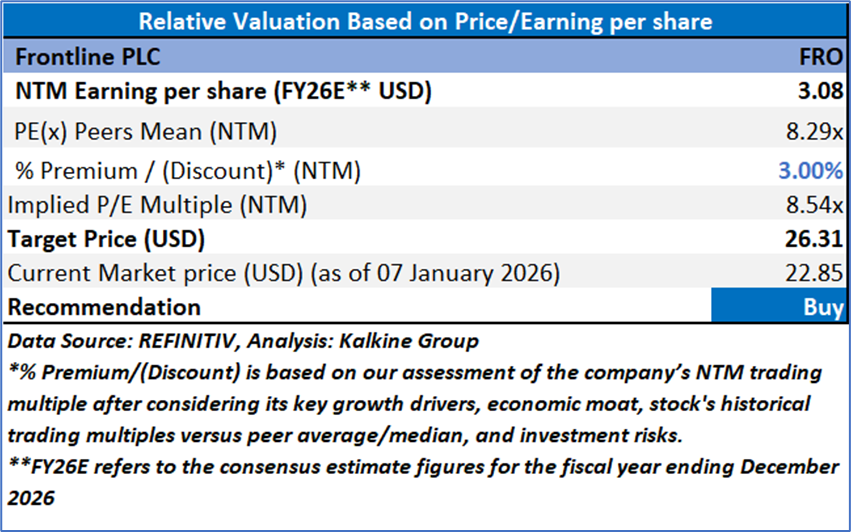
Valuation Methodology: Price/Earnings Multiple Based Relative Valuation
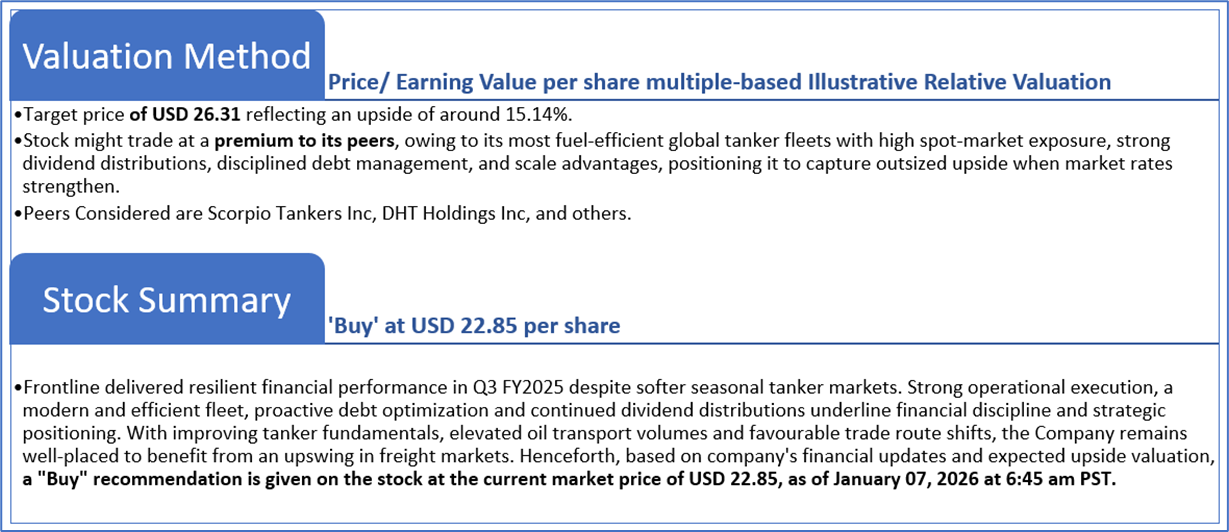
Markets are trading in a highly volatile zone currently due to certain macroeconomic issues and geopolitical tensions prevailing. Therefore, it is prudent to follow a cautious approach while investing.
Note 1: Past performance is not a reliable indicator of future performance.
Note 2: The reference date for all price data, currency, technical indicators, support, and resistance levels is January 07, 2026. The reference data in this report has been partly sourced from REFINITIV.
Note 3: Investment decisions should be made depending on an individual's appetite for upside potential, risks, holding duration, and any previous holdings. An 'Exit' from the stock can be considered if the Target Price mentioned as per the Valuation and or the technical levels provided has been achieved and is subject to the factors discussed above.
Note 4: The report publishing date is as per the Pacific Time Zone.
Technical Indicators Defined: -
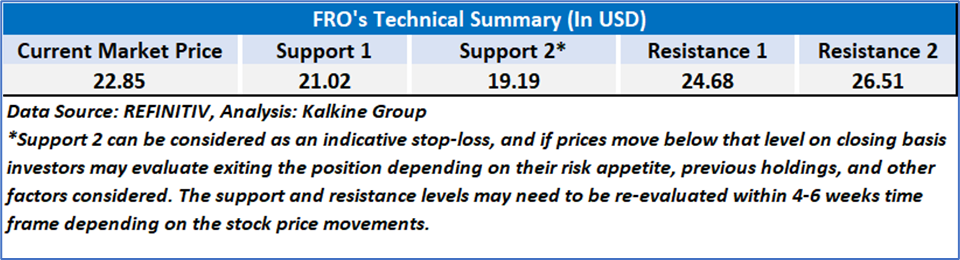
Support: A level at which the stock prices tend to find support if they are falling, and a downtrend may take a pause backed by demand or buying interest. Support 1 refers to the nearby support level for the stock and if the price breaches the level, then Support 2 may act as the crucial support level for the stock.
Resistance: A level at which the stock prices tend to find resistance when they are rising, and an uptrend may take a pause due to profit booking or selling interest. Resistance 1 refers to the nearby resistance level for the stock and if the price surpasses the level, then Resistance 2 may act as the crucial resistance level for the stock.
Stop-loss: It is a level to protect against further losses in case of unfavorable movement in the stock prices.
Past performance is not a reliable indicator of future performance.

 NZ
 UK
 US
 AU
 IND

 CA

 Please wait processing your request...