Section 1: Company Overview and Fundamentals
1.1 Company Overview:
FRONTLINE PLC (NYSE: FRO) is a Cyprus-based company primarily operating in the transportation sector. The Company's main focus is on seaborne transportation of crude oil and refined products. The Company owns and operates a fleet consisting of multiple VLCC, Suezmax and LR2 / Aframax tankers intended for freight of oil and cargo. The Company operates worldwide.
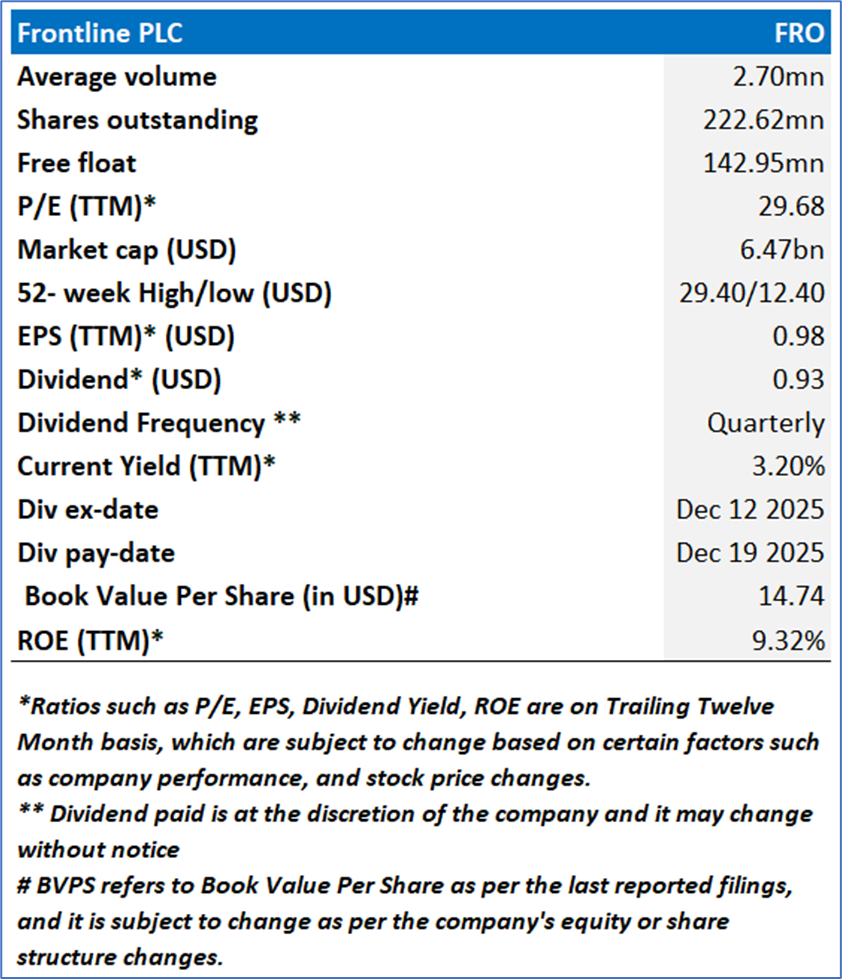
Kalkine’s Dividend Income Report covers the Company Overview, Key positives & negatives, Investment summary, Key investment metrics, Top 10 shareholding, Business updates and insights into company recent financial results, Key Risks & Outlook, Price performance and technical summary, Target Price, and Recommendation on the stock.
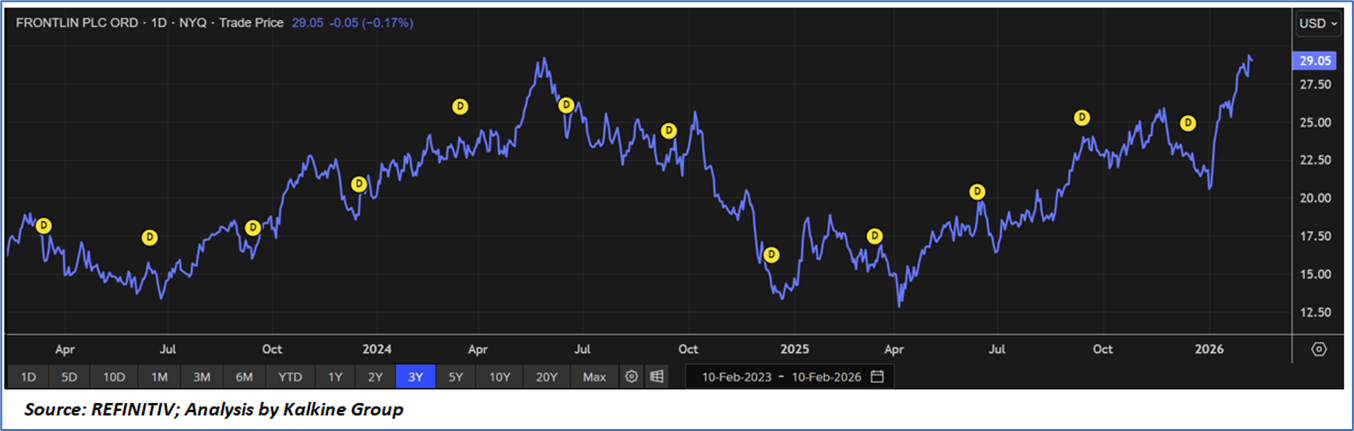
Price Performance:
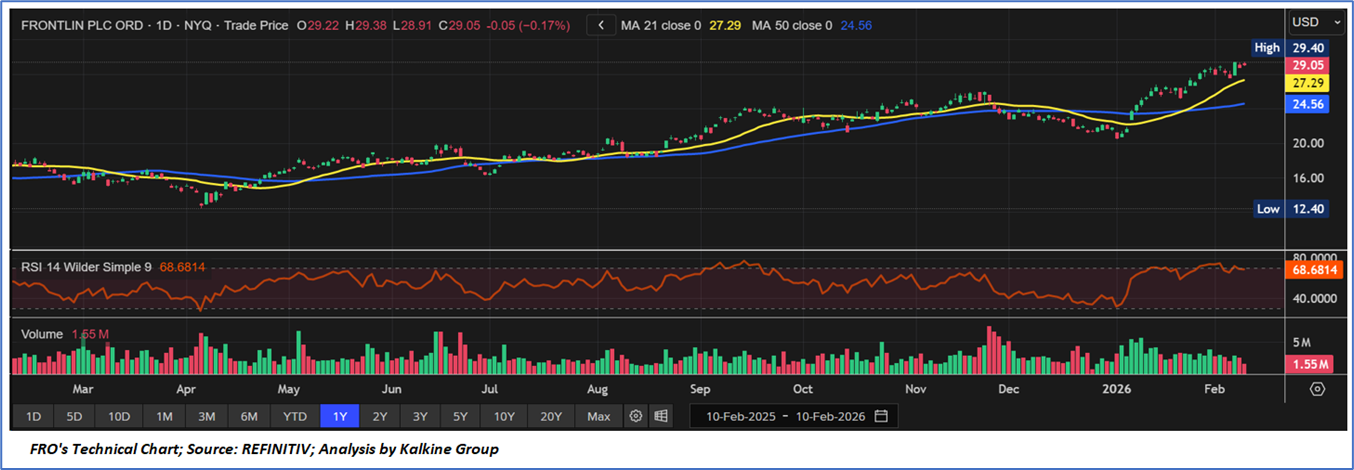
- Trend Structure and Price Action: FRO maintains a firm medium-term uptrend, recently advancing toward the USD 29–30 zone near its yearly highs. The stock remains above both the 21-day and 50-day moving averages, confirming higher lows and sustained buying momentum, though proximity to resistance may invite short-term consolidation.
- Moving Averages and Support Levels: The 21-day moving average remains above the 50-day average, reinforcing a bullish technical structure. Immediate support is seen near USD 27.30, with stronger backing around USD 24.50; holding above these levels preserves the constructive trend outlook.
- Momentum and Volume Dynamics: RSI near 68 indicates strong momentum, approaching but not yet in overbought territory. Volume participation remains supportive of the recent advance, suggesting underlying demand, although minor pullbacks may occur as momentum normalizes.
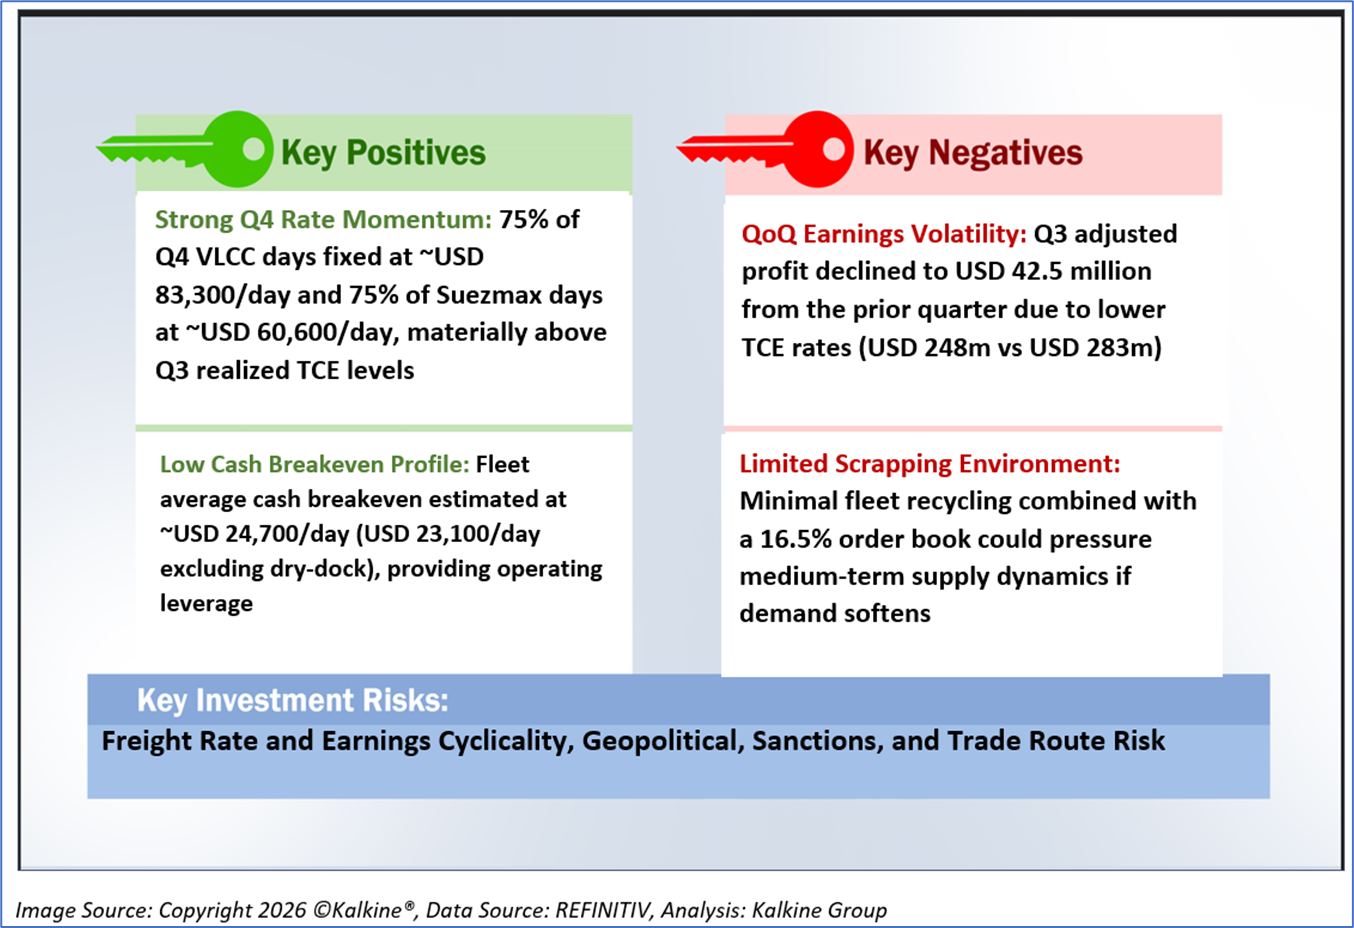
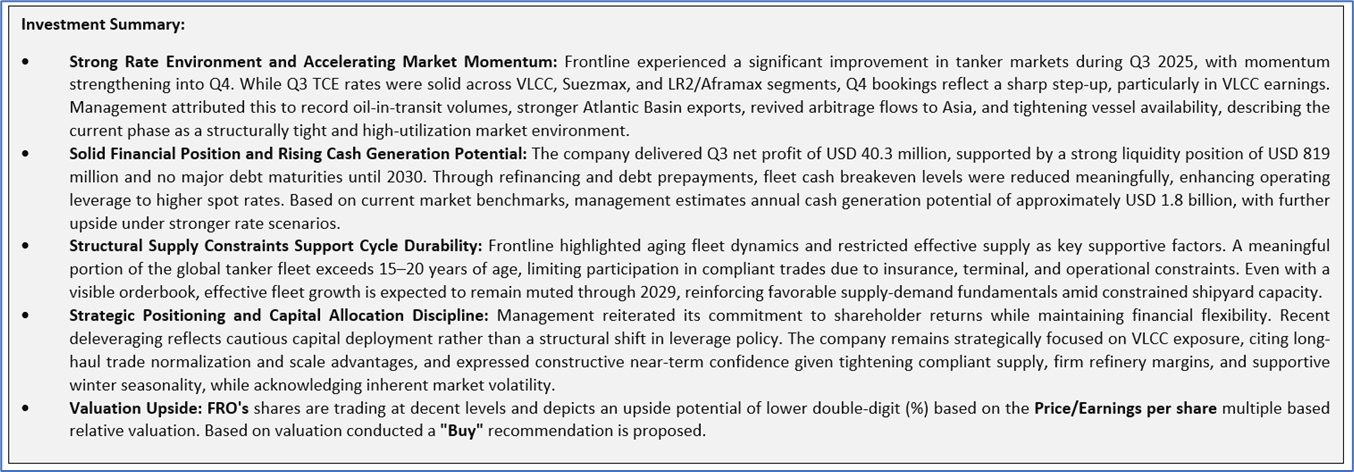
1.2 The Key Positives, Negatives, and Investment summary
1.3 Top 10 shareholders:
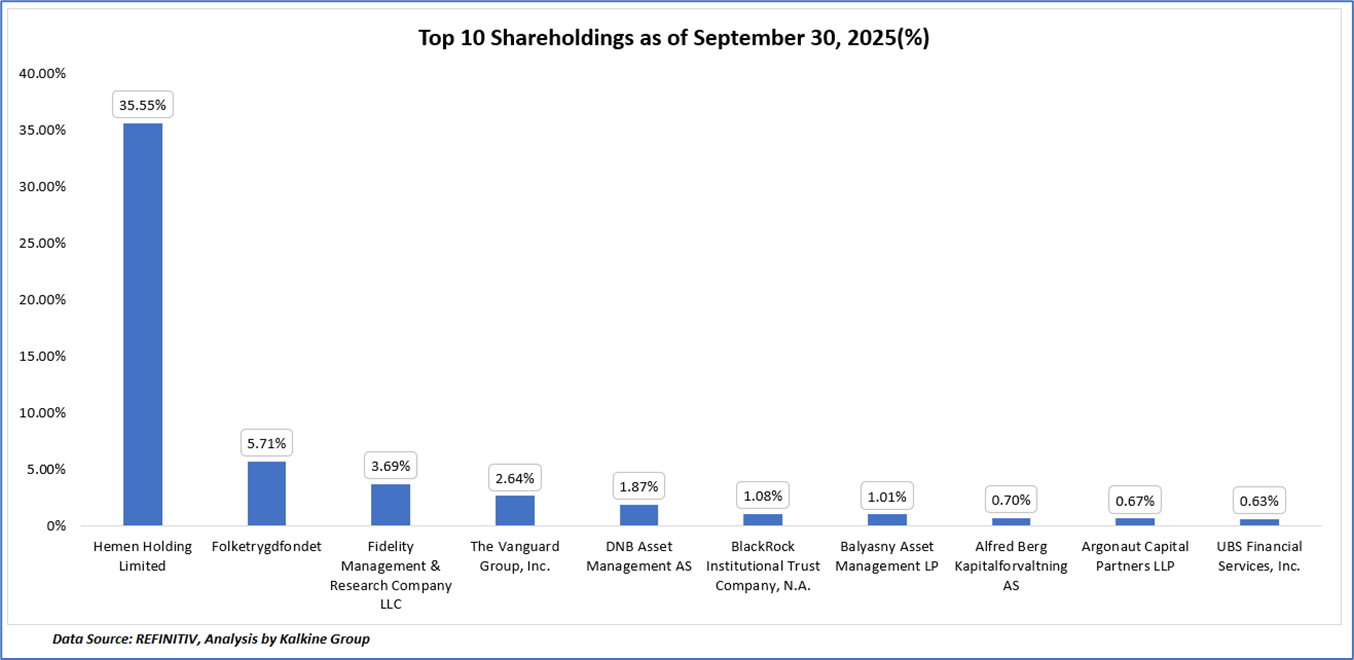
The top 10 shareholders together form ~53.56% of the total shareholding, signifying concentrated shareholding. Hemen Holding Limited and Folketrygdfondet are the biggest shareholders, holding the maximum stake in the company at ~35.55% and ~5.71%, respectively.
1.4 Dividend payments with impressive dividend yield:
Frontline Plc maintains a variable, earnings-linked dividend framework that aligns capital returns with spot tanker market conditions, reinforcing its positioning as a high-beta yield vehicle within the crude tanker segment. For Q3 2025, the Board declared a dividend of USD 0.19 per share, payable around 19 December 2025, implying a quarterly cash outlay of approximately USD 42.3 million based on 222.6 million shares outstanding. Historically, FRO has adopted a policy of distributing a substantial portion of adjusted net income, resulting in materially higher payouts during strong freight environments and moderated distributions during cyclical troughs, underscoring the inherently variable nature of its income profile. With a trailing dividend yield of approximately 3.20%, the current payout level reflects normalization from peak tanker rate conditions rather than structural deterioration in capital return philosophy. Importantly, the company’s robust liquidity position, limited near-term debt maturities, and improving forward rate coverage provide visibility to continued shareholder returns; however, dividend sustainability remains directly contingent on freight rate realizations and cash flow generation given the absence of a fixed minimum payout commitment. Overall, FRO’s dividend track record demonstrates disciplined capital allocation, prioritizing balance sheet resilience while retaining flexibility to scale distributions opportunistically across the tanker cycle.
1.5 Key Metrics
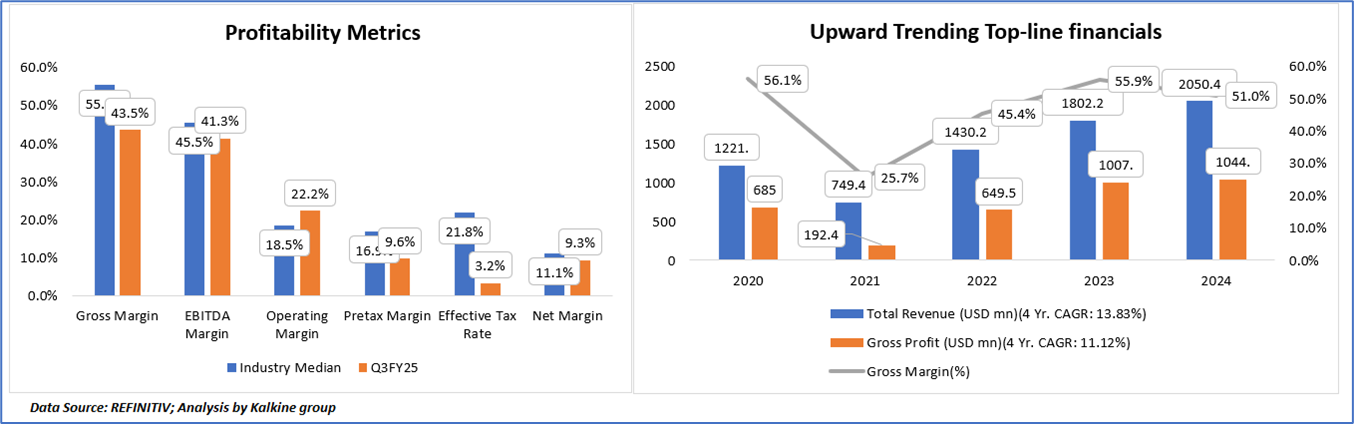
Revenue Growth and Scale Expansion
- Total revenue increased at a 4-year CAGR of 13.83%, rising from USD 1,221.2 million (2020) to USD 2,050.4 million (2024).
- Growth reflects recovery from the pandemic trough and tightening tanker market fundamentals.
- Demonstrates improving scale and stronger earnings resilience across the shipping cycle.
Gross Profit and Margin Recovery
- Gross profit expanded at a 4-year CAGR of 11.12%, reaching USD 1,044.7 million in 2024.
- Gross margin bottomed at 25.7% in 2021 (cyclical low).
- Margins rebounded sharply to 55.9% in 2023, before moderating to 51.0% in 2024.
- Indicates normalization at levels structurally stronger than pre-recovery averages, though still sensitive to freight rate volatility.
Relative Profitability – Q3FY25 vs Industry Median
- Gross Margin: 43.5% (below industry median of 55.4%).
- EBITDA Margin: 41.3% (below industry median of 45.5%).
- Reflects recent normalization in spot freight rates and operating conditions.
Operating Efficiency and Cost Discipline
- Operating Margin: 22.2% (above industry median of 18.5%).
- Highlights effective cost control and operational discipline despite cyclical moderation.
Net Profitability and Tax Position
- Pre-tax Margin: 9.6% (below sector median).
- Net Margin: 9.3% (below sector median).
- Effective Tax Rate: 3.2%, providing a structural earnings cushion.
Overall Assessment
- Top-line and gross margins remain inherently cyclical.
- Operating efficiency and disciplined capital structure strengthen margin resilience.
- Competitive positioning remains intact within the crude tanker segment despite freight rate normalization
Section 2: Business Updates and Financial Highlights
2.1 Recent Updates:
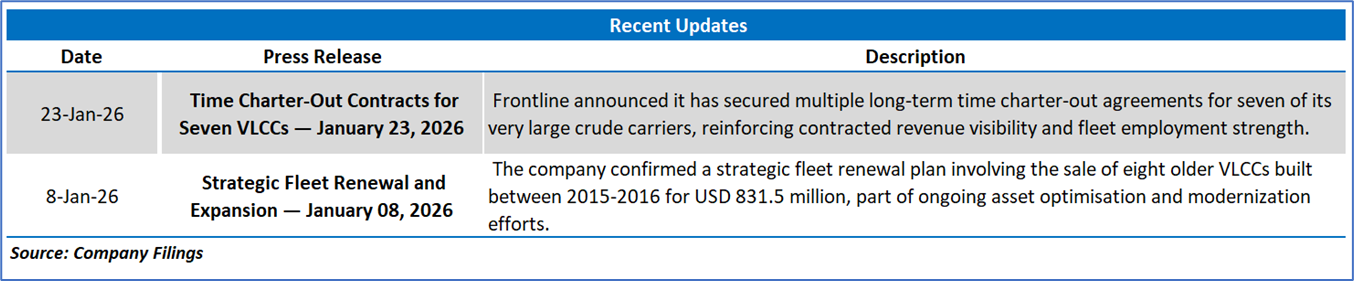
The below picture gives an overview of the recent updates:
2.2 Insights of Q3FY25:
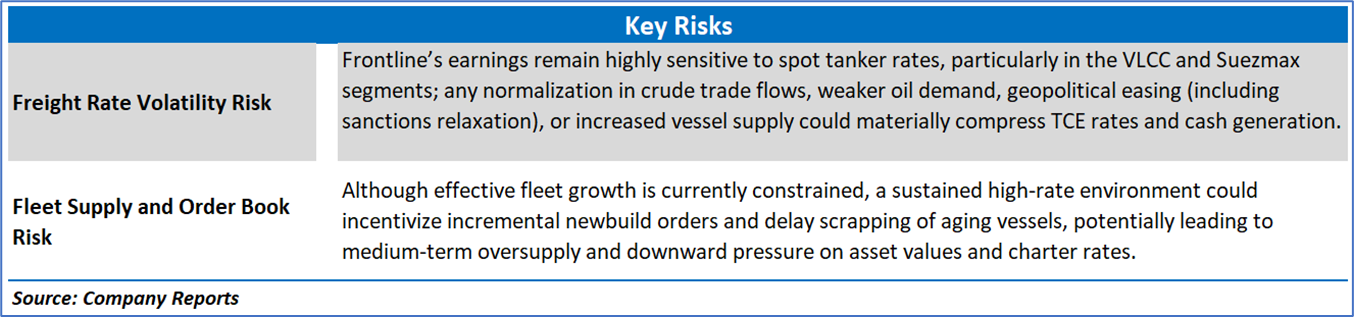
Section 3: Key Risks and Outlook:
Section 4: Stock Recommendation Summary:
4.1 Technical Summary:
Price Performance:
- Trend Structure and Price Action: FRO maintains a firm medium-term uptrend, recently advancing toward the USD 29–30 zone near its yearly highs. The stock remains above both the 21-day and 50-day moving averages, confirming higher lows and sustained buying momentum, though proximity to resistance may invite short-term consolidation.
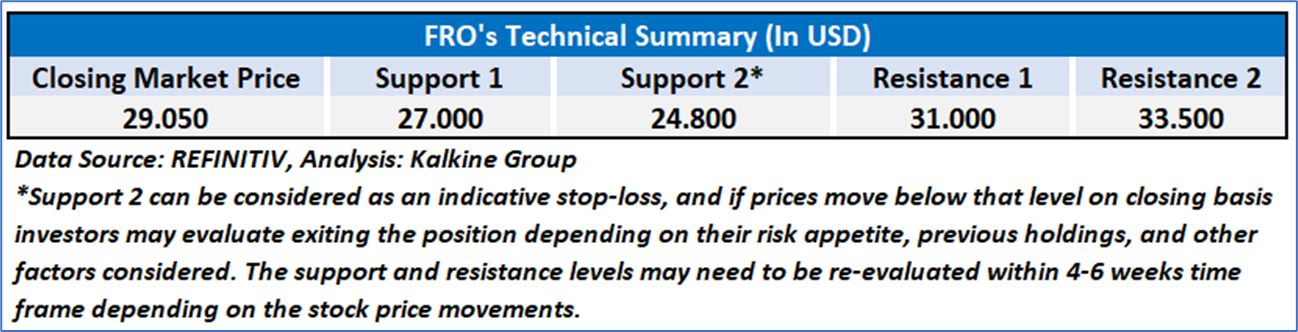
- Moving Averages and Support Levels: The 21-day moving average remains above the 50-day average, reinforcing a bullish technical structure. Immediate support is seen near USD 27.30, with stronger backing around USD 24.50; holding above these levels preserves the constructive trend outlook.
- Momentum and Volume Dynamics: RSI near 68 indicates strong momentum, approaching but not yet in overbought territory. Volume participation remains supportive of the recent advance, suggesting underlying demand, although minor pullbacks may occur as momentum normalizes.
4.2 Fundamental Valuation
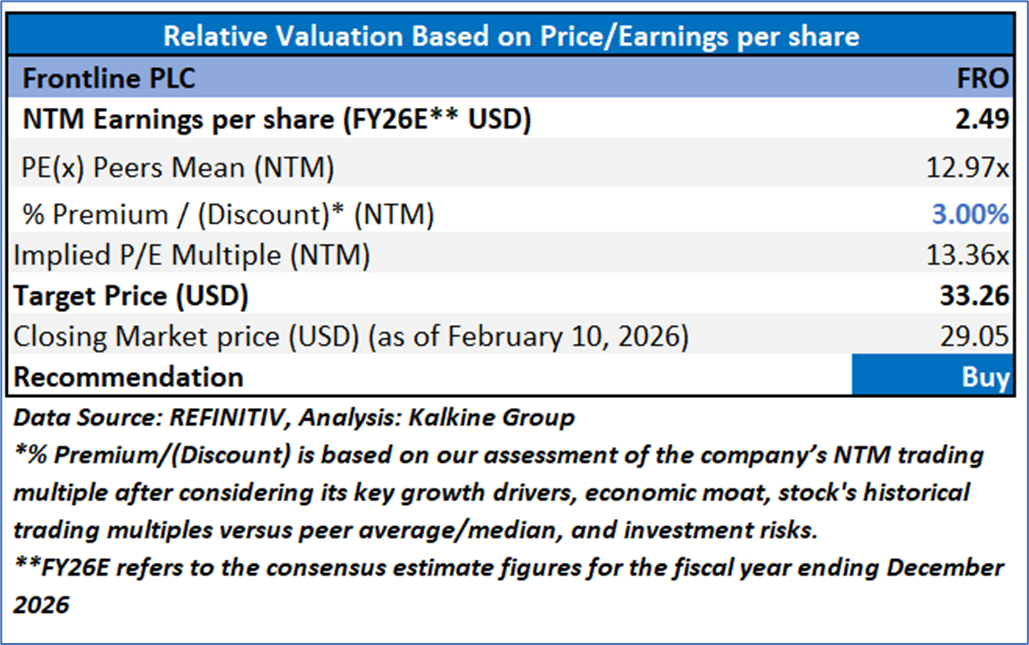
Valuation Methodology: Price/Earnings Per Share Multiple Based Relative Valuation
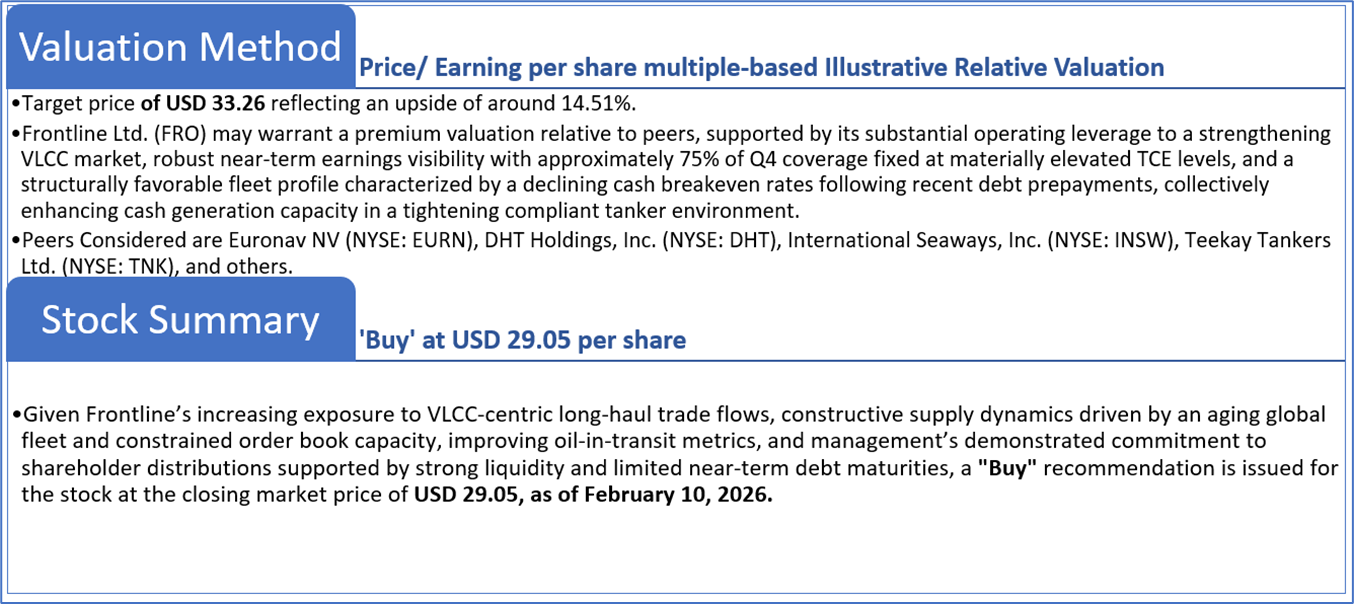
Markets are trading in a highly volatile zone currently due to certain macroeconomic issues and geopolitical tensions prevailing. Therefore, it is prudent to follow a cautious approach while investing.
Note 1: Past performance is not a reliable indicator of future performance.
Note 2: The reference date for all price data, currency, technical indicators, support, and resistance levels is February 10, 2026. The reference data in this report has been partly sourced from REFINITIV.
Note 3: Investment decisions should be made depending on an individual's appetite for upside potential, risks, holding duration, and any previous holdings. An 'Exit' from the stock can be considered if the Target Price mentioned as per the Valuation and or the technical levels provided has been achieved and is subject to the factors discussed above.
Note 4: The report publishing date is as per the Pacific Time Zone.
Technical Indicators Defined: -
Support: A level at which the stock prices tend to find support if they are falling, and a downtrend may take a pause backed by demand or buying interest. Support 1 refers to the nearby support level for the stock and if the price breaches the level, then Support 2 may act as the crucial support level for the stock.
Resistance: A level at which the stock prices tend to find resistance when they are rising, and an uptrend may take a pause due to profit booking or selling interest. Resistance 1 refers to the nearby resistance level for the stock and if the price surpasses the level, then Resistance 2 may act as the crucial resistance level for the stock.
Stop-loss: It is a level to protect against further losses in case of unfavorable movement in the stock prices.
Past performance is not a reliable indicator of future performance.

 NZ
 UK
 US
 AU
 IND

 CA

 Please wait processing your request...