Kalkine’s Global Tariff Report provides fully independent analysis and data-driven analysis of major global sectors affected by tariff changes, evaluating the implications these shifts may have on equity valuations across those industries. The report concentrates on trade-sensitive sectors that typically experience heightened investor scrutiny during periods of tariff uncertainty. It also identifies defensive and countercyclical segments that demonstrate relative resilience or may even outperform, amid disruptions to global trade flows.
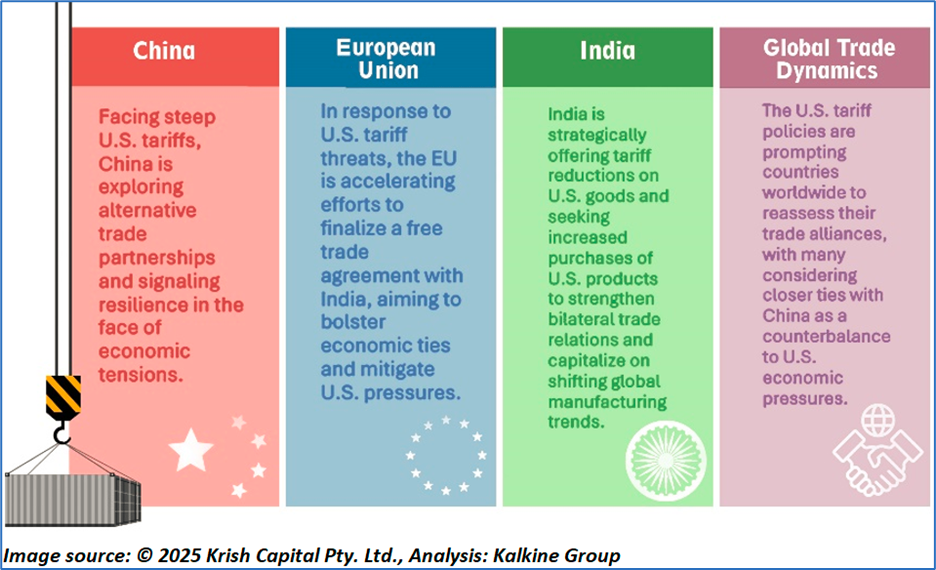
As illustrated in the table below, several key sectors in different countries are directly impacted by the recent tariff announcement from President Trump.

Latest Updates on Global Tariffs by Trump’s Administration
- S.–India Tariffs Elevated to 50 percent: The United States increased tariffs on Indian imports to 50 percent on most goods effective August 27, 2025, combining baseline, reciprocal, and additional duties as part of broader trade and geopolitical pressure—targeting sectors such as textiles, gems, jewelry, and leather, while exempting key strategic sectors such as pharmaceuticals and semiconductors.
- Broad Reciprocal and Section 232 Tariffs on Major Trading Partners: Under Trump’s reciprocal tariff policy effective mid-2025, a baseline tariff regime now imposes elevated duties on imports from multiple countries, with Canada’s rate near ~35 percent, and other nations facing tariffs in the 25 percent–40 percent range unless reduced through agreements; steel and aluminum imports from almost all origins are also subject to 50 percent Section 232 tariffs on key products following proclamation adjustments.
- Tariff Levels with Brazil, New Zealand, and Other Partners: The U.S. imposed reciprocal tariff actions on Brazil, including a 40–50 percent tariff framework on Brazilian goods before partial adjustments, reflecting broader trade tensions, while New Zealand exports face tariffs raised to about 15 percent under the expanded reciprocal tariff policy.
- Adjustments and Temporary Pauses in U.S.–China Tariffs: While some tariffs on Chinese goods were temporarily paused or adjusted (e.g., a 10 percent reciprocal tariff extension), broader tariff regimes including Section 301 and steel/aluminum duties continue to apply to Chinese exports, maintaining elevated trade costs on key industrial and manufactured products.
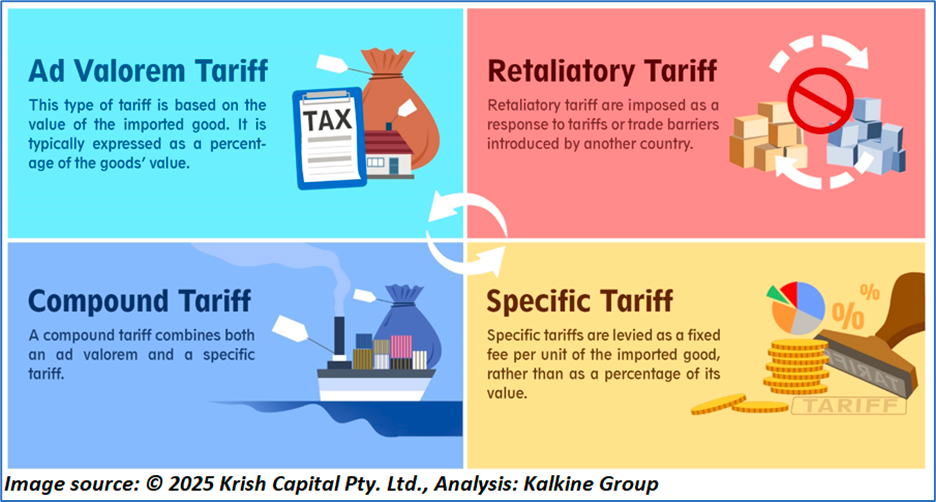
What are the different types of Tariffs?
A Snapshot of USA’s Trade Size
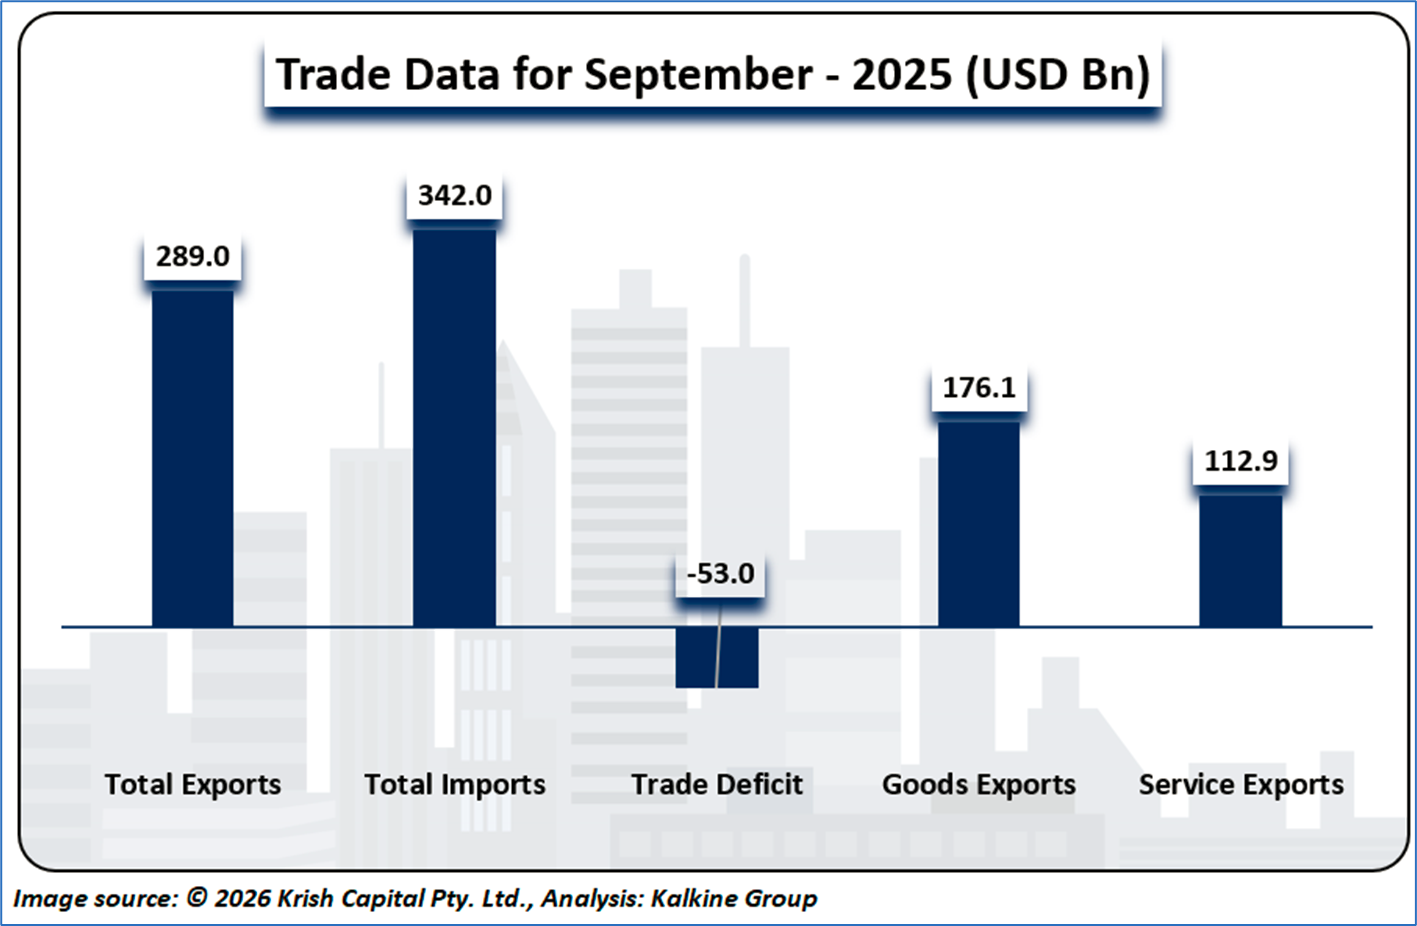
In September 2025, the United States recorded total exports of USD 289.0 billion against total imports of USD 342.0 billion, resulting in a trade deficit of USD 53.0 billion, underscoring continued external demand imbalances. Goods exports accounted for USD 176.1 billion, reflecting the ongoing contribution of manufacturing, energy, and agricultural shipments, while services exports reached USD 112.9 billion, highlighting the structural strength of high-value service sectors such as technology, financial services, and intellectual property. Despite robust services performance partially offsetting the deficit, the sizable gap indicates sustained import demand and global supply-chain dependence, suggesting that trade dynamics remain a moderating factor for near-term GDP growth and external balance conditions.
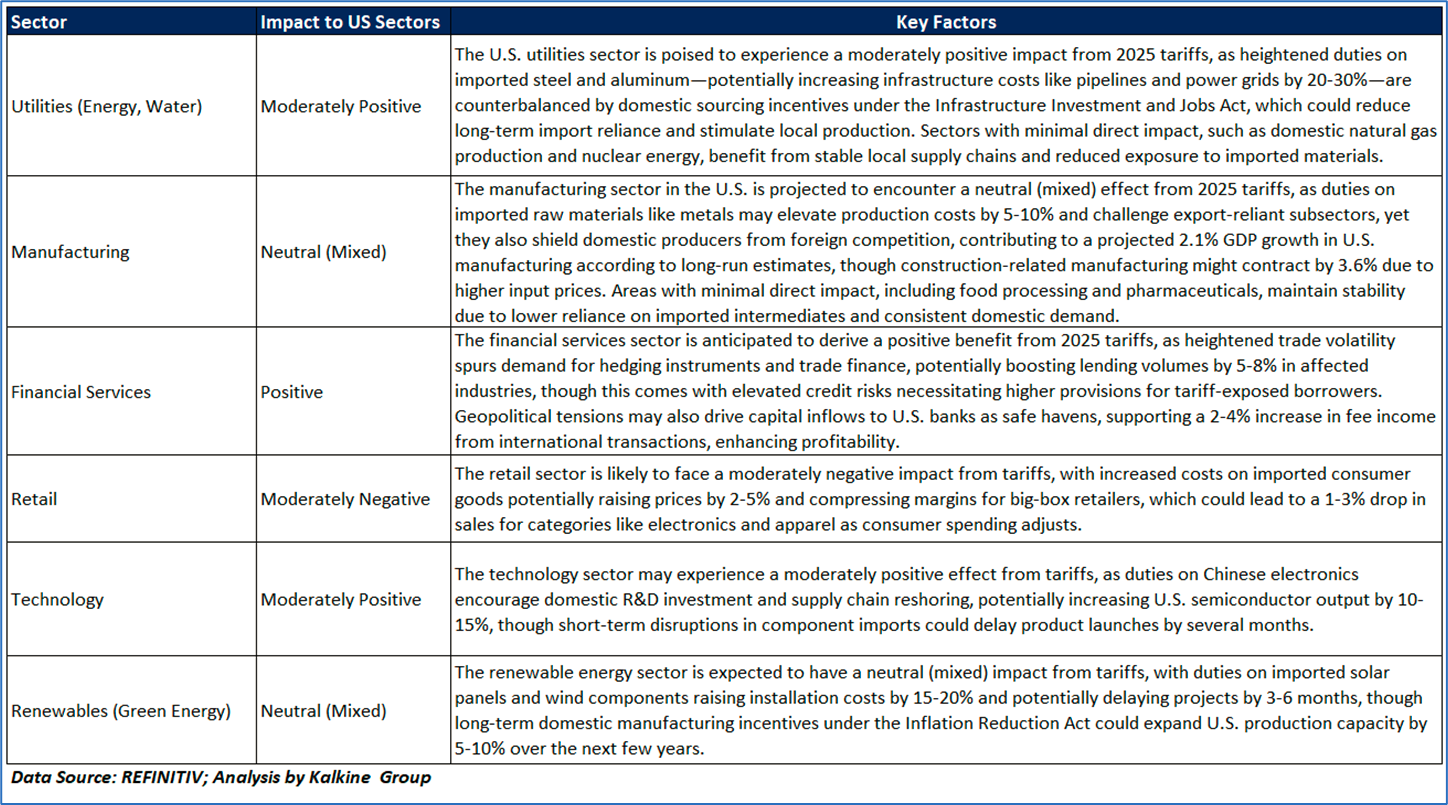
Impact of US Tariffs on Various Sectors
The U.S. economy is currently grappling with significant challenges, including high inflation, supply chain disruptions, and the effects of aggressive monetary policy from the Federal Reserve. Key sectors such as manufacturing, agriculture, and technology are feeling strain, particularly due to their dependence on global supply chains and export markets, with trade policies like tariffs on steel, aluminum, and electronics driving up costs for businesses and consumers alike. Despite these pressures, there’s cautious optimism in some quarters about market stabilization within the next year, though this is tempered by ongoing issues like labor shortages, energy price volatility, and political divisions. The Federal Reserve’s interest rate hikes aimed at curbing inflation—still above target levels—have slowed economic growth, raising recession risks, while strategic efforts such as trade agreements and supply chain diversification remain critical to fostering stability and mitigating prolonged uncertainty across these vital sectors.
Why U.S.-Based Energy Products & Services Providers Appear Attractive Despite Tariff Concerns?
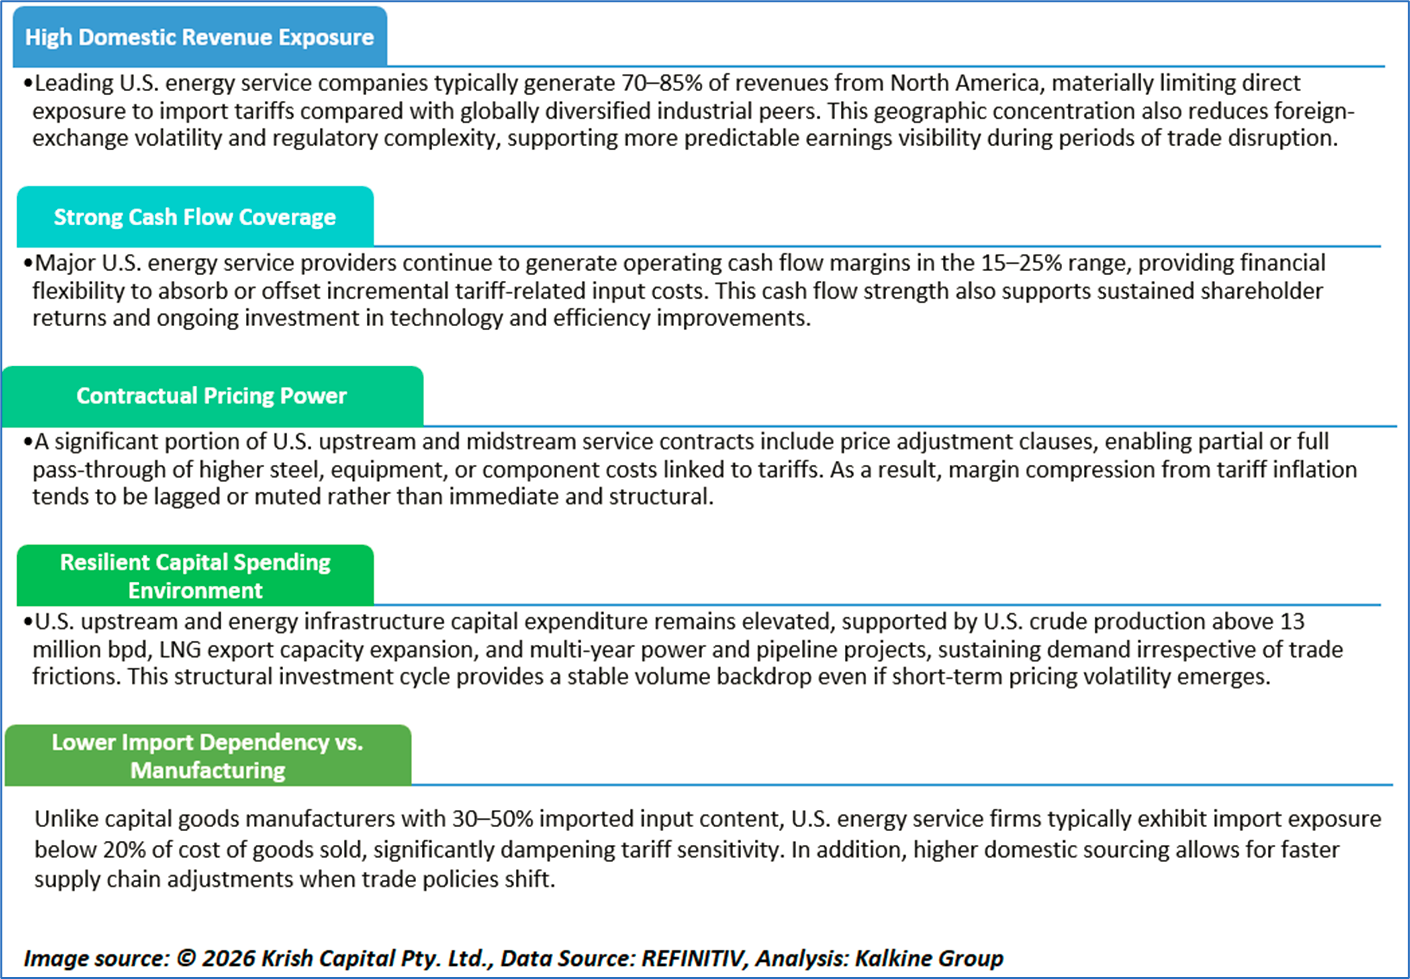
Amid elevated Market Volatility and Tariff pressures, Halliburton Company (NYSE: HAL) stands out as our defensive pick within the Energy Sector, supported by rigorous fundamental and technical research
Kalkine’s Global Tariff Report covers the Investment Highlights, Key Financial Metrics, Risks, Technical Analysis along with the Valuation, Target Price, and Recommendation on Halliburton Company (NYSE: HAL).
Section 1: Company Overview and Fundamental Insights
1.1 Company Overview:
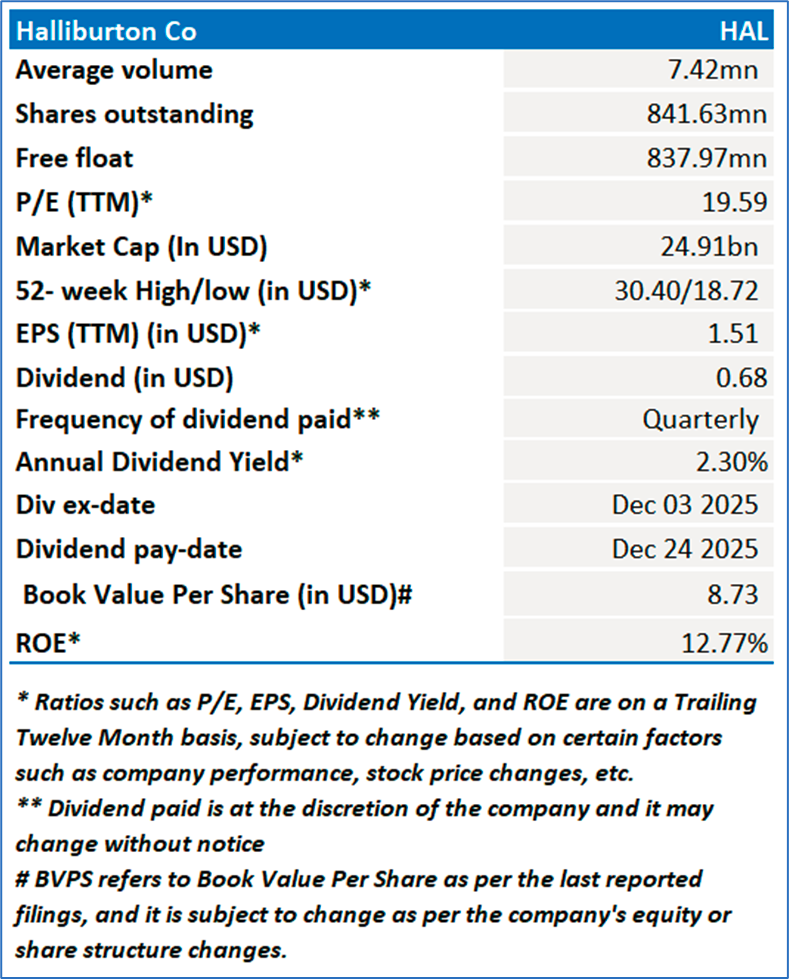
Halliburton Company (NYSE: HAL) is a provider of products and services to the energy industry. The Company operates through two segments: Completion and Production and the Drilling and Evaluation. The Completion and Production segment delivers cementing, stimulation, specialty chemicals, intervention, pressure control, artificial lift, and completion products and services. The segment consists of artificial lift, cementing, completion tools, pipeline and process services, production enhancement, and production solutions.
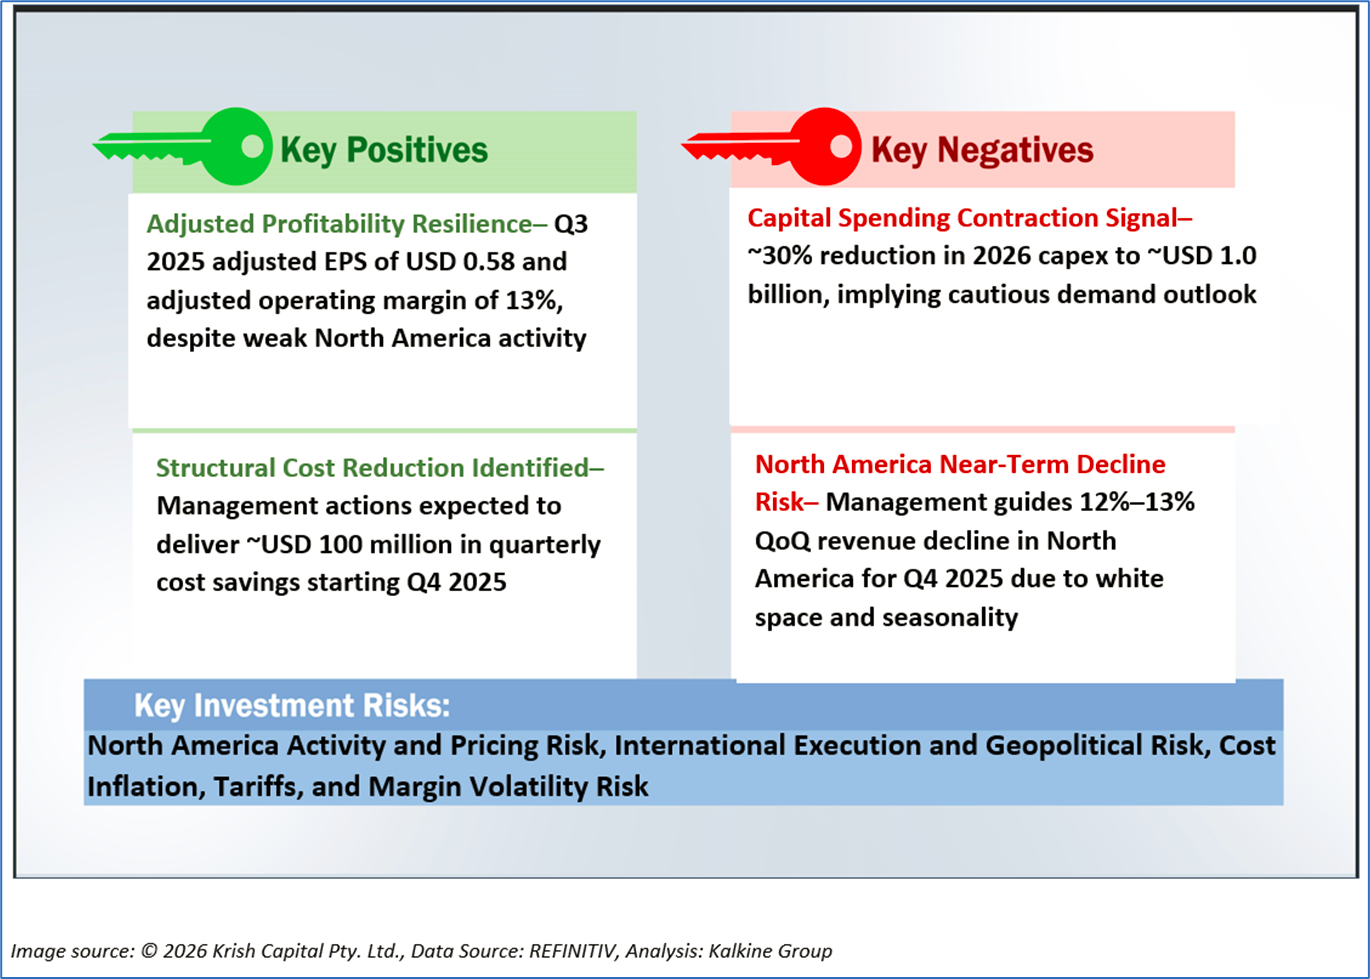
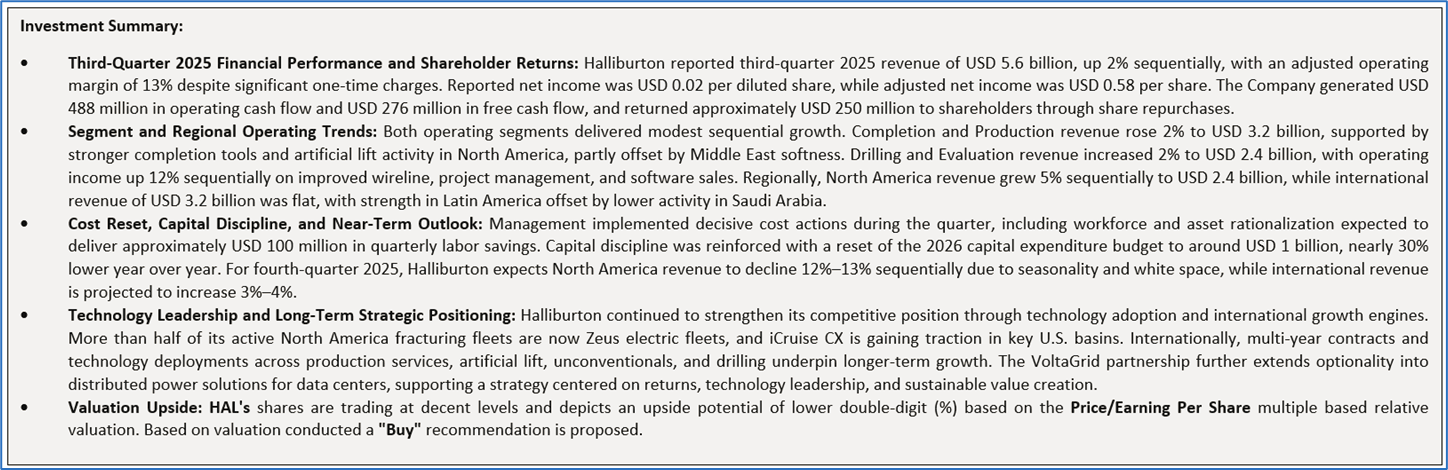
1.2 The Key Positives, Negatives, Investment Highlights and Risks
1.3 Top 10 Shareholders:
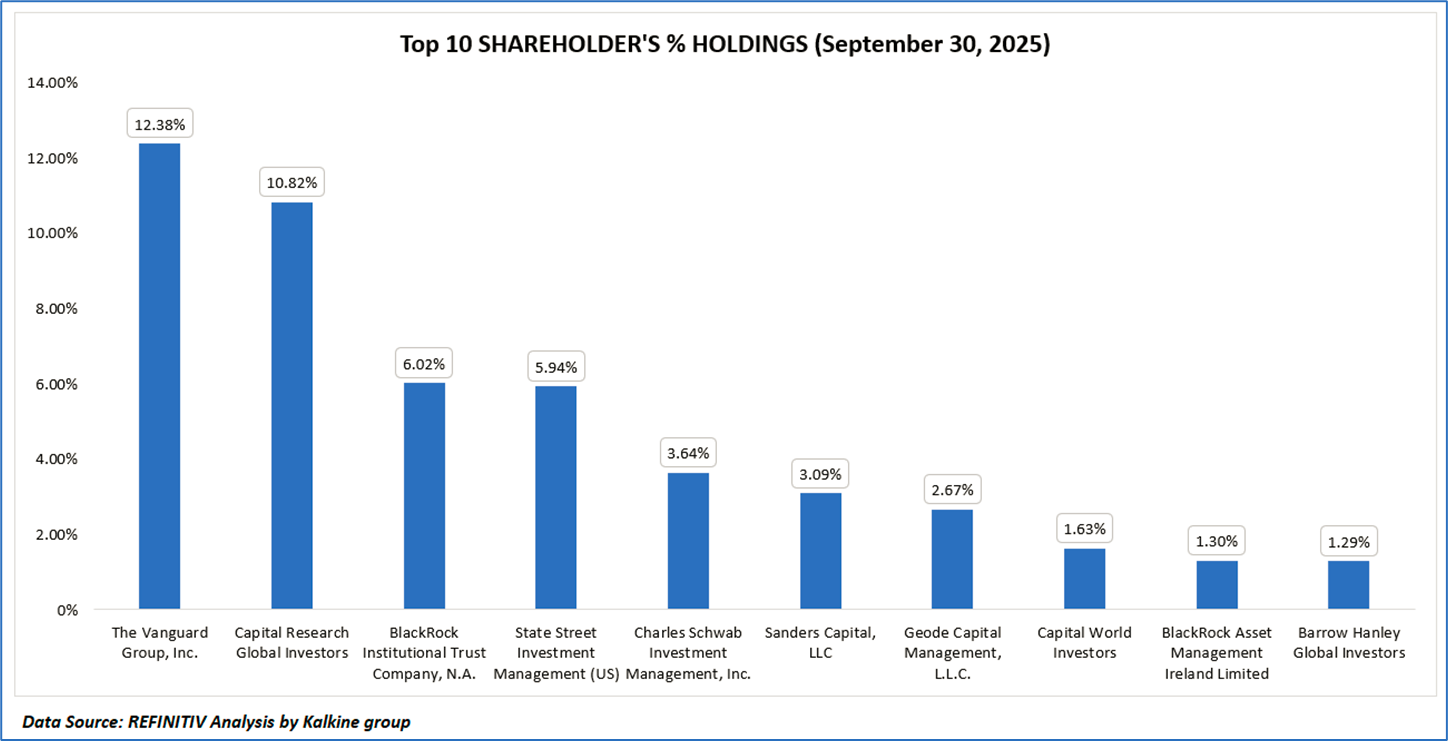
The top 10 shareholders together form ~48.78% of the total shareholding, indicating concentrated holding. The Vanguard Group, Inc., and Capital Research Global Investors hold a maximum stake in the company at ~12.38% and ~10.82%, respectively.
1.4 Key Metrics:
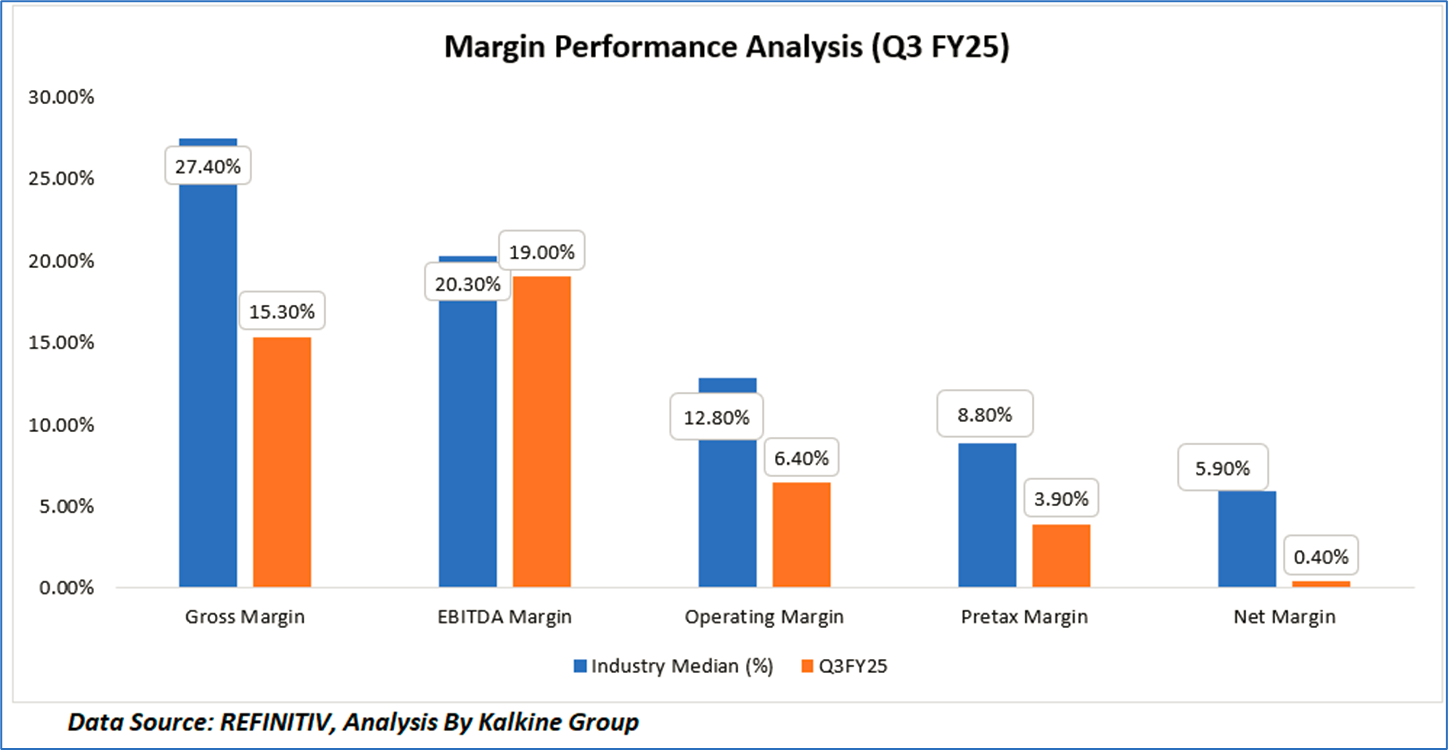
Halliburton’s Q3 FY25 profitability metrics materially underperformed industry medians across the margin stack, reflecting near-term operational and cost pressures. Gross margin at 15.3%, well below the industry median of 27.4%, indicates weaker pricing realization and elevated input or restructuring costs, which cascaded through the income statement. EBITDA margin of 19.0% was broadly in line but still modestly below the 20.3% industry benchmark, suggesting that cost controls partially offset topline and gross margin weakness. However, operating margin at 6.4% versus 12.8% and pretax margin at 3.9% versus 8.8% highlight the impact of impairments, restructuring charges, and operating leverage compression. Net margin of 0.4%, sharply below the 5.9% industry median, underscores the burden of non-recurring charges and tax effects during the quarter, pointing to subdued near-term earnings quality despite relatively resilient EBITDA generation.
Section 2: Business Updates and Financial Highlights
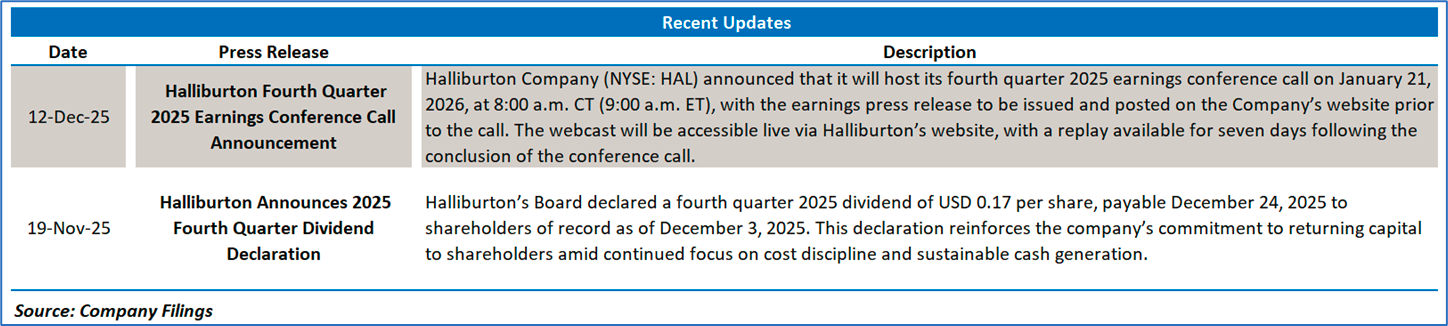
2.1 Recent Updates: The below picture gives an overview of the company’s update on its next reporting date.
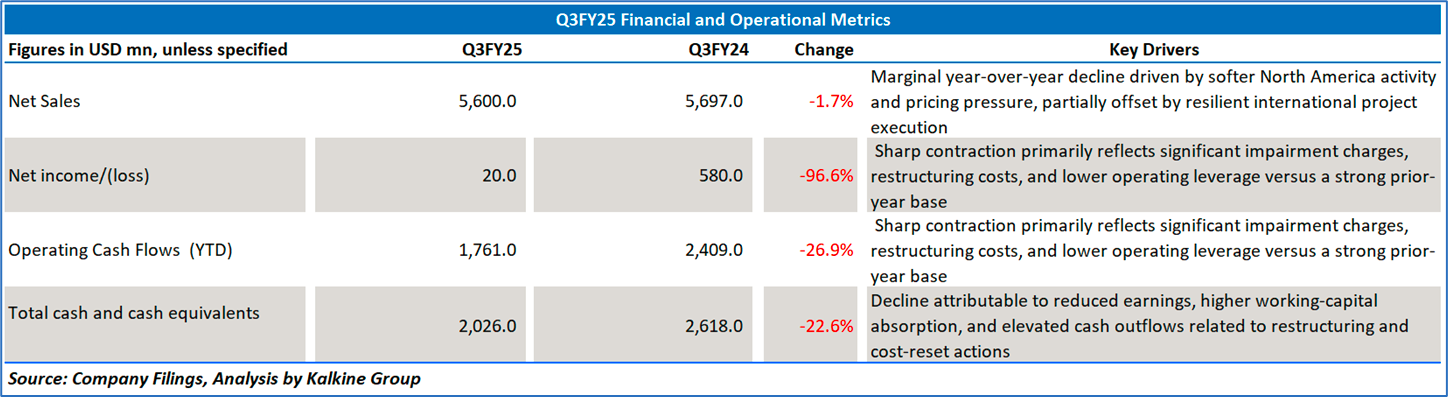
2.2 Insights into Q3FY25 Financial Performance:
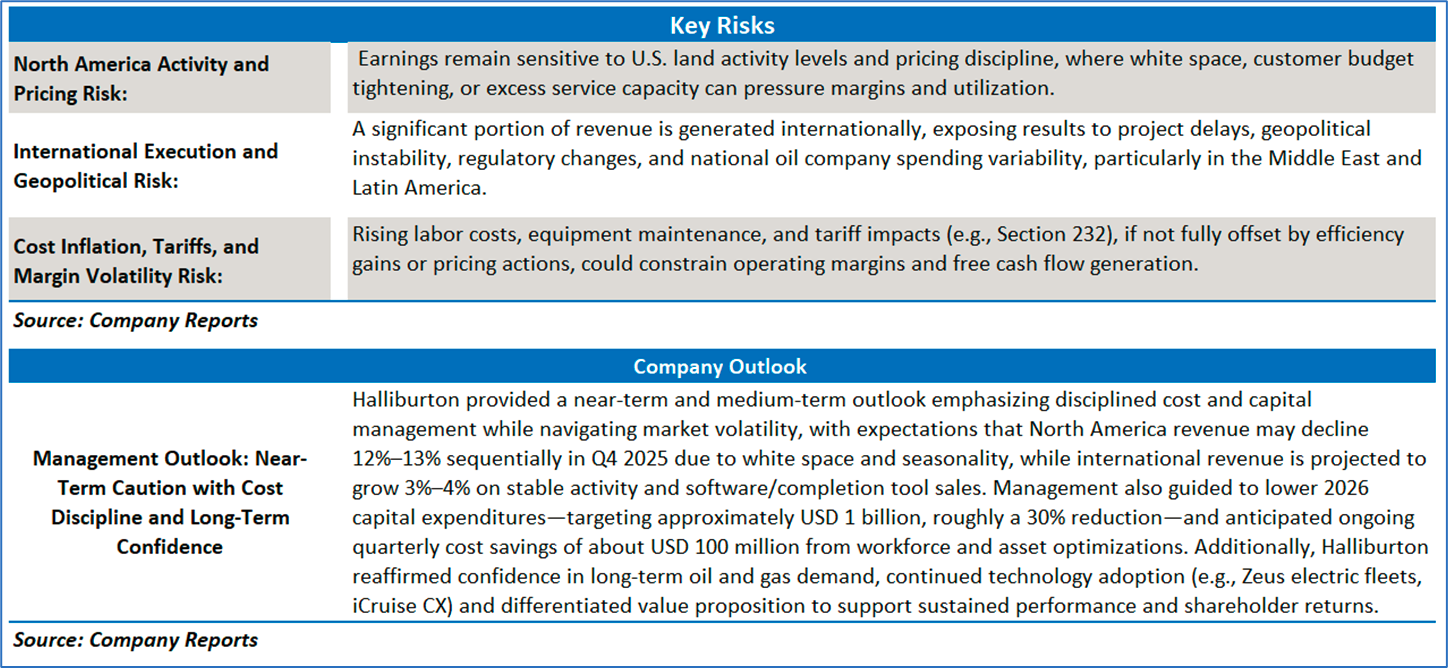
Section 3: Key Risks, Company Outlook:
Section 4: Stock Recommendation Summary:
4.1 Price Performance and Technical Summary:
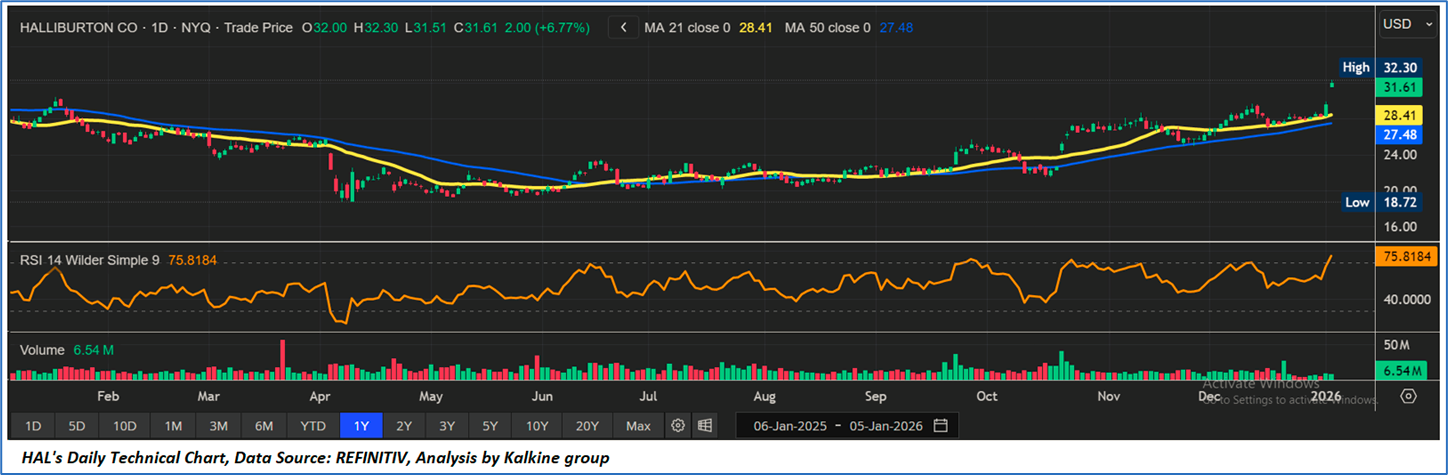
- Trend and Price Structure: HAL is in a clear uptrend, trading above its 21-day and 50-day moving averages, with their bullish alignment confirming sustained buying interest and positive price structure.
- Momentum and Volume: RSI near 76 signals strong momentum but also indicates near-overbought conditions, suggesting upside strength may be followed by short-term consolidation, while volume points to orderly accumulation rather than excess speculation.
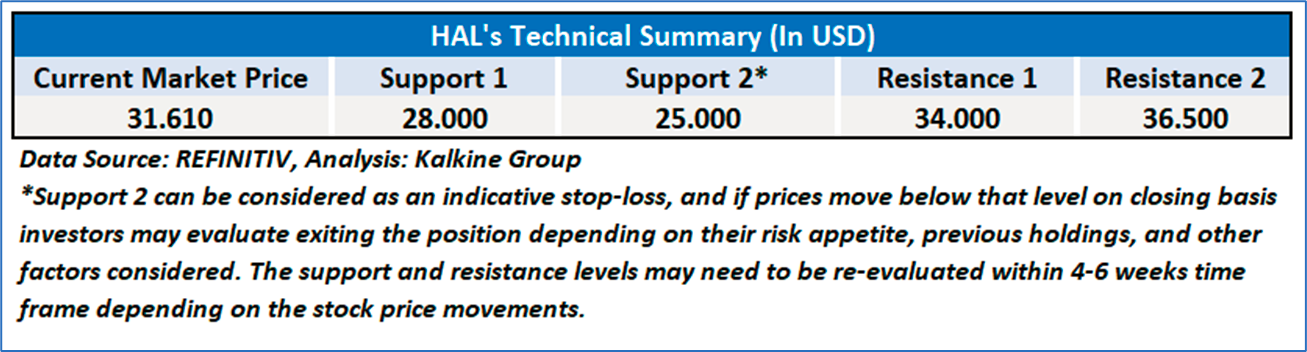
- Support, Resistance, and Bias: Key support lies around USD 28–28.5, with stronger support near USD 27–27.5, while resistance is near the recent high around USD 32.3; overall, the technical bias remains bullish with limited near-term consolidation risk.
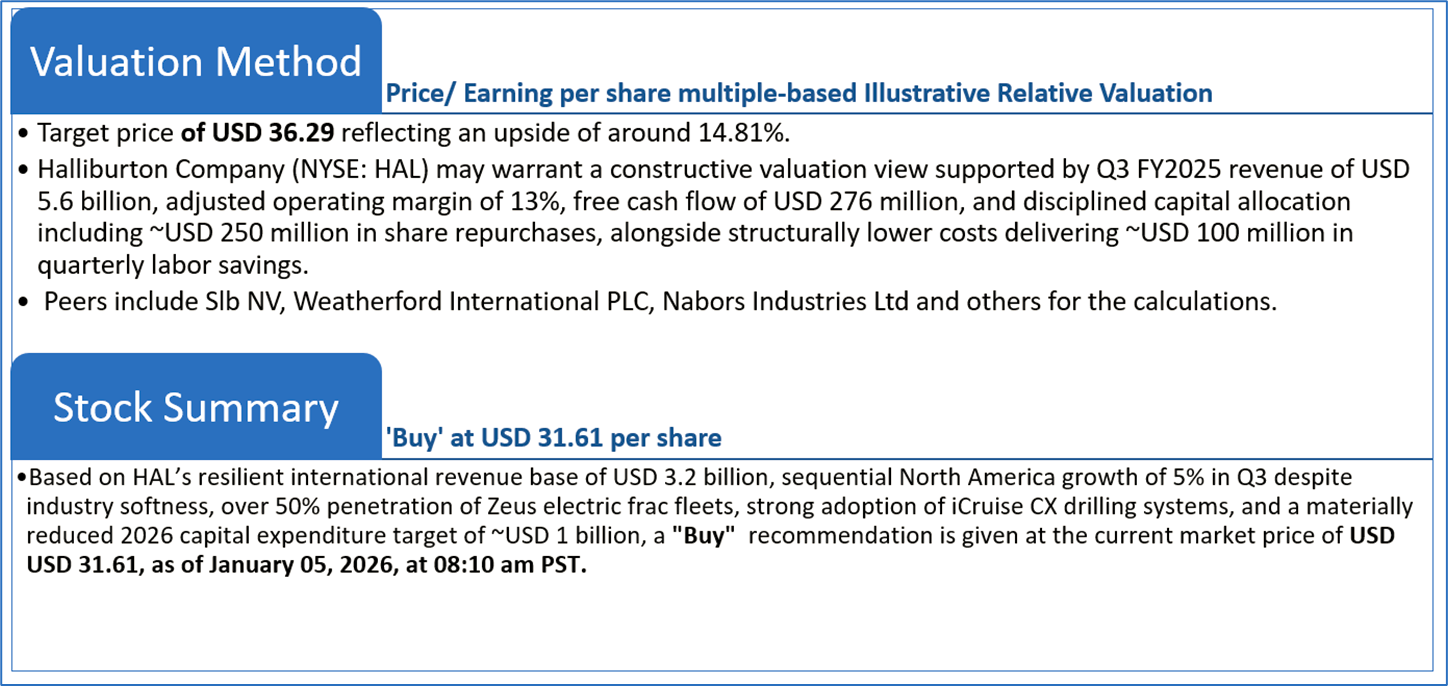
4.2 Fundamental Valuation
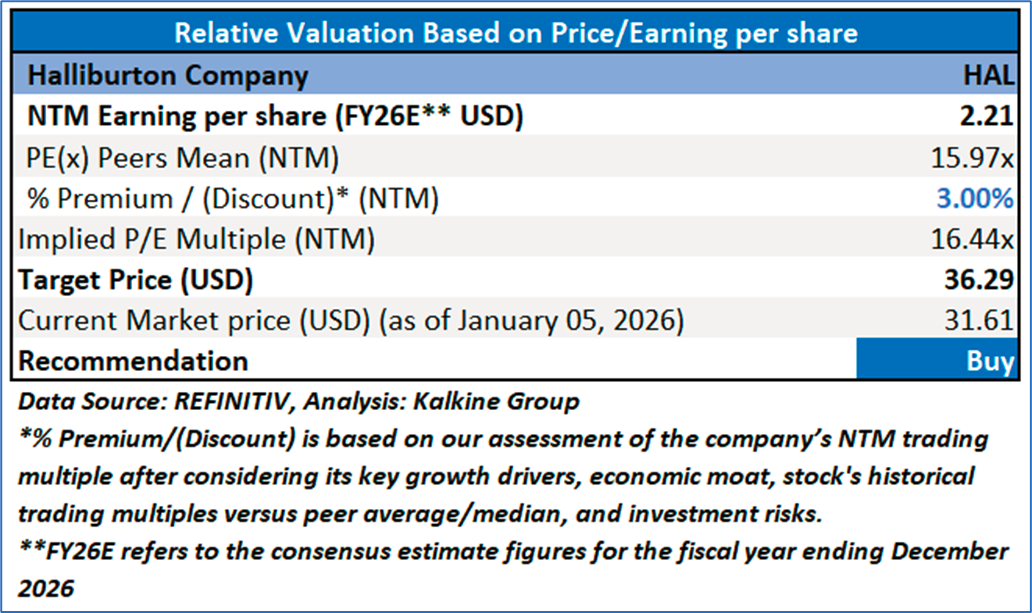
Valuation Methodology: Price/ Earnings Per Share Multiple Based Relative Valuation (Illustrative)
Note 1: Past performance is not a reliable indicator of future performance.
Note 2: The reference date for all price data, currency, technical indicators, support, and resistance levels as on January 05, 2026. The reference data in this report has been partly sourced from REFINITIV.
Note 3: Investment decisions should be made depending on an individual's appetite for upside potential, risks, holding duration, and any previous holdings. An 'Exit' from the stock can be considered if the Target Price mentioned as per the Valuation and or the technical levels provided has been achieved and is subject to the factors discussed above.
Note 4: Dividend Yield may vary as per the stock price movement.
Note 5: Kalkine reports are prepared based on the stock prices captured either from REFINITIV or Trading View. Typically, REFINITIV or Trading View may reflect stock prices with a delay which could be a lag of 25-30 minutes. There can be no assurance that future results or events will be consistent with the information provided in the report. The information is subject to change without any prior notice.
Technical Indicators Defined: -
Support: A level at which the stock prices tend to find support if they are falling, and a downtrend may take a pause backed by demand or buying interest.
Resistance: A level at which the stock prices tend to find resistance when they are rising, and the uptrend may take a pause due to profit booking or selling interest.
Stop-loss: In general, it is a level to protect further losses in case of any unfavorable movement in the stock prices.
Past performance is not a reliable indicator of future performance.

 NZ
 UK
 US
 AU
 IND

 CA

 Please wait processing your request...