Kalkine’s Global Tariff Report provides fully independent analysis and data-driven analysis of major global sectors affected by tariff changes, evaluating the implications these shifts may have on equity valuations across those industries. The report concentrates on trade-sensitive sectors that typically experience heightened investor scrutiny during periods of tariff uncertainty. It also identifies defensive and countercyclical segments that demonstrate relative resilience or may even outperform, amid disruptions to global trade flows.
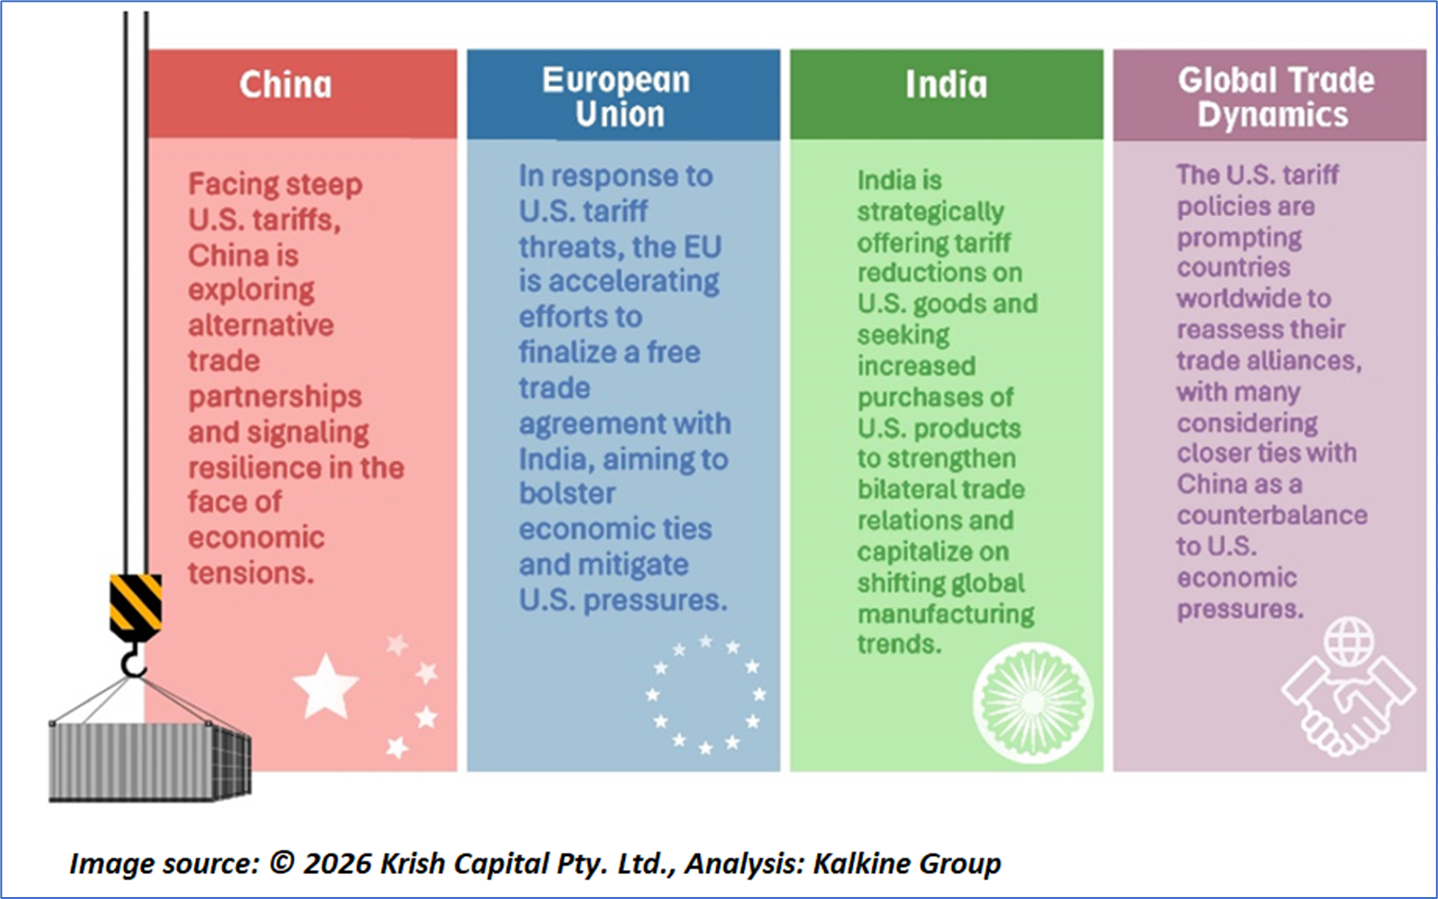
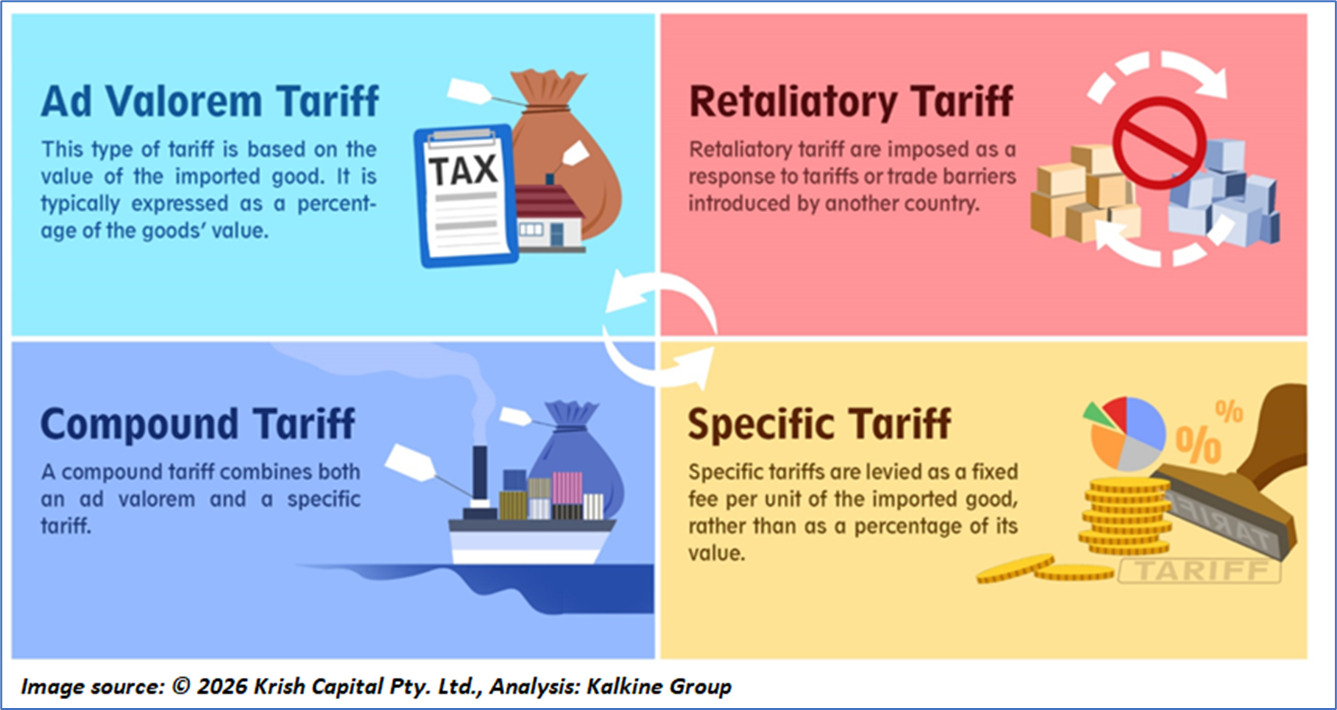
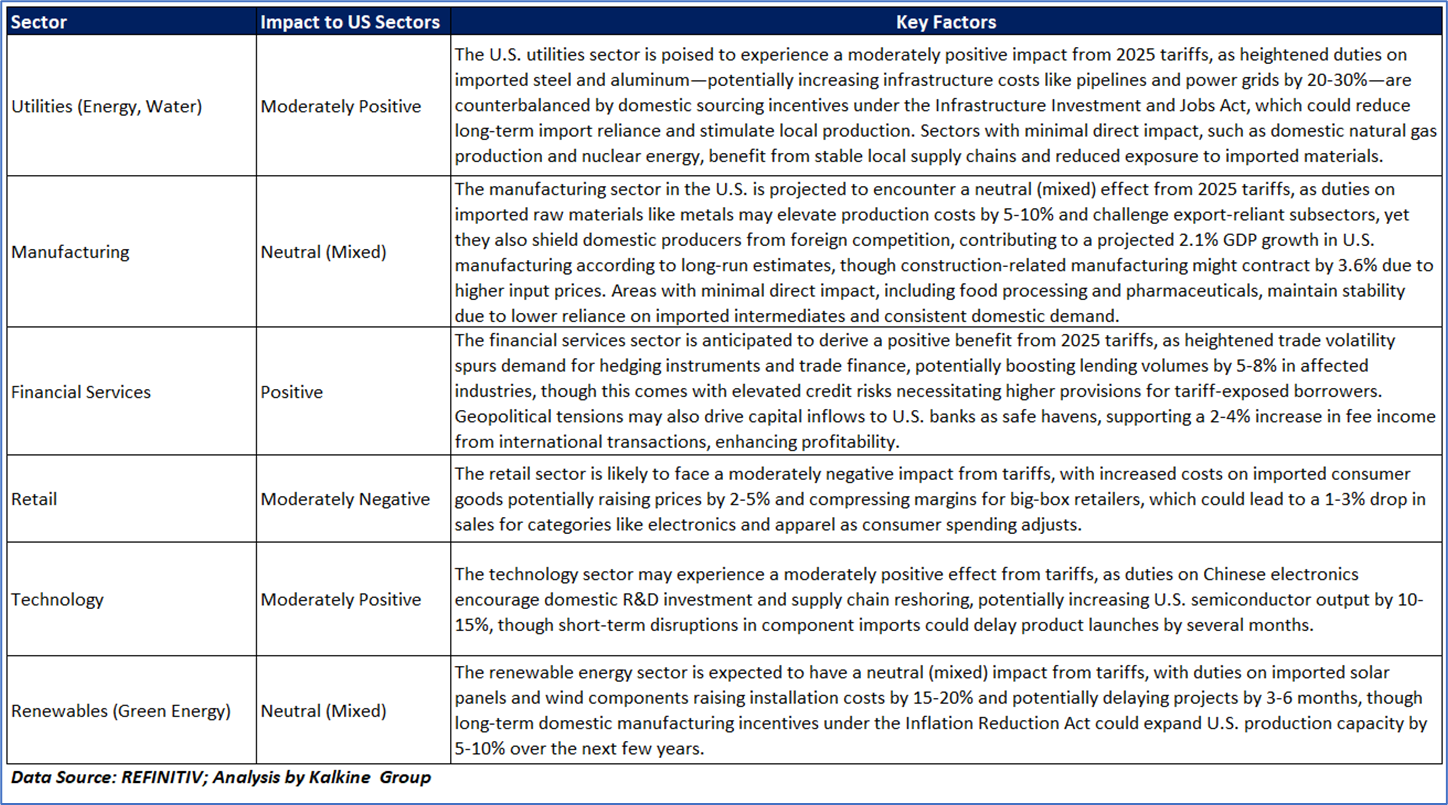
As illustrated in the table below, several key sectors in different countries are directly impacted by the recent tariff announcement from President Trump.

Latest Updates on Global Tariffs by Trump’s Administration
Key Developments
- S. Tariff Regime Transition: From Broad Escalation to Interim Stabilization: Following the U.S. Supreme Court tariff ruling February 2026, the United States has transitioned toward a temporary, broad-based tariff framework of approximately 10%, applicable for an interim period of roughly 150 days, effectively replacing previously invalidated country-specific reciprocal tariff measures. This policy shift is being complemented by the initiation of fresh trade investigations under alternative statutory provisions, reflecting a move toward a more rules-based yet still evolving tariff regime. Concurrent legal challenges from multiple U.S. states have introduced an additional layer of uncertainty, reinforcing the interim nature of the framework. While the immediate risk of broad-based tariff escalation has moderated, the policy trajectory remains fluid, with periodic volatility expected due to ongoing legal, political, and administrative developments.
- North America and India: Diverging Trade Dynamics and Strategic Realignments: From a regional perspective, the United States continues to maintain approximately 35% tariffs on non-compliant Canadian exports under the USMCA framework, while preserving tariff-free access for compliant trade flows, thereby sustaining stability across integrated supply chains such as autos and energy. Canada’s retaliatory tariff measures remain partially in force, particularly across metals and automotive sectors, despite selective rollbacks. In the case of India, U.S. tariffs on key export categories remain unchanged, and bilateral trade negotiations have decelerated amid renewed U.S. trade investigations; however, India has advanced diversification efforts, including progress toward a potential India-EU Free Trade Agreement, aimed at enhancing market access beyond the U.S. corridor.
- S.–China and U.S.–EU Relations: Stabilisation Without Structural Resolution: In relation to China, the U.S.–China tariff truce remains operational, maintaining reduced tariff intensity and temporary easing of certain non-tariff barriers, although the effective tariff burden continues to remain elevated in the ~25–30% range, thereby limiting substantive relief. While recent bilateral engagements have contributed to short-term stabilisation, no structural rollback of tariffs has been achieved, and ongoing U.S. investigations—particularly in strategic sectors such as semiconductors—continue to underpin medium-term uncertainty. Similarly, the U.S.–European Union trade framework currently caps most EU-origin exports at approximately 15% effective tariff levels, with the European Commission maintaining a suspension of retaliatory tariffs to support a de-escalatory environment. Nevertheless, incomplete legislative formalisation and unresolved sector-specific negotiations (notably in steel, aluminium, and semiconductors) indicate that targeted tariff risks persist.
- Global Trade Outlook: Managed Stability Amid Persistent Structural Uncertainty: Overall, the global trade environment has transitioned from a phase of broad-based escalation to one of managed stability, albeit without full normalisation. While systemic tariff risks have eased, sector-specific measures, legal uncertainties, and geopolitical signalling continue to drive episodic volatility. Consequently, global trade flows are increasingly shaped by diversification strategies—particularly among economies such as India and the European Union—and by the gradual evolution toward more structured, rule-based trade frameworks.


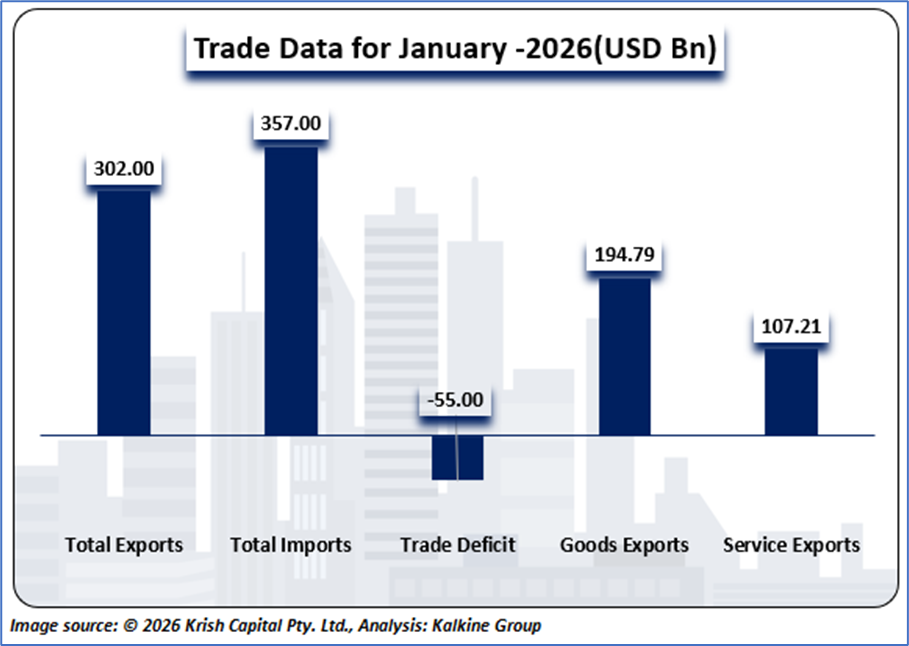
The U.S. trade data for January 2026 indicates a moderate widening of the trade imbalance, with total exports of USD 302.0 billion versus imports of USD 357.0 billion, resulting in a trade deficit of USD 55.0 billion. The export composition reflects a continued structural skew toward goods, which accounted for USD 194.8 billion (~64%), while services contributed USD 107.2 billion (~36%), highlighting the resilience of the U.S. services sector as a key external earnings driver. However, the elevated import level suggests sustained domestic demand and consumption strength, which continues to outpace export growth. Overall, the data reflects a persistent structural deficit, underpinned by strong import intensity and reliance on goods trade, partially offset by comparatively stable and high-margin service exports.

The U.S. economy is currently grappling with significant challenges, including high inflation, supply chain disruptions, and the effects of aggressive monetary policy from the Federal Reserve. Key sectors such as manufacturing, agriculture, and technology are feeling strain, particularly due to their dependence on global supply chains and export markets, with trade policies like tariffs on steel, aluminum, and electronics driving up costs for businesses and consumers alike. Despite these pressures, there’s cautious optimism in some quarters about market stabilization within the next year, though this is tempered by ongoing issues like labor shortages, energy price volatility, and political divisions. The Federal Reserve’s interest rate hikes aimed at curbing inflation—still above target levels—have slowed economic growth, raising recession risks, while strategic efforts such as trade agreements and supply chain diversification remain critical to fostering stability and mitigating prolonged uncertainty across these vital sectors.

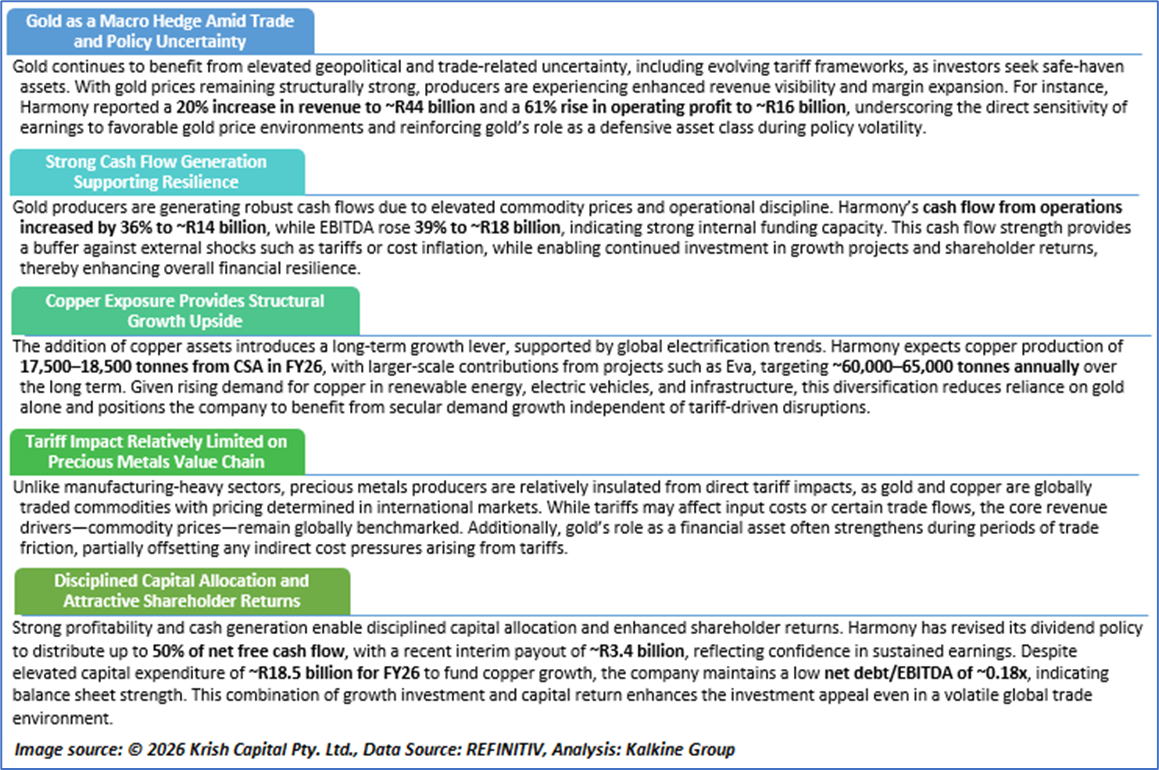
Amid elevated Market Volatility and Tariff pressures, Harmony Gold Mining Company Ltd (NYSE: HMY) stands out as our defensive pick within the Oil & Gas transportation Industry, supported by rigorous fundamental and technical research
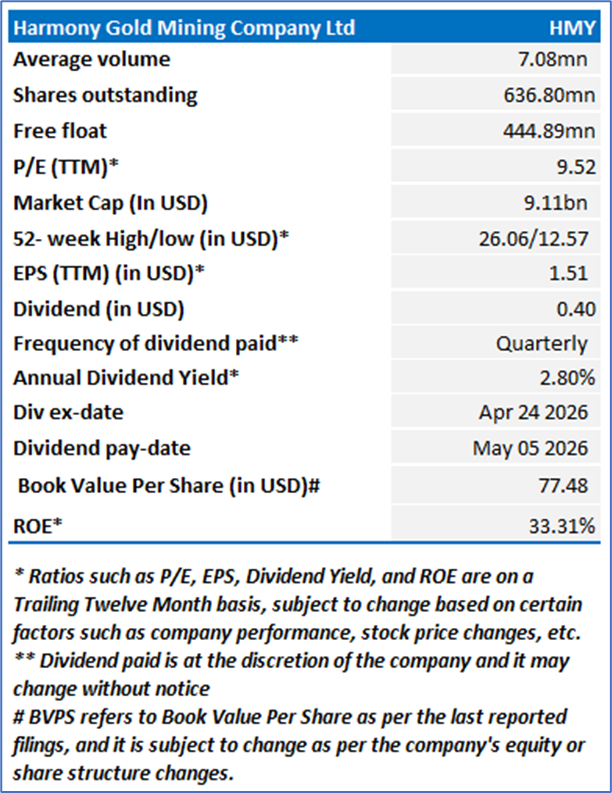
Kalkine’s Global Tariff Report covers the Investment Highlights, Key Financial Metrics, Risks, Technical Analysis along with the Valuation, Target Price, and Recommendation on Harmony Gold Mining Company Ltd (NYSE: HMY).
Section 1: Company Overview and Fundamental Insights
1.1 Company Overview:
Harmony Gold Mining Company Limited (NYSE: HMY) is a mining company. It acquires, explores, develops, and operates gold and uranium properties, through its underground and open-pit mines in South Africa, and its Hidden Valley open-pit mine in Papua New Guinea. Its main products are gold bullion and uranium concentrate, extracted from deep-level and surface mining operations. Its segments include South Africa Underground, Surface, and International.
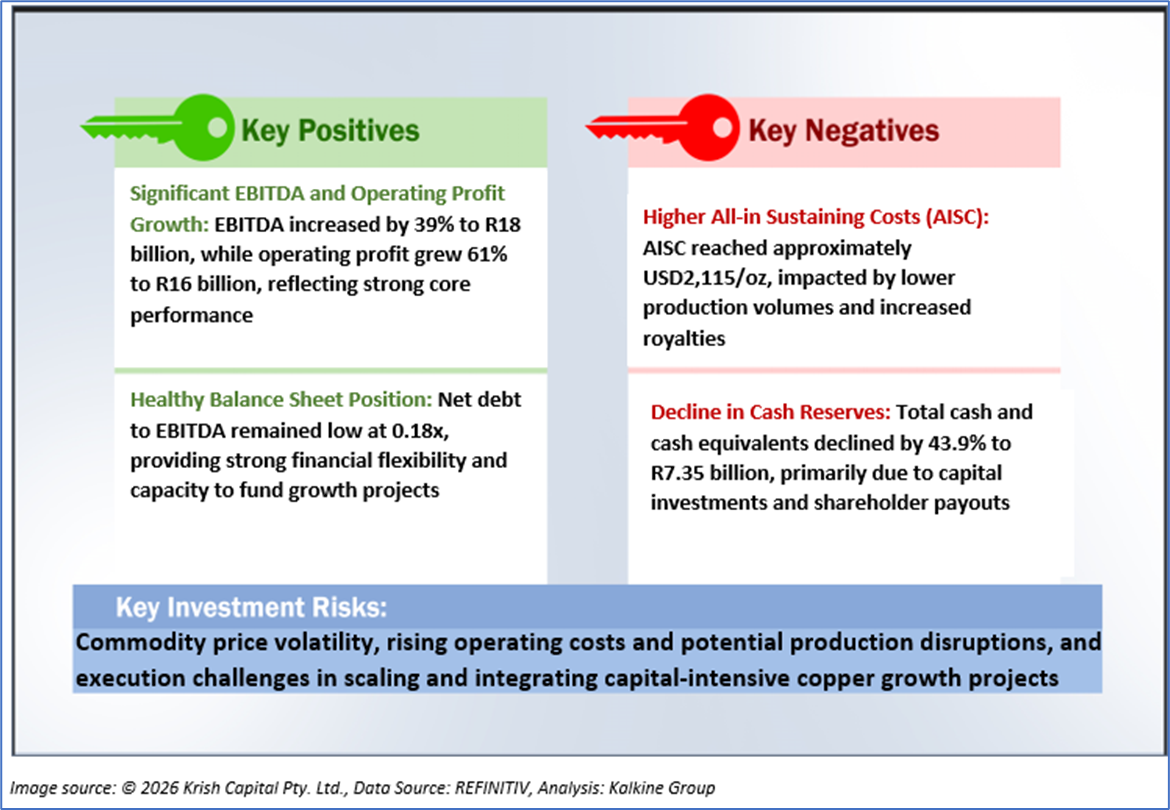
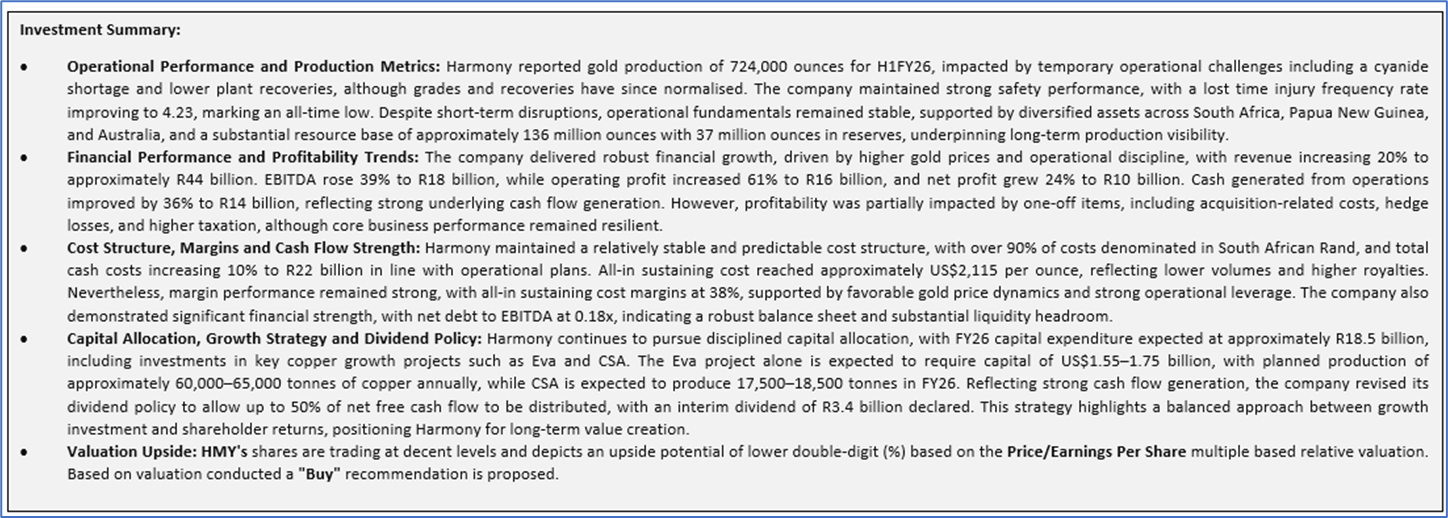
1.2 The Key Positives, Negatives, Investment Highlights and Risks
1.3 Top 10 Shareholders:
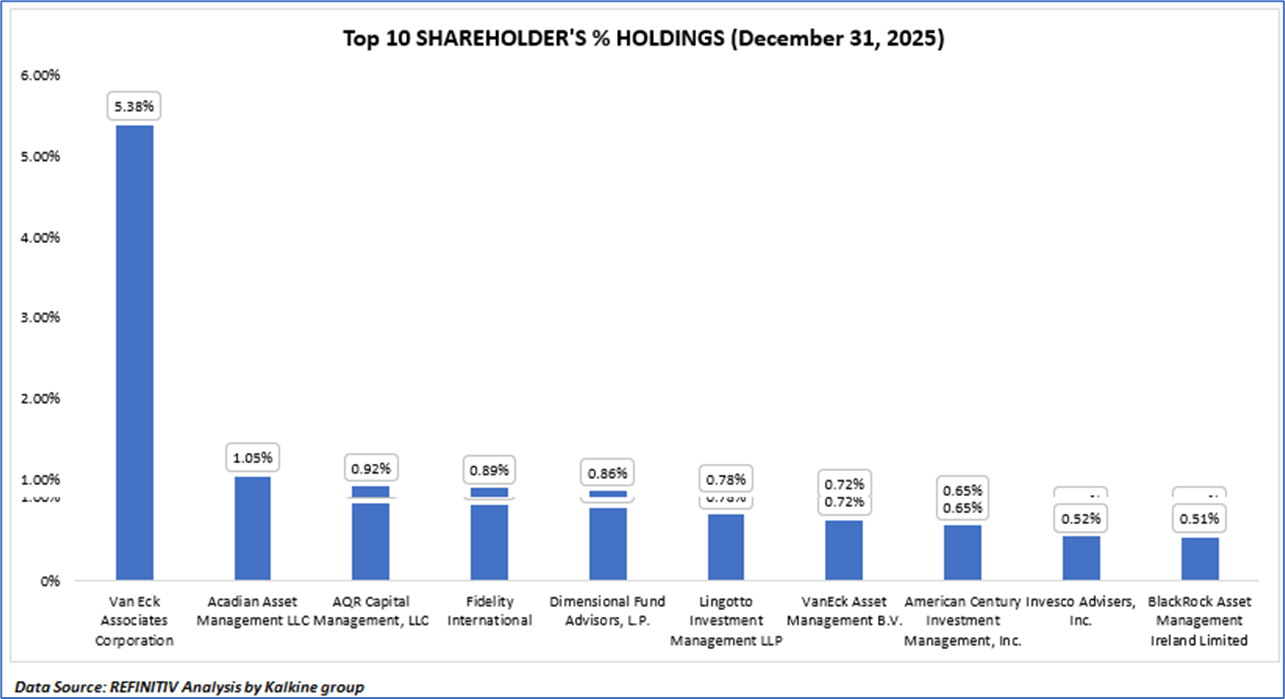
The top 10 shareholders together form ~12.28% of the total shareholding, indicating diverse holding. Van Eck Associates Corporation, and Acadian Asset Management LLC hold a maximum stake in the company at ~5.38% and ~1.05%, respectively.
1.4 Key Metrics:
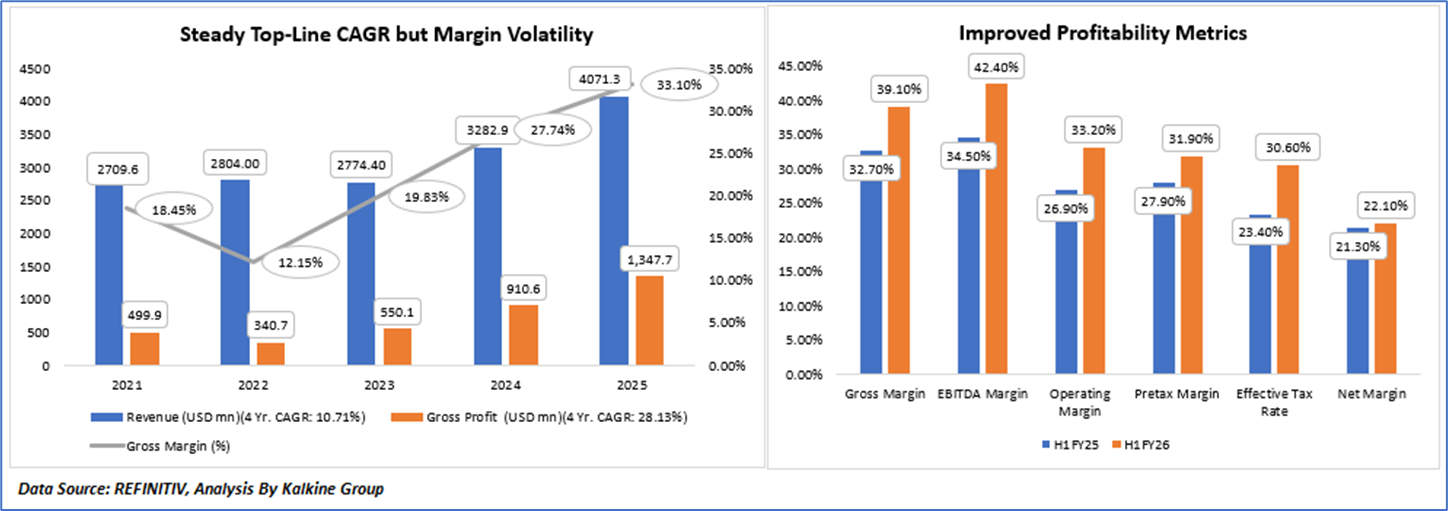
- Revenue Growth and Scale Expansion: Harmony Gold Mining Company Limited (HMY) has demonstrated a steady revenue growth trajectory, with revenue increasing from USD 2,709.6 million in 2021 to USD 4,071.3 million in 2025, reflecting a 4-year CAGR of 10.71%. While revenue remained relatively flat between 2021–2023, the sharp acceleration from USD 2.77 billion in 2023 to USD 4.07 billion in 2025 indicates a strong upswing driven by favorable commodity prices, improved production mix, and operational momentum. This growth highlights the company’s increasing scale and stronger positioning within the gold mining sector.
- Profitability Expansion and Operating Leverage: Gross profit has expanded significantly from USD 499.9 million in 2021 to USD 1,347.7 million in 2025, delivering a robust CAGR of 28.13%, materially outpacing revenue growth. This indicates strong operating leverage, where incremental revenue translates disproportionately into profits. The sharp recovery from the dip in 2022 (USD 340.7 million) to subsequent highs reflects improved operational efficiency, better cost control, and a favorable pricing environment.
- Margin Expansion Reflecting Structural Improvement: Gross margins have improved substantially from 45% in 2021 to 33.10% in 2025, nearly doubling over the period. After a temporary compression to 12.15% in 2022, margins rebounded strongly, supported by higher gold prices, cost optimization, and improved asset quality. This consistent upward trend indicates a structural improvement in profitability, rather than a cyclical spike, positioning HMY as a more efficient and higher-margin producer over time.
- Strong Interim Margin Performance (H1FY26 vs H1FY25): The interim performance further reinforces this trend, with gross margin increasing from 32.70% to 39.10%, and EBITDA margin expanding from 34.50% to 42.40%. Operating margin improved to 20% (from 26.90%), while pretax margin rose to 31.90% (from 27.90%), indicating broad-based margin expansion across all profitability levels. This reflects strong pricing, operational discipline, and improved cost absorption, highlighting enhanced earnings quality in the latest period.
- Net Profitability and Tax Impact Dynamics: Net margin improved modestly from 30% to 22.10%, indicating that bottom-line growth remains resilient despite a higher effective tax rate increase from 23.40% to 30.60%. The rise in taxation has partially offset gains at the operating level; however, the company continues to deliver improved net profitability. Overall, HMY exhibits a high-margin, cash-generative profile, with strong underlying fundamentals supported by both operational efficiency and favorable commodity price dynamics.
Section 2: Business Updates and Financial Highlights
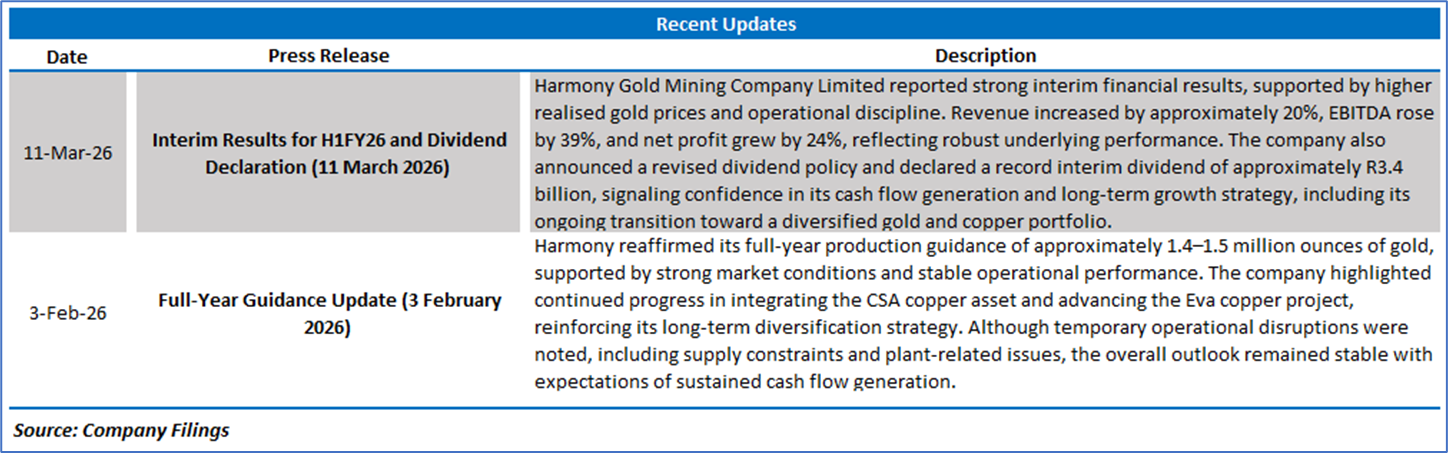
2.1 Recent Updates: The below picture gives an overview of the company’s update on its next reporting date.
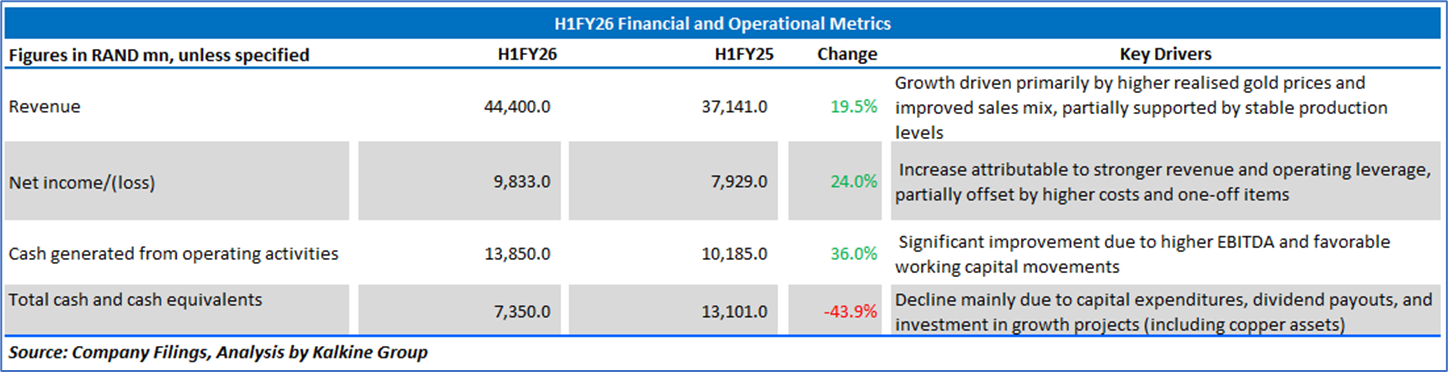
2.2 Insights into H1FY26 Financial Performance:
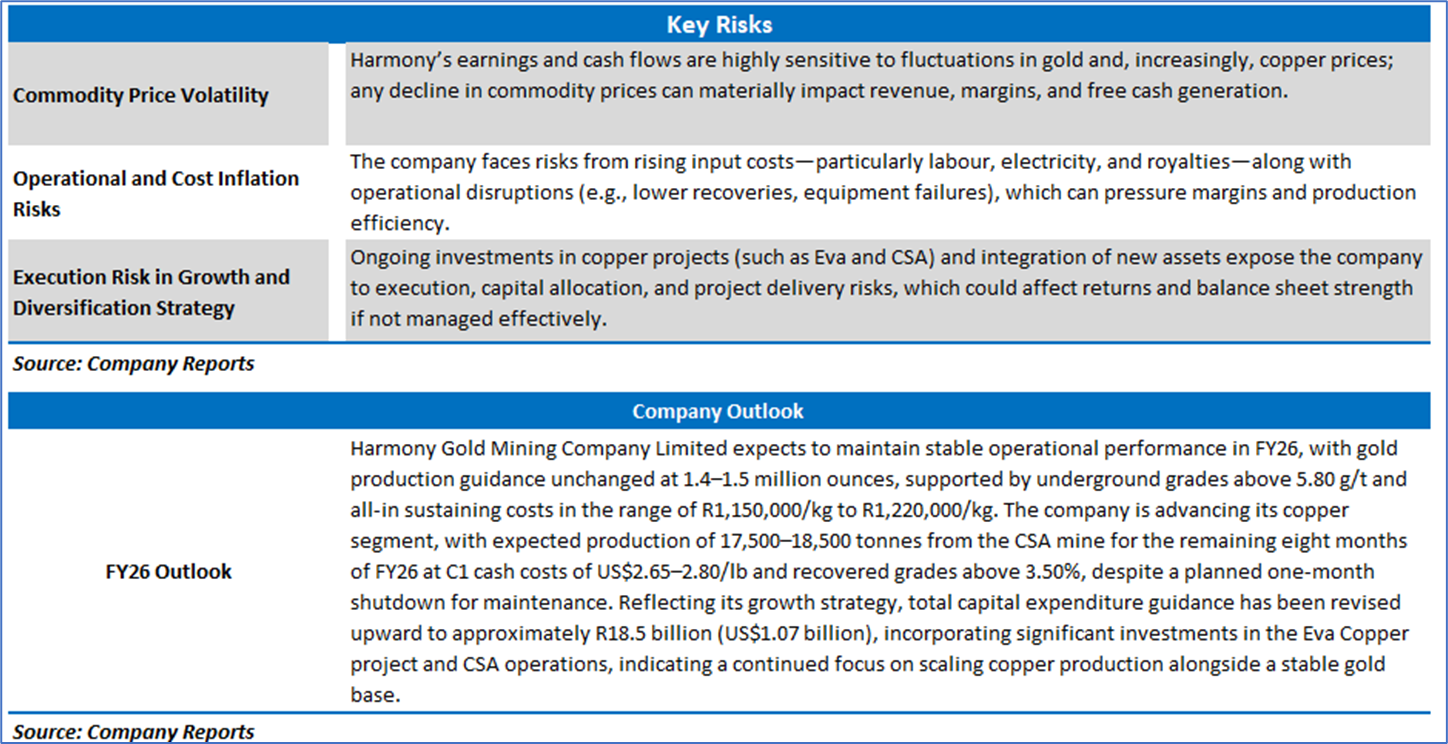
Section 3: Key Risks, Company Outlook:
Section 4: Stock Recommendation Summary:
4.1 Price Performance and Technical Summary:
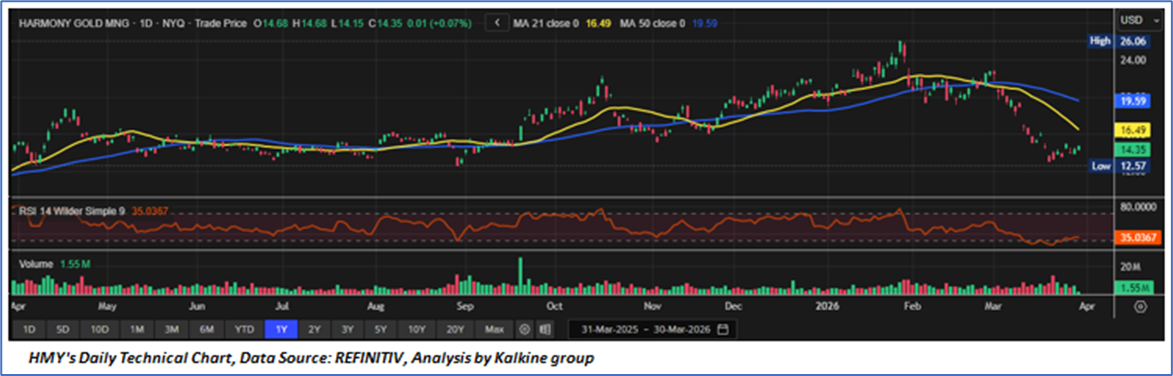
- Trend Structure and Moving Average Dynamics: Harmony Gold Mining Company Limited (HMY) has transitioned from a sustained medium-term uptrend into a corrective consolidation phase, as evidenced by the recent breakdown below both the 21-day (USD ~16.5) and 50-day (USD ~19.6) moving averages. The sharp decline from recent highs near USD 26.0 indicates a loss of bullish momentum, with price currently stabilizing around the USD 14–15 zone, marginally above the recent low of USD ~12.6. The downward crossover and widening gap between short- and medium-term moving averages signal a bearish trend bias in the near term, while the inability to reclaim the 21-day average suggests continued overhead supply and resistance pressure.
- Momentum Indicators and Oscillator Signals: The Relative Strength Index (RSI ~35) reflects a weakening momentum profile, approaching but not yet entering deeply oversold territory. This indicates that while selling pressure has been significant, the stock has not reached exhaustion levels typically associated with strong reversal setups. The gradual flattening of RSI suggests early signs of momentum stabilization, though confirmation of a trend reversal would require a sustained move above the neutral 50 level. Additionally, the absence of bullish divergence at current levels implies that downside risks may persist in the absence of a clear catalyst.
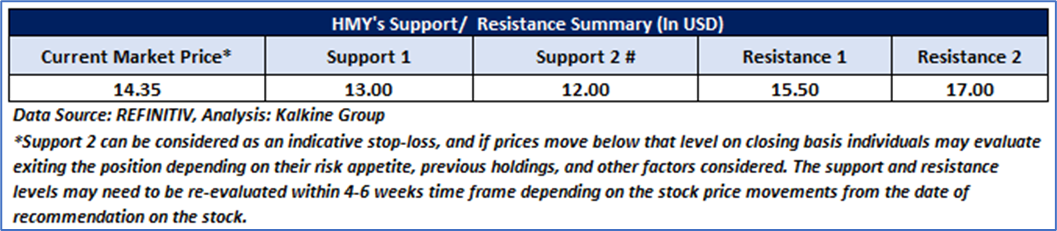
- Volume Behaviour and Support-Resistance Framework: Volume patterns indicate elevated participation during the recent decline, pointing to distribution rather than mere profit booking. The immediate support is positioned near USD 12.5–13.0, a critical level that has recently absorbed selling pressure, while resistance is firmly established in the USD 16.5–19.5 range, corresponding to the 21-day and 50-day moving averages. A decisive breakout above this resistance band would be required to signal trend reversal, whereas a breach below support could expose further downside. Overall, the technical setup suggests a range-bound to weak bias in the short term, with potential for recovery contingent upon reclaiming key moving averages and improving momentum indicators.
4.2 Fundamental Valuation
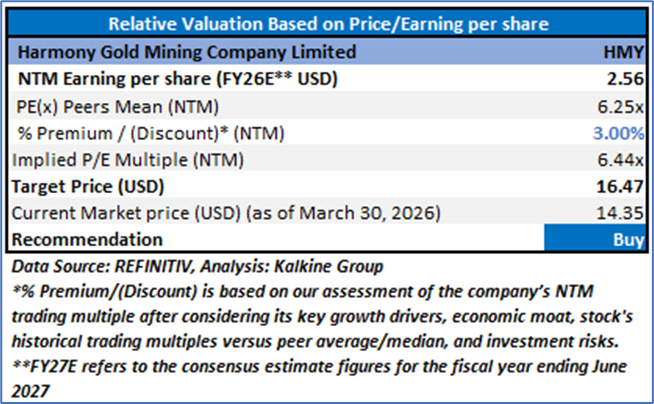
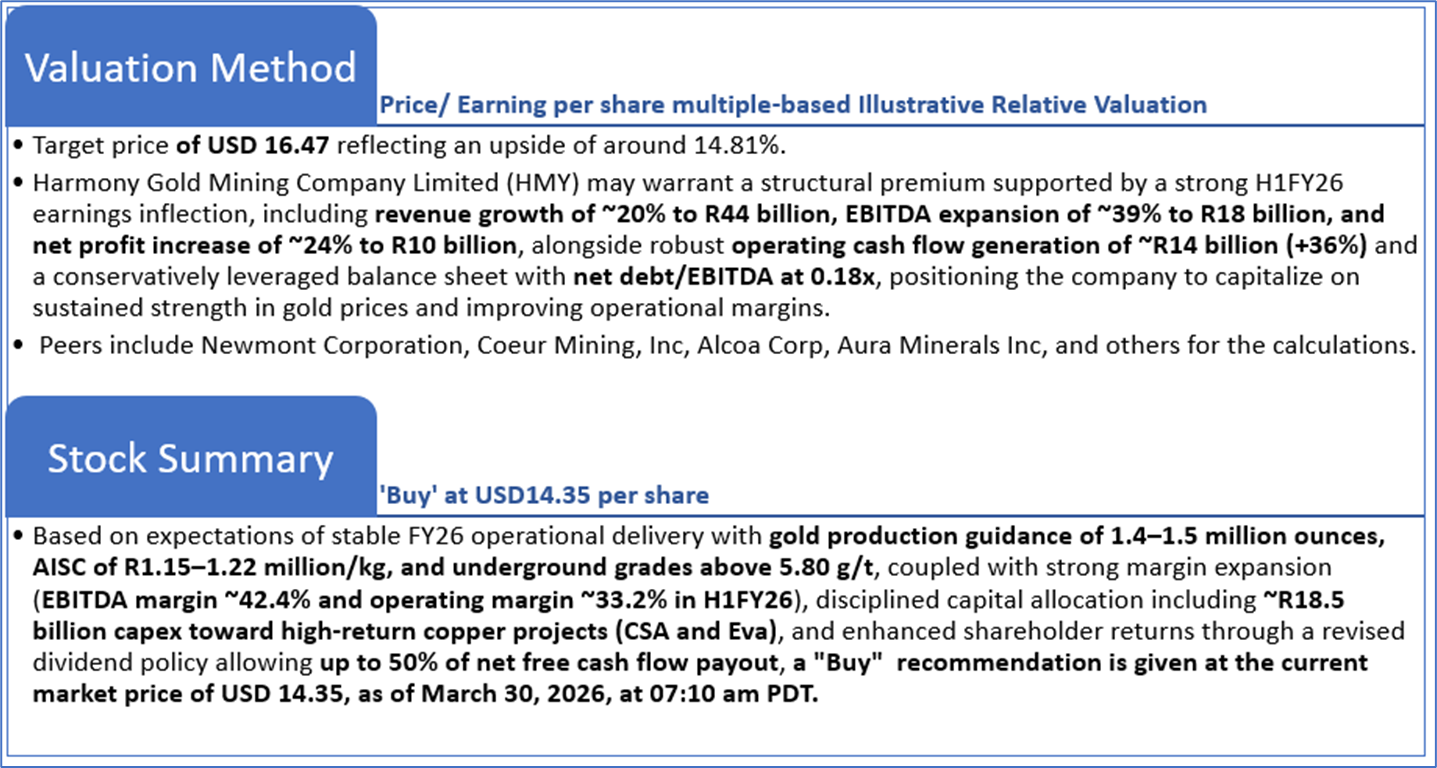
Valuation Methodology: Price/Earnings Per Share Multiple Based Relative Valuation (Illustrative)
Note 1: Past performance is not a reliable indicator of future performance.
Note 2: The reference date for all price data, currency, technical indicators, support, and resistance levels as on March 30, 2026. The reference data in this report has been partly sourced from REFINITIV.
Note 3: Investment decisions should be made depending on an individual's appetite for upside potential, risks, holding duration, and any previous holdings. An 'Exit' from the stock can be considered if the Target Price mentioned as per the Valuation and or the technical levels provided has been achieved and is subject to the factors discussed above.
Note 4: Dividend Yield may vary as per the stock price movement.
Note 5: Kalkine reports are prepared based on the stock prices captured either from REFINITIV or Trading View. Typically, REFINITIV or Trading View may reflect stock prices with a delay which could be a lag of 25-30 minutes. There can be no assurance that future results or events will be consistent with the information provided in the report. The information is subject to change without any prior notice.
Technical Indicators Defined: -
Support: A level at which the stock prices tend to find support if they are falling, and a downtrend may take a pause backed by demand or buying interest.
Resistance: A level at which the stock prices tend to find resistance when they are rising, and the uptrend may take a pause due to profit booking or selling interest.
Stop-loss: In general, it is a level to protect further losses in case of any unfavorable movement in the stock prices.
Past performance is not a reliable indicator of future performance.

 NZ
 UK
 US
 AU
 IND

 CA

 Please wait processing your request...