Section 1: Introduction
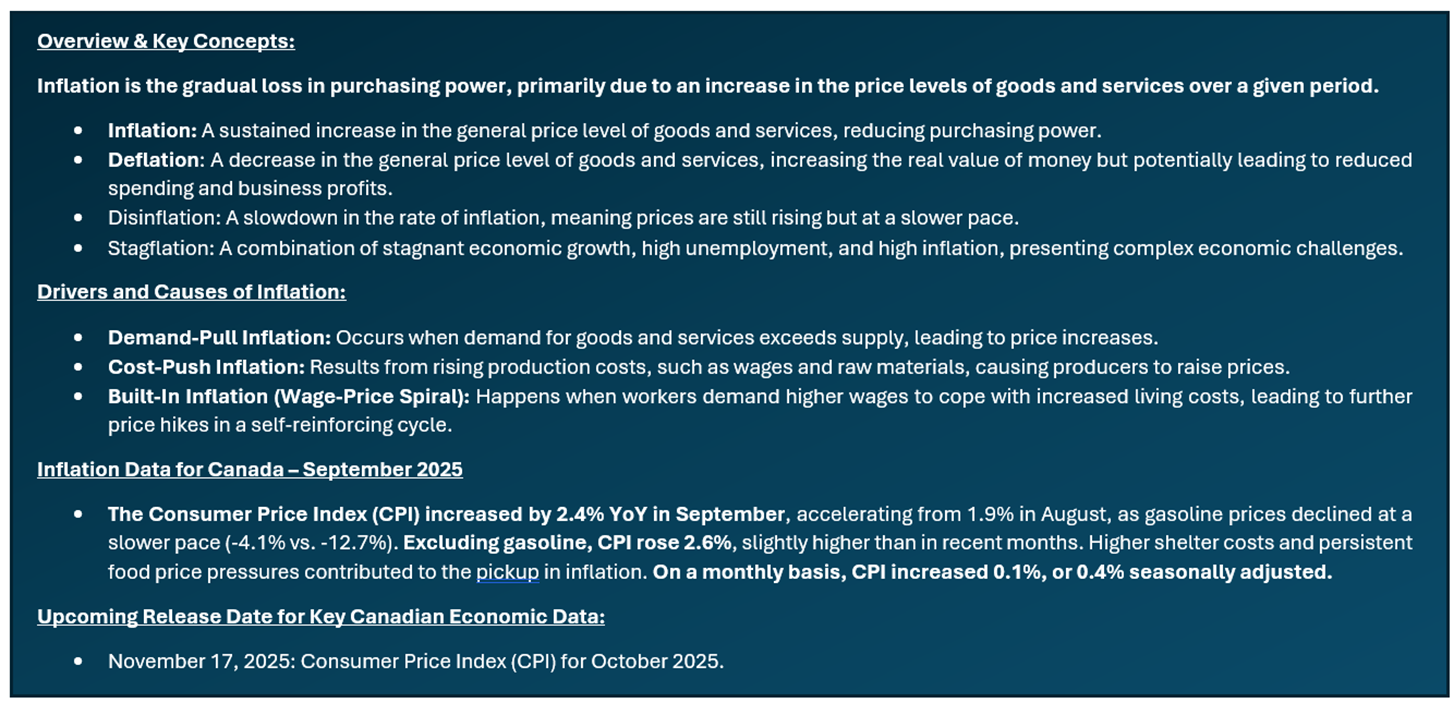
Inflation Report Coverage:
- Inflation report highlights how inflation impacts sectors differently, favoring value and defensive sectors like Energy, Materials, Consumer Staples, Healthcare, Utilities, select Financials, and REITs with inflation-indexed leases, while rate-sensitive sectors like Consumer Discretionary and high-growth Tech typically underperform.
- The report focuses on companies with proven business models, steady financials, high free cash flow, and solid ROE that can pass on costs to customers and protect margins. The aim is to identify stocks that can outperform inflation via capital gains and dividends, supporting diversified sectoral exposure.
Stocks Covered:
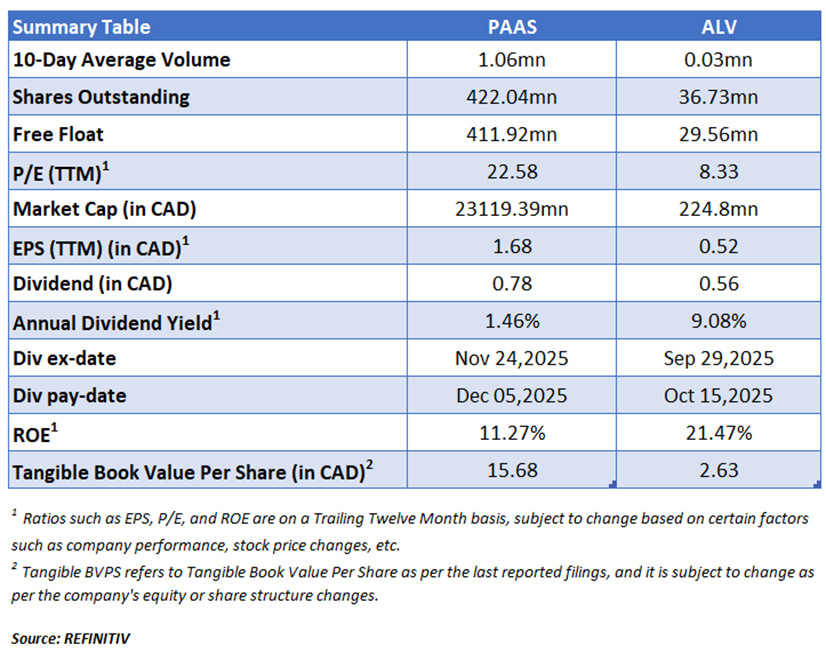
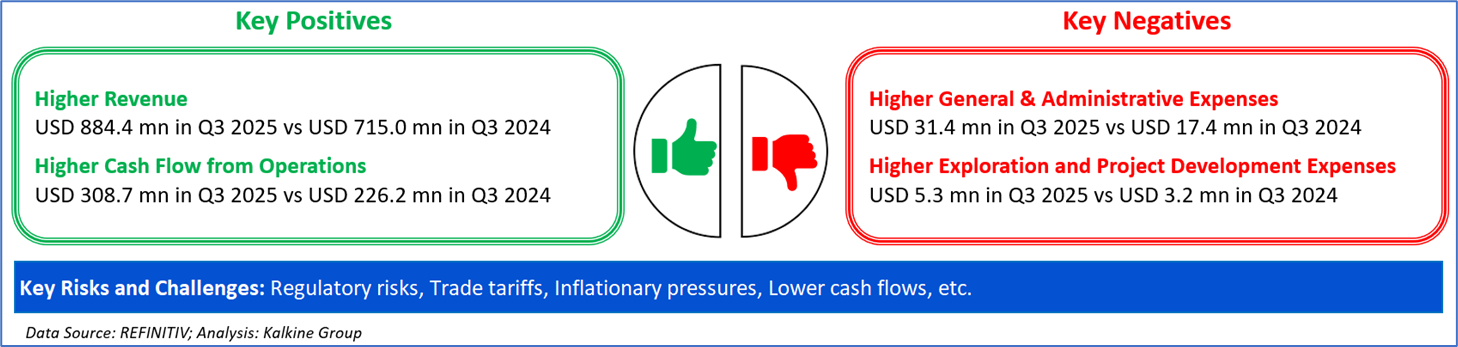
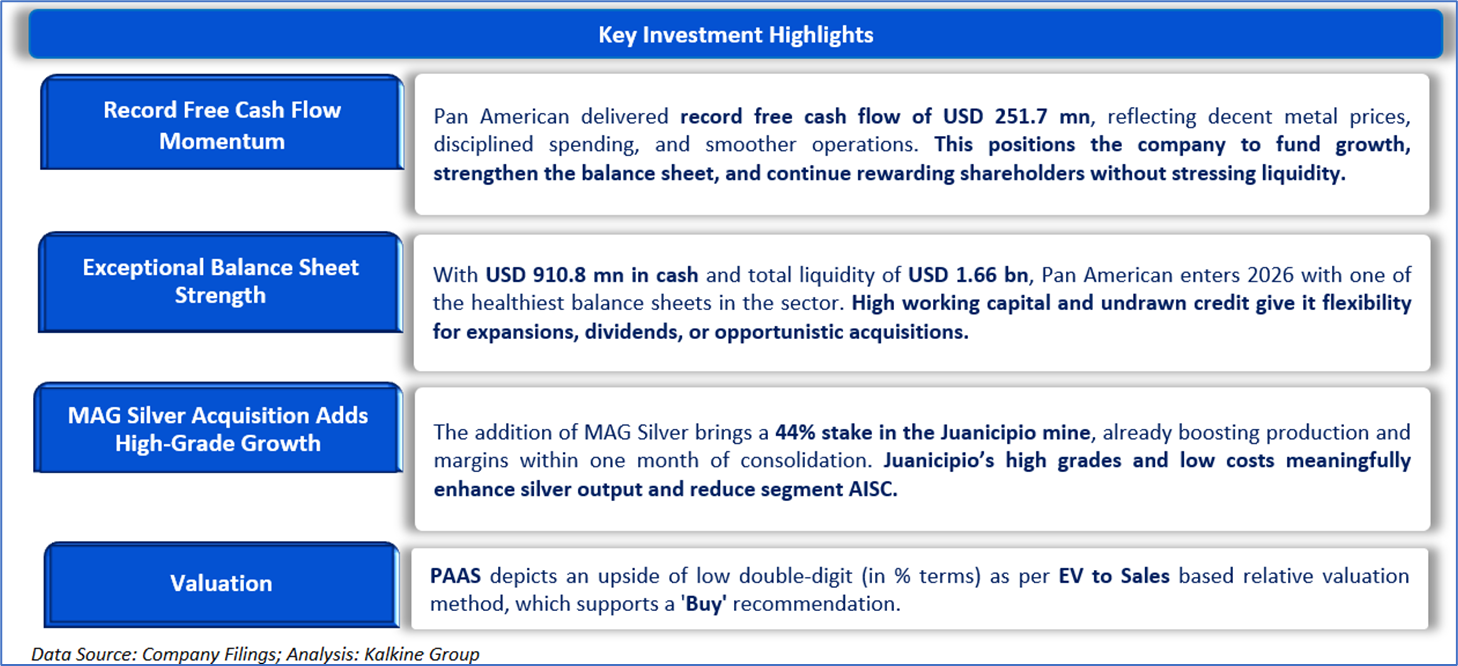
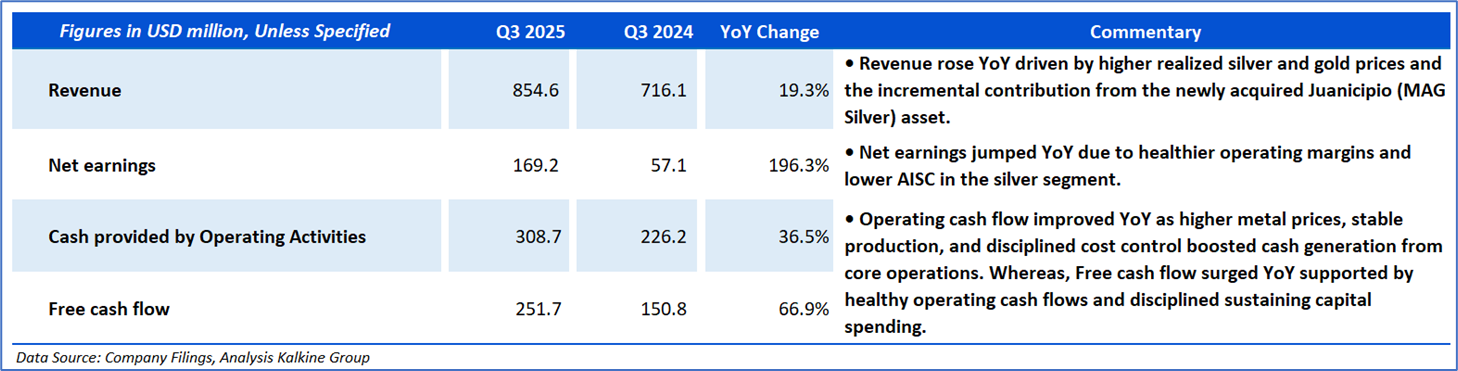
- Pan American Silver Corp. (TSX: PAAS) posted a decent Q3 2025, with revenue up 19.3% to USD 854.6 mn and net earnings surging 196% to USD 169.2 mn. The company delivered robust cash generation, including a 36.5% rise in operating cash flow and a 66.9% jump in free cash flow, supported by higher metal prices, improved margins, and the early contribution from the Juanicipio acquisition.
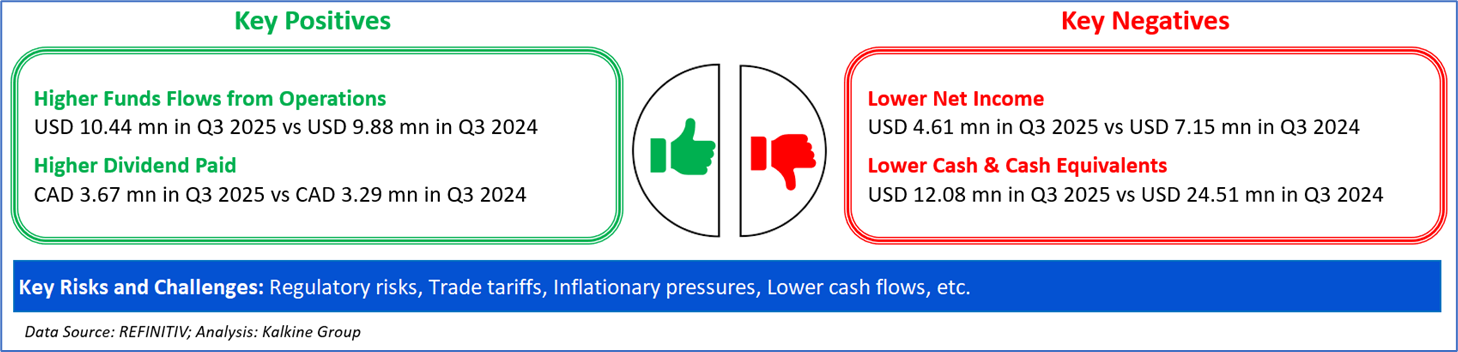
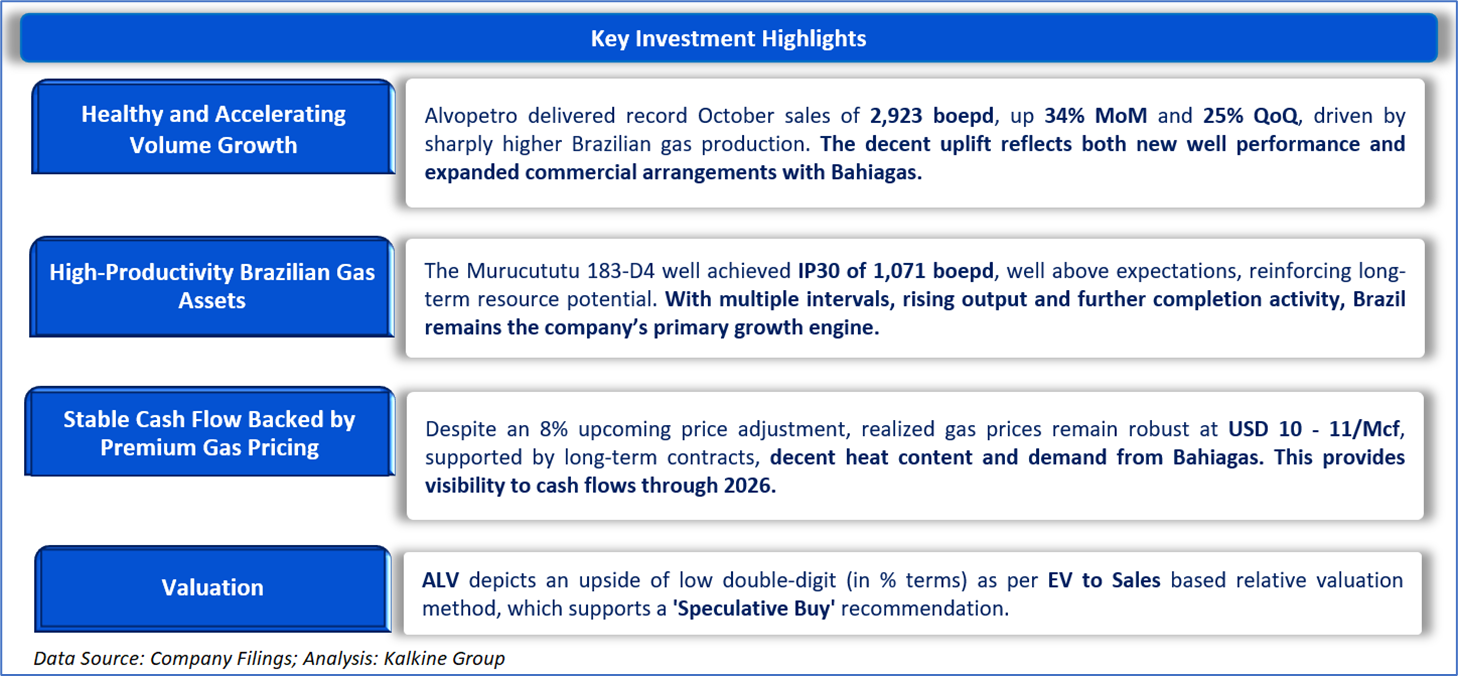
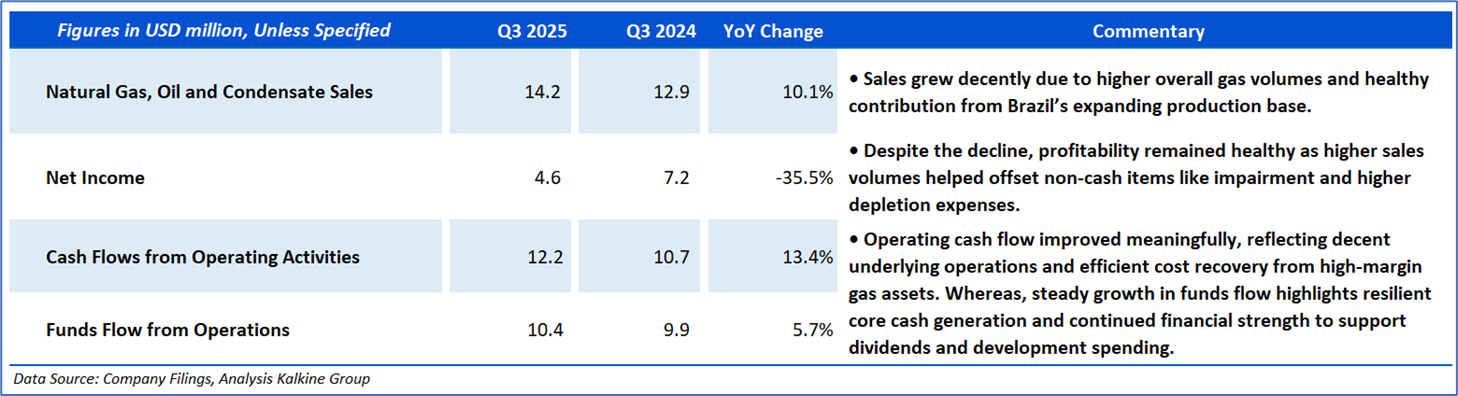
- Alvopetro Energy Ltd. (TSXV: ALV) delivered a decent Q3 2025 performance, with decent revenue growth of 10% YoY and robust cash generation, underscored by record October sales and high-margin Brazilian gas output despite non-cash impacts on net income.
Section 2: Company Overview
Pan American Silver Corp (TSX: PAAS) is a mining company focused exclusively on the exploration and development of silver mines. It produced roughly 22 million ounces of silver in 2011. The company operates primarily in Central and South America. It also sells the byproducts from its silver mining operations, including zinc, lead, copper, and gold. Pan American Silver is based in British Columbia.
Kalkine’s Inflation Report covers the Investment Highlights, Key Financial Metrics, Risks, Technical Analysis along with the Valuation, Target Price, and Recommendation on the stock.

Section3: Financial Highlights

Section 4: Key Metrics
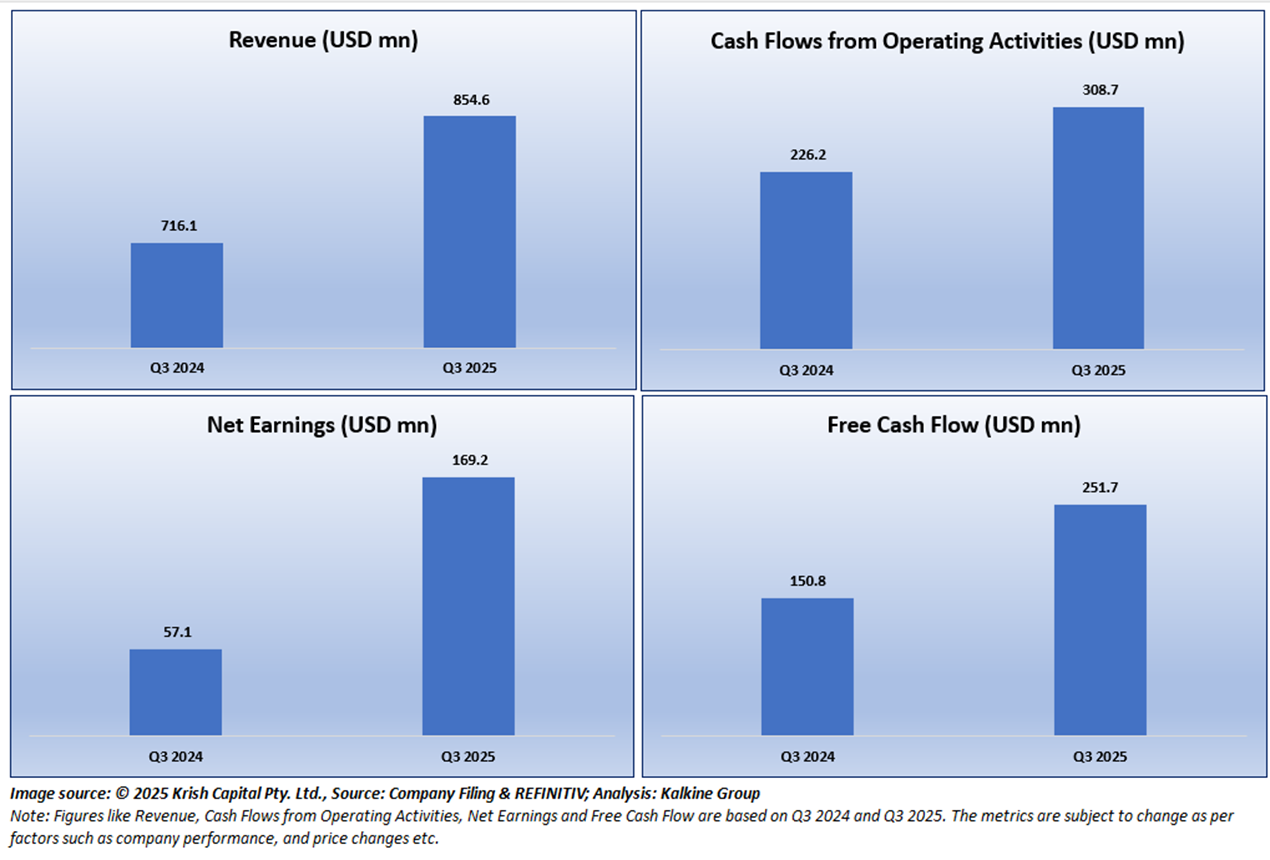
Below chart depicts the change in Revenue, Cash Flows from Operating Activities, Net Earnings and Free Cash Flow are based on Q3 2024 and Q3 2025.
Section 5: Stock Recommendation Summary

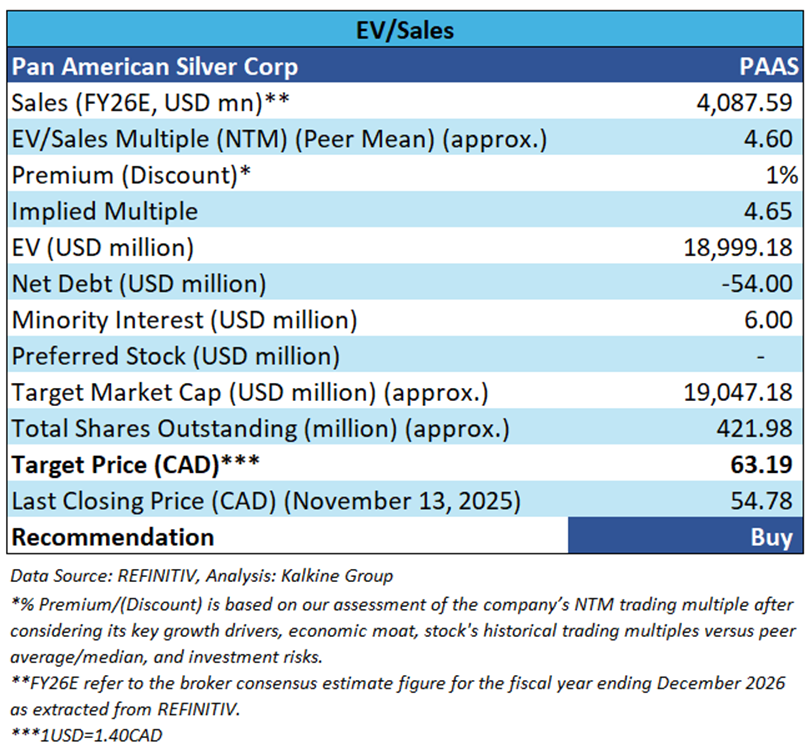
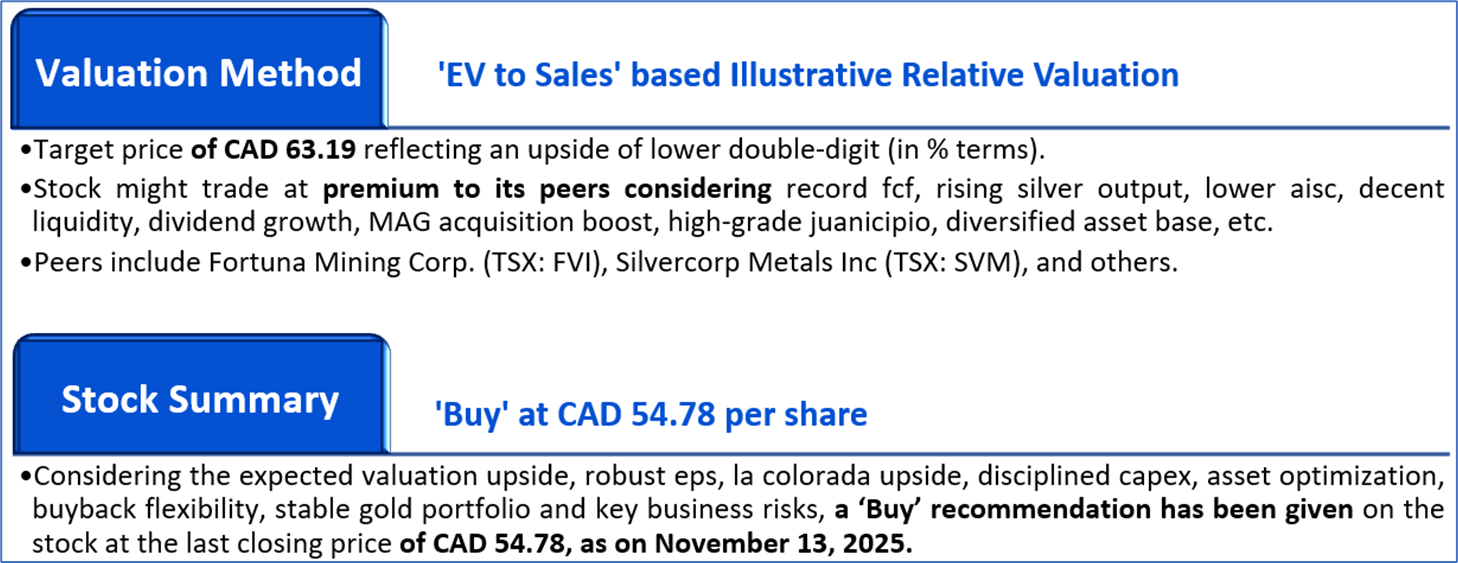
Valuation Methodology: EV to Sales Multiple Based Relative Valuation (Illustrative):


The stock has witnessed an upside of ~14.72% and ~26.16% over the last 1 week and 3 months respectively. Moreover, it is trading above the average 52-week high price of CAD 59.73 and 52-week low price of CAD 28.50, providing an opportunity to ride the trend.

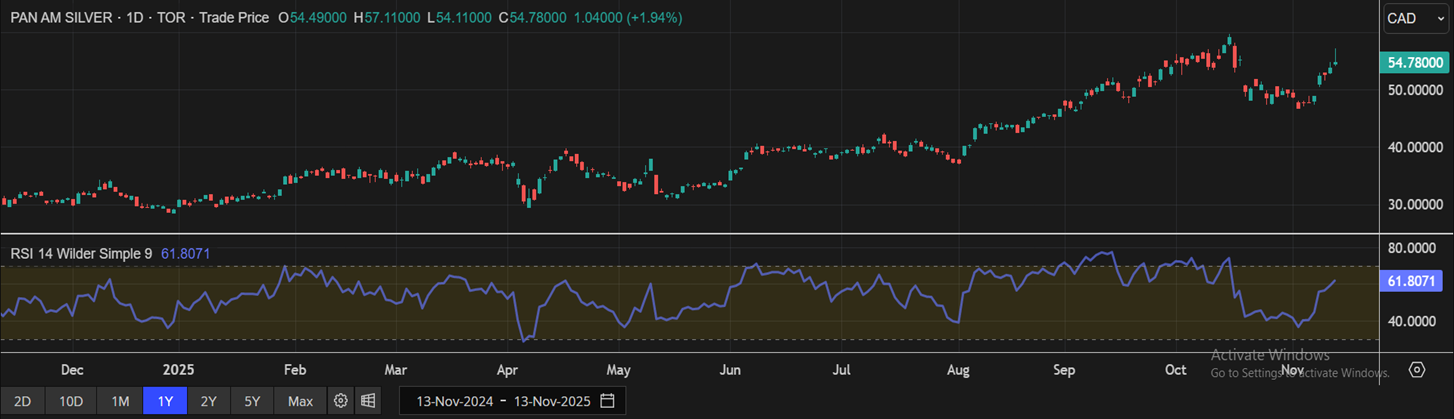
One-Year Technical Price Chart (as of November 13, 2025). Source: REFINITIV, Analysis: Kalkine Group

Section 2: Company Overview
Alvopetro Energy Ltd (TSXV: ALV) is a Canada-based resource company engaged in the exploration, acquisition, development, and production of hydrocarbons in Brazil. It generates revenue from Natural gas, oil, and condensate sales, and all of its revenue is derived from Brazil.
Kalkine’s Inflation Report covers the Investment Highlights, Key Financial Metrics, Risks, Technical Analysis along with the Valuation, Target Price, and Recommendation on the stock.

Section3: Financial Highlights

Section 4: Key Metrics
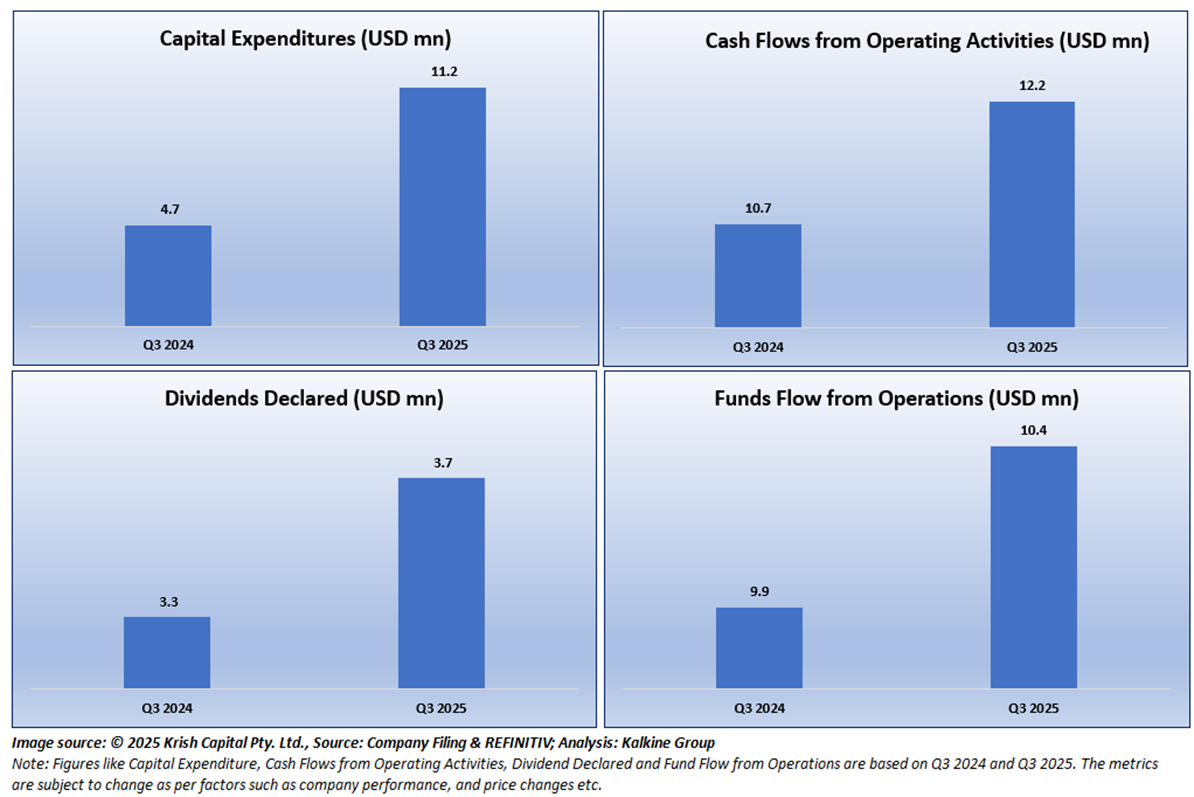
Below chart depicts the changes in Capital Expenditure, Cash Flows from Operating Activities, Dividend Declared and Fund Flow from Operations are based on Q3 2024 and Q3 2025.
Section 5: Stock Recommendation Summary

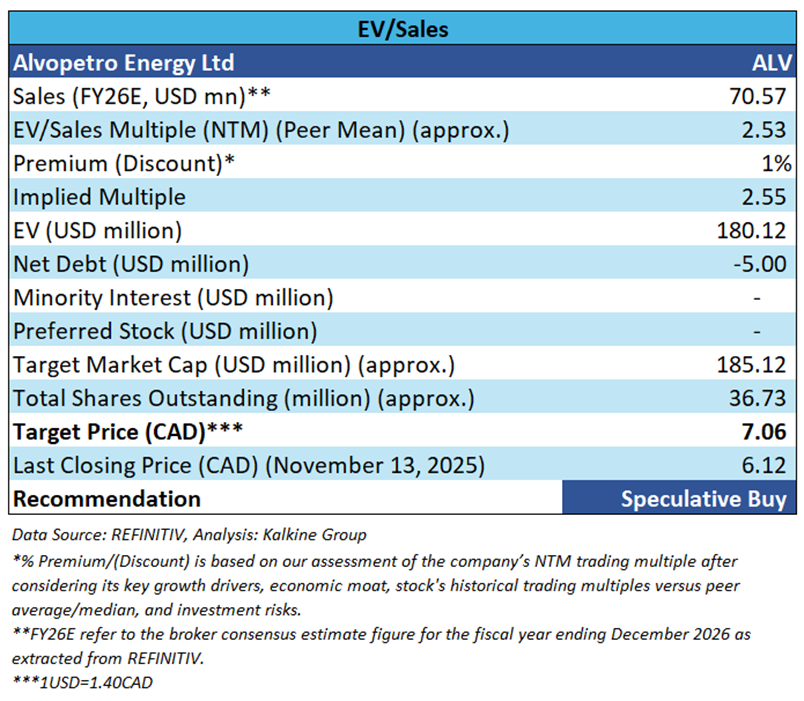
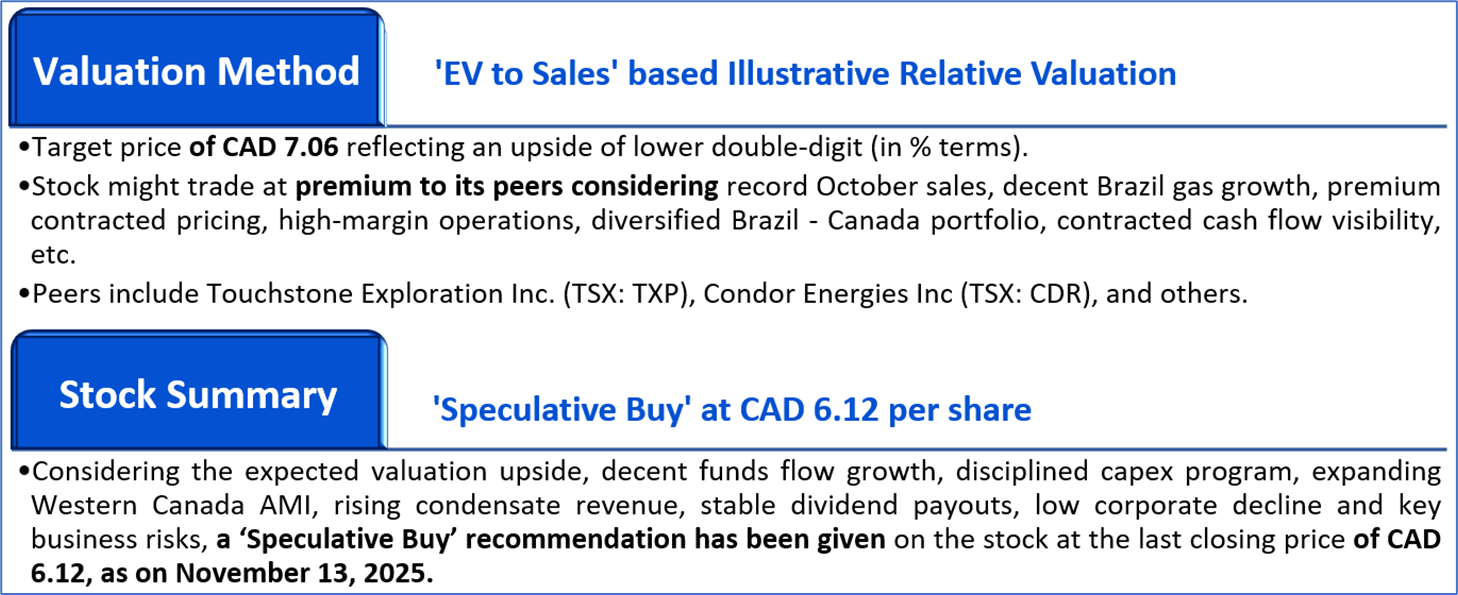
Valuation Methodology: EV to Sales Multiple Based Relative Valuation (Illustrative):


The stock has witnessed a downside of ~0.16% and an upside of ~2.17% over the last 1 week and 6 months respectively. Moreover, it is trading above the average 52-week high price of CAD 7.49 and 52-week low price of CAD 4.24, providing an opportunity to ride the trend.

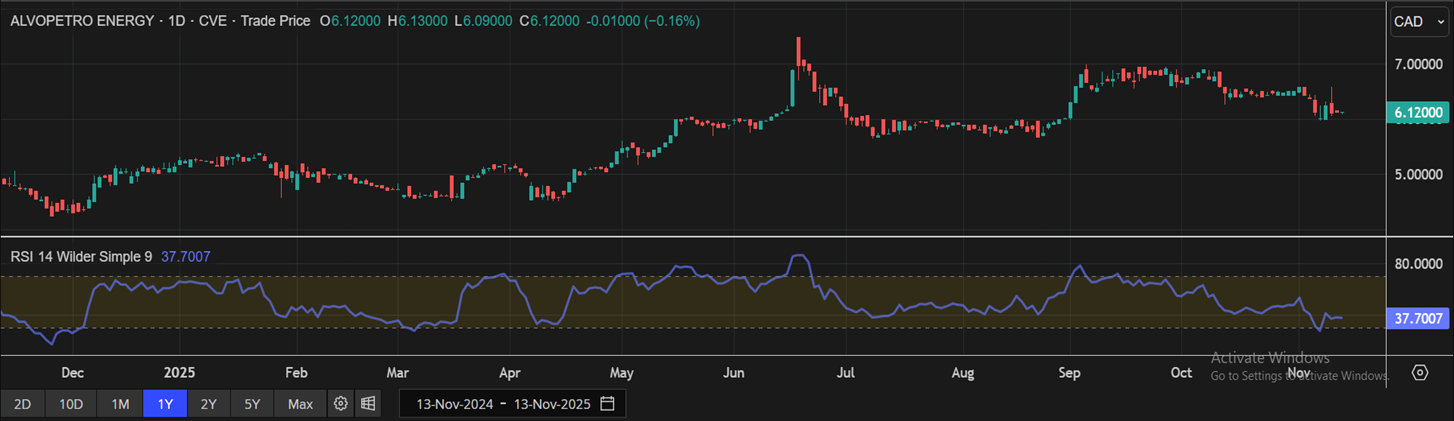
One-Year Technical Price Chart (as of November 13, 2025). Source: REFINITIV, Analysis: Kalkine Group

Note 1: Past performance is not a reliable indicator of future performance.
Note 2: The reference date for all price data, currency, technical indicators, support, and resistance levels is November 13, 2025. The reference data in this report has been partly sourced from REFINITIV.
Note 3: Investment decisions should be made depending on an individual's appetite for upside potential, risks, holding duration, and any previous holdings. An 'Exit' from the stock can be considered if the Target Price mentioned as per the Valuation and or the technical levels provided has been achieved and is subject to the factors discussed above.
Note 4: Dividend Yield may vary as per the stock price movement.
Note 5: Kalkine reports are prepared based on the stock prices captured either from REFINITIV or Trading View. Typically, REFINITIV or Trading View may reflect stock prices with a delay which could be a lag of 25-30 minutes. There can be no assurance that future results or events will be consistent with the information provided in the report. The information is subject to change without any prior notice.
Technical Indicators Defined: -
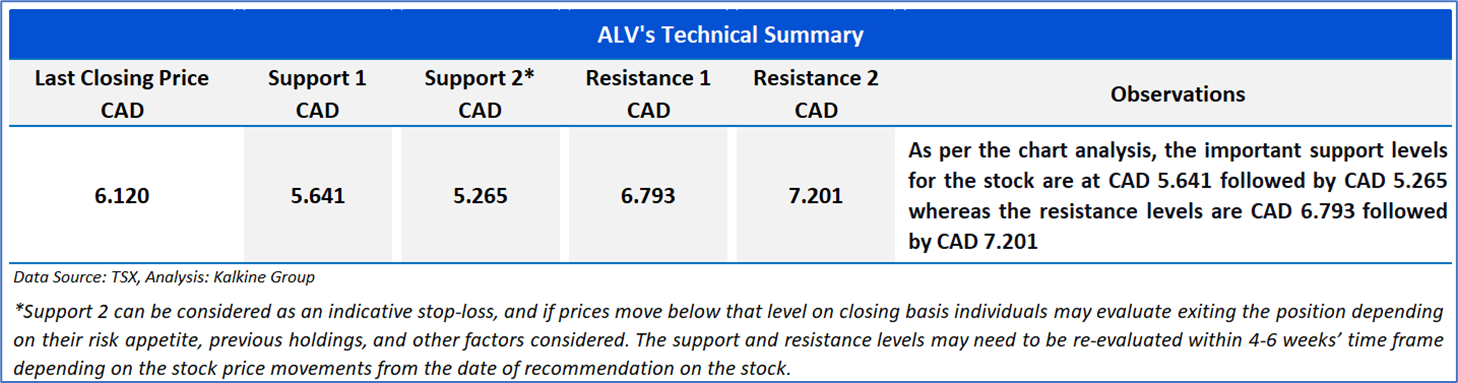
Support: A level at which the stock prices tend to find support if they are falling, and a downtrend may take a pause backed by demand or buying interest.
Resistance: A level at which the stock prices tend to find resistance when they are rising, and the uptrend may take a pause due to profit booking or selling interest.
Stop-loss: In general, it is a level to protect further losses in case of any unfavourable movement in the stock prices.
Past performance is not a reliable indicator of future performance.

 Please wait processing your request...