Section 1: Company Fundamentals
1.1 Company Overview and Performance summary
Company Overview:
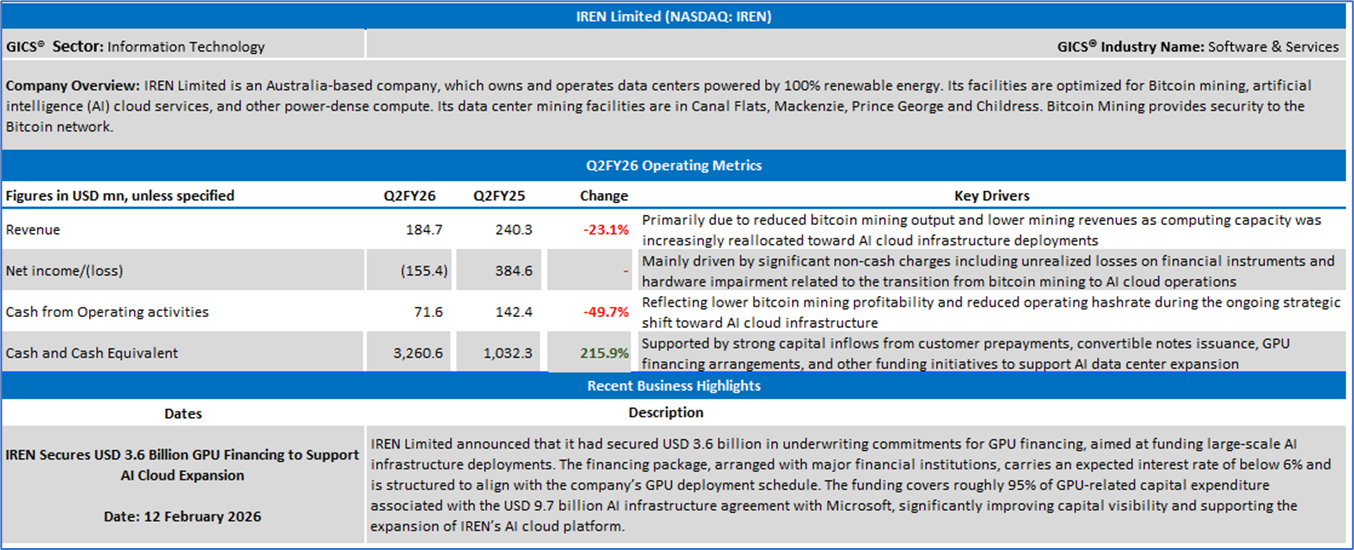
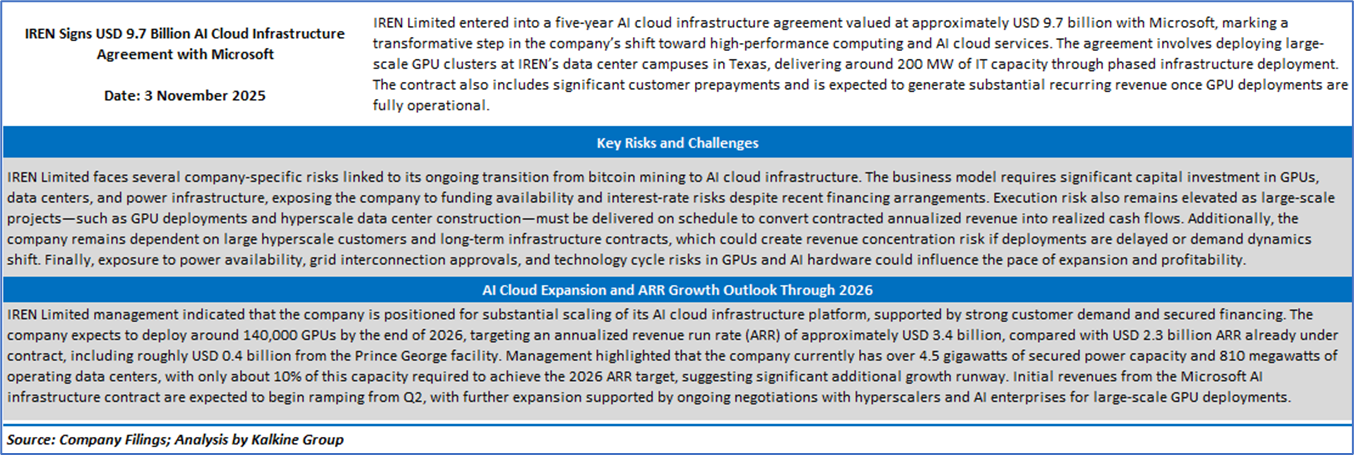
IREN Limited (NASDAQ: IREN) is an Australia-based company, which owns and operates data centers powered by 100% renewable energy. Its facilities are optimized for Bitcoin mining, artificial intelligence (AI) cloud services, and another power-dense compute. Its data center mining facilities are in Canal Flats, Mackenzie, Prince George and Childress. Bitcoin Mining provides security to the Bitcoin network.
This Global AI and Emerging Market Report covers the Company Overview & Price performance, Summary table, Key positives & negatives, Key metrics, Company details, technical guidance & Stock recommendation, and Price chart.
Price Performance & Technical Analysis:
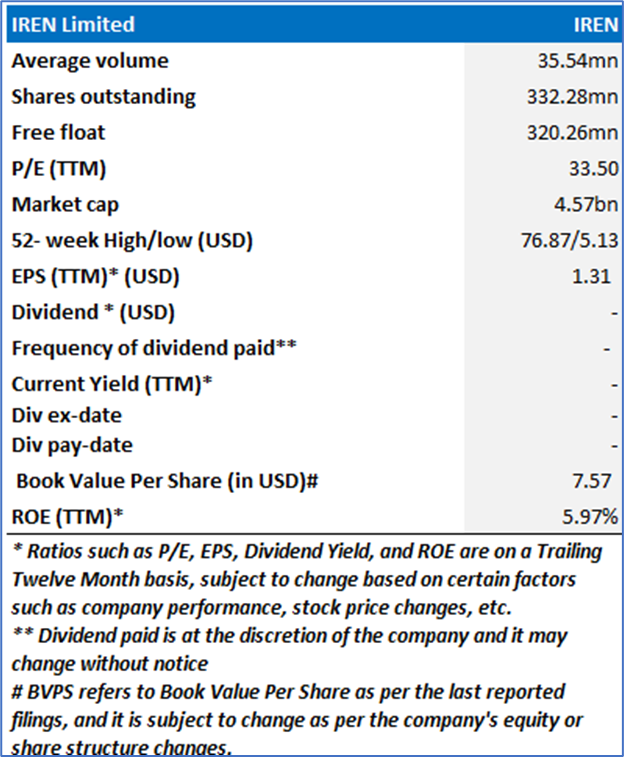
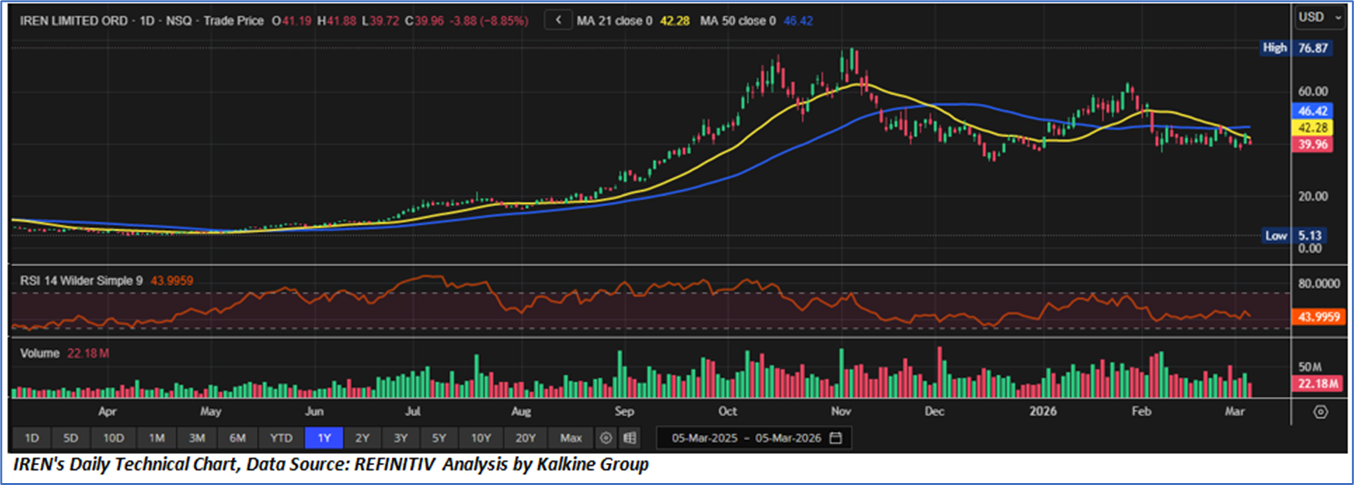
Trend Reversal Signals After Extended Corrective Phase: IREN Limited has transitioned from a strong bullish phase in late 2025 into a prolonged consolidation and corrective structure, with price action currently trading below both the 21-day moving average (~USD 42.28) and the 50-day moving average (~USD 46.42). The downward crossover of short-term momentum relative to the medium-term average suggests a weakening trend structure following the earlier peak near USD 76.87. Sustained trading below these moving averages indicates that market participants remain cautious, with near-term price behaviour reflecting distribution rather than accumulation.
Momentum Indicators Reflect Weak Participation and Neutral Bias: The Relative Strength Index (RSI) is currently positioned around 44, indicating subdued momentum and a lack of directional conviction in the near term. This reading remains below the neutral 50 threshold, implying that bearish pressure continues to outweigh buying momentum, although the indicator has not yet entered deeply oversold territory. Volume patterns also suggest moderate participation rather than capitulation, reinforcing the interpretation that the stock is presently undergoing a stabilization phase rather than a decisive trend reversal.
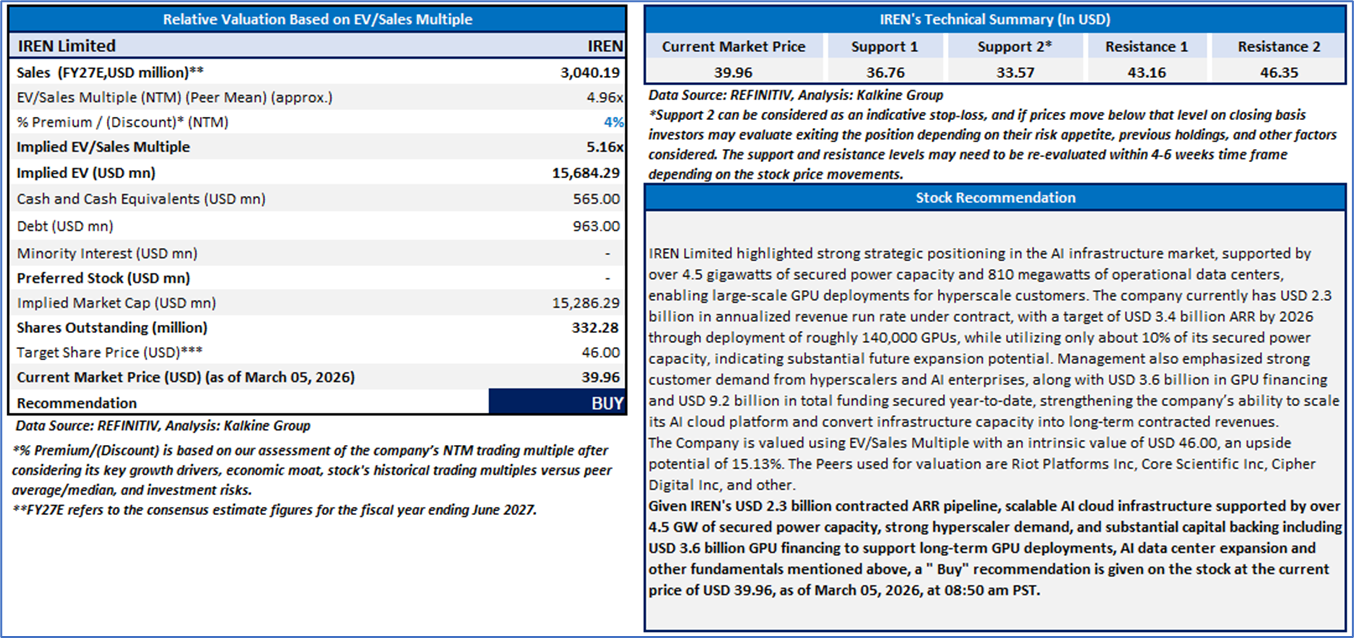
Critical Support and Resistance Levels Define Tactical Outlook: From a structural perspective, immediate resistance is positioned near the 21-day moving average (~USD 42.28), followed by stronger resistance around the 50-day moving average (~USD 46.42), both of which must be reclaimed to restore constructive momentum. On the downside, the recent price zone near USD 39–USD 40 represents the first layer of support, with deeper structural support levels emerging closer to USD 30 should selling pressure intensify. Overall, the technical framework currently reflects a range-bound consolidation within a broader post-rally correction, where confirmation of renewed upside momentum would likely require a decisive recovery above key moving average resistance levels.
1.2 Summary Table
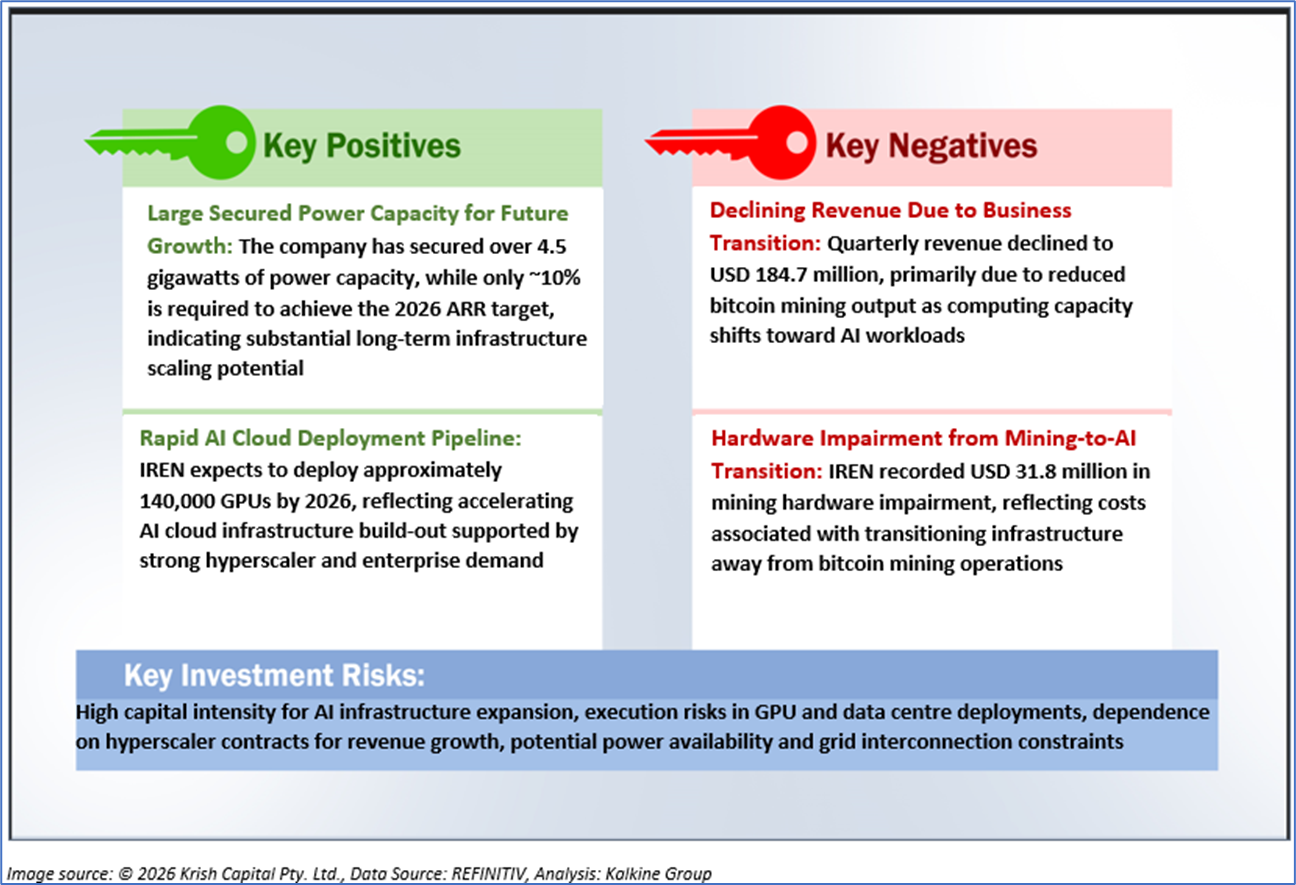
1.3 The Key Positives & Negatives
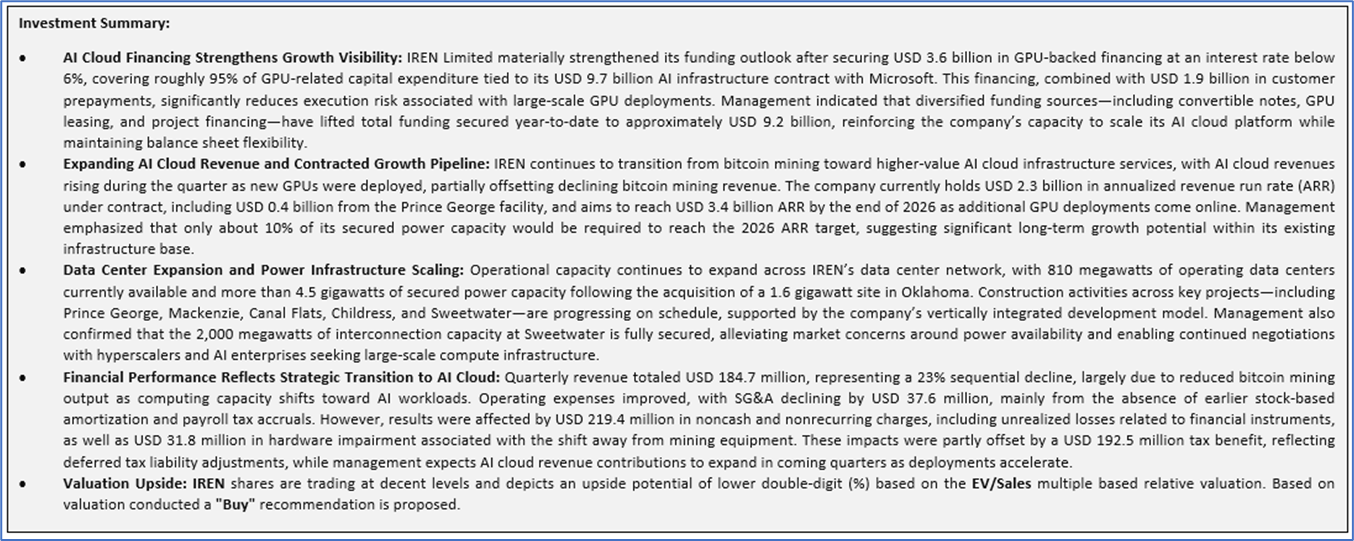
1.3 Key Metrics
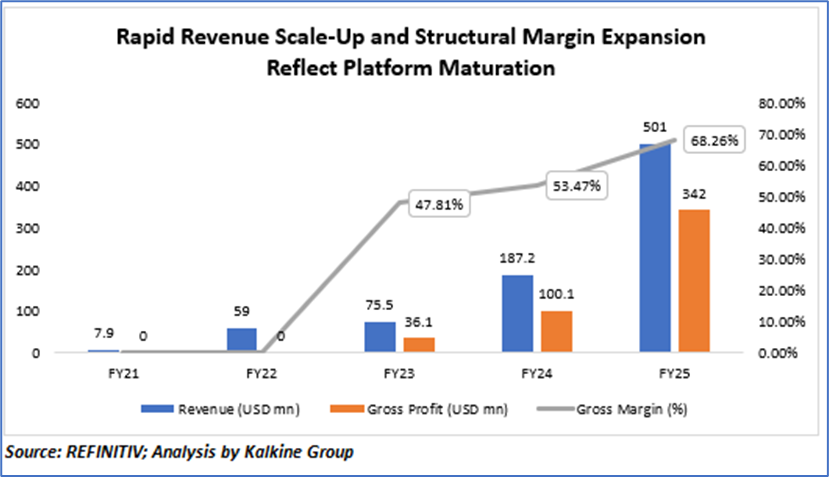
In Q1FY24, LSCC outperformed industry medians across key financial metrics. Specifically, LSCC reported higher gross margin (68.3% vs. industry median of 53.50%), EBITDA margin (19.5% vs. industry median of 18%), operating margin (11.8% vs. industry median of 10.00%), pretax margin (12.7% vs. industry median of 10.20%), and net margin (10.5% vs. industry median of 8.3%). Additionally, LSCC demonstrated a superior return on equity (ROE) at 2.20%, surpassing the industry median of 1.80%. These results underscore LSCC's strong financial performance relative to industry benchmarks during the first quarter of fiscal year 2024.
Section 2: IREN Limited (NASDAQ: IREN) (" Buy" at the current price of USD 39.96, as of March 05, 2026, at 08:50 am PST)
2.1 Company Details
2.2 Technical Guidance and Stock Recommendation
Markets are trading in a highly volatile zone currently due to certain macroeconomic issues and geopolitical tensions prevailing. Therefore, it is prudent to follow a cautious approach while investing.
Note 1: Past performance is not a reliable indicator of future performance.
Note 2: The reference date for all price data, currency, technical indicators, support, and resistance levels is March 05, 2026. The reference data in this report has been partly sourced from REFINITIV.
Note 3: Investment decisions should be made depending on an individual's appetite for upside potential, risks, holding duration, and any previous holdings. An 'Exit' from the stock can be considered if the Target Price mentioned as per the Valuation and or the technical levels provided has been achieved and is subject to the factors discussed above.
Note 4: The report publishing date is as per the Pacific Time Zone.
Technical Indicators Defined: -
Support: A level at which the stock prices tend to find support if they are falling, and a downtrend may take a pause backed by demand or buying interest. Support 1 refers to the nearby support level for the stock and if the price breaches the level, then Support 2 may act as the crucial support level for the stock.
Resistance: A level at which the stocks prices tend to find resistance when they are rising, and an uptrend may take a pause due to profit booking or selling interest. Resistance 1 refers to the nearby resistance level for the stock and if the price surpasses the level, then Resistance 2 may act as the crucial resistance level for the stock.
Stop-loss: It is a level to protect against further losses in case of unfavorable movement in the stock prices.
Past performance is not a reliable indicator of future performance.

 NZ
 UK
 US
 AU
 IND

 CA

 Please wait processing your request...