Section 1: Company Fundamentals
1.1 Company Overview and Performance summary
Company Overview:
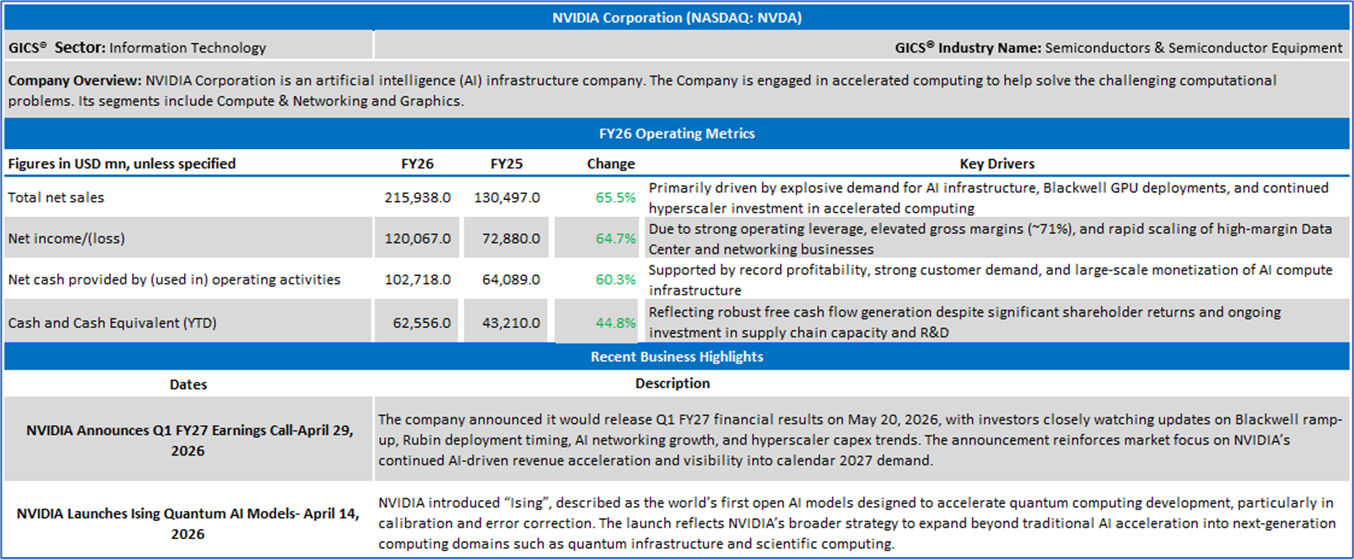
NVIDIA Corporation (NASDAQ: NVDA) is an artificial intelligence (AI) infrastructure company. The Company is engaged in accelerated computing to help solve the challenging computational problems. Its segments include Compute & Networking and Graphics.
This Global AI and Emerging Market Report covers the Company Overview & Price performance, Summary table, Key positives & negatives, Key metrics, Company details, technical guidance & Stock recommendation, and Price chart.
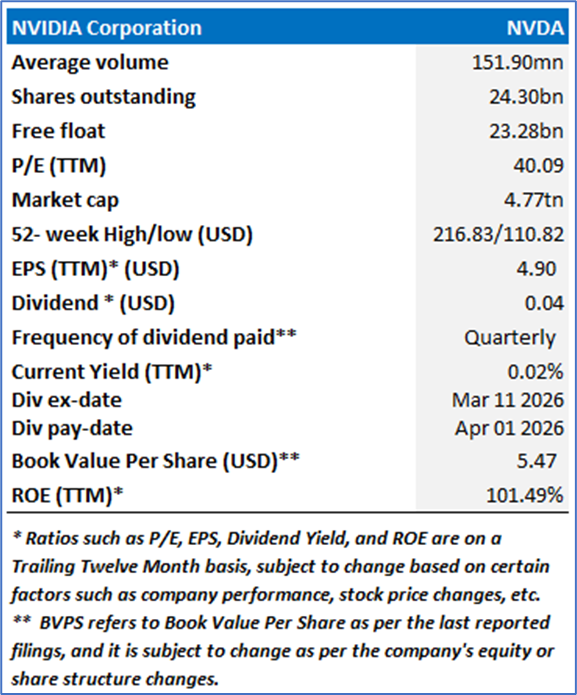
1.2 Summary Table
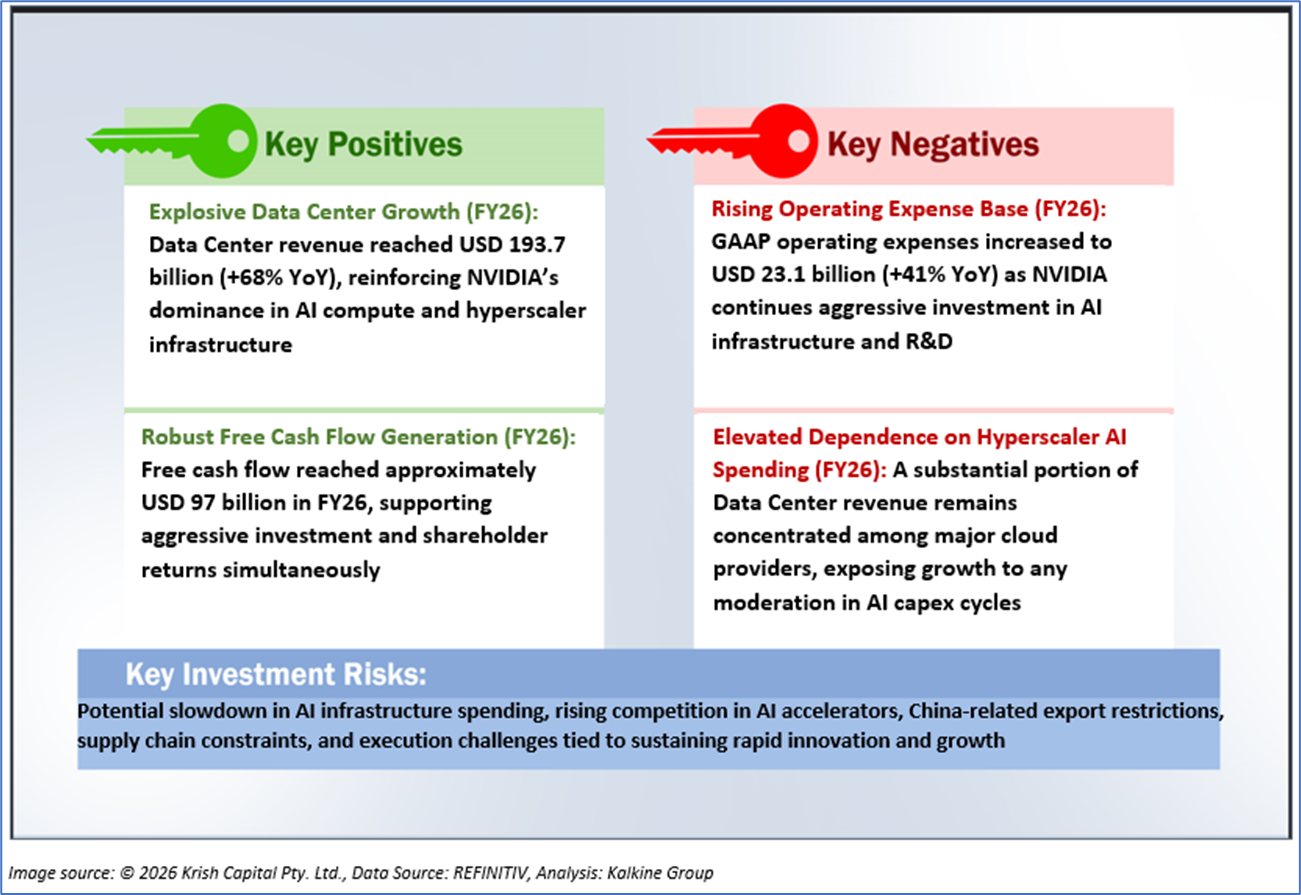
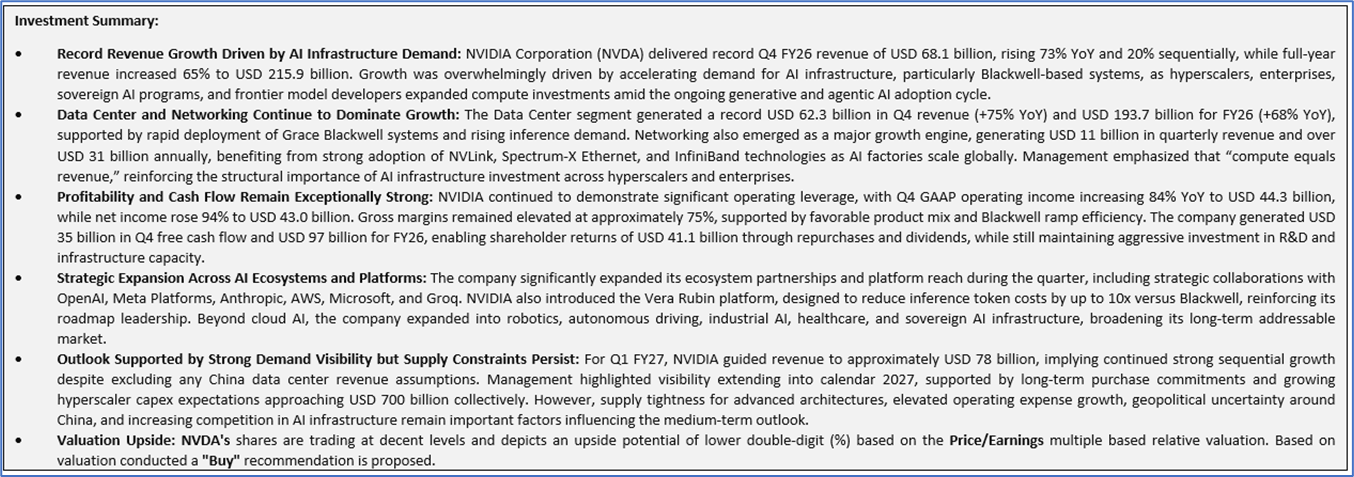
1.3 The Key Positives & Negatives
1.4 Key metrics
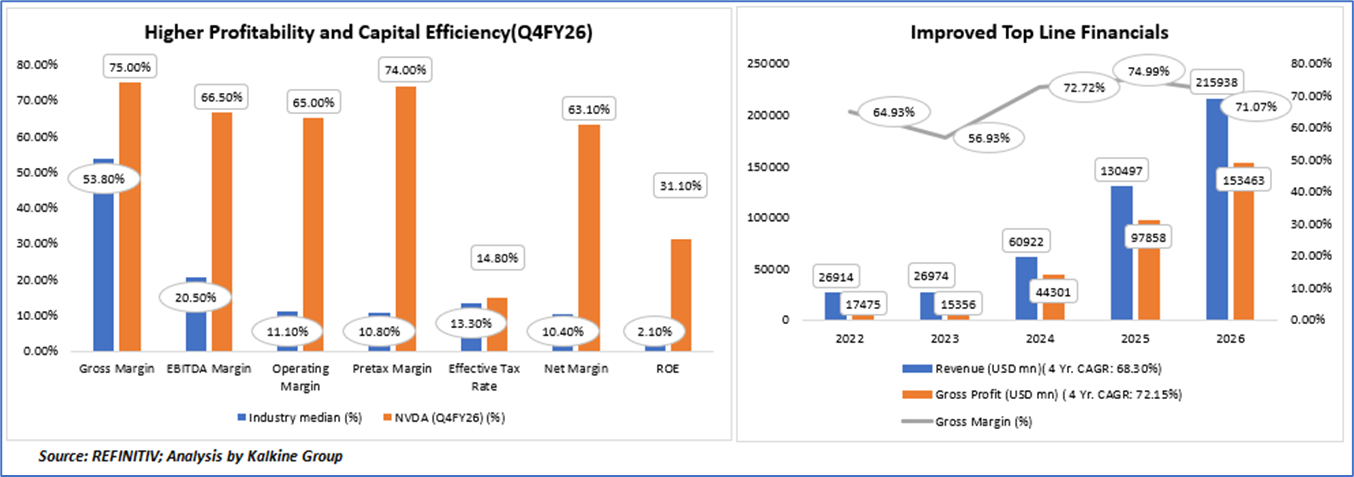
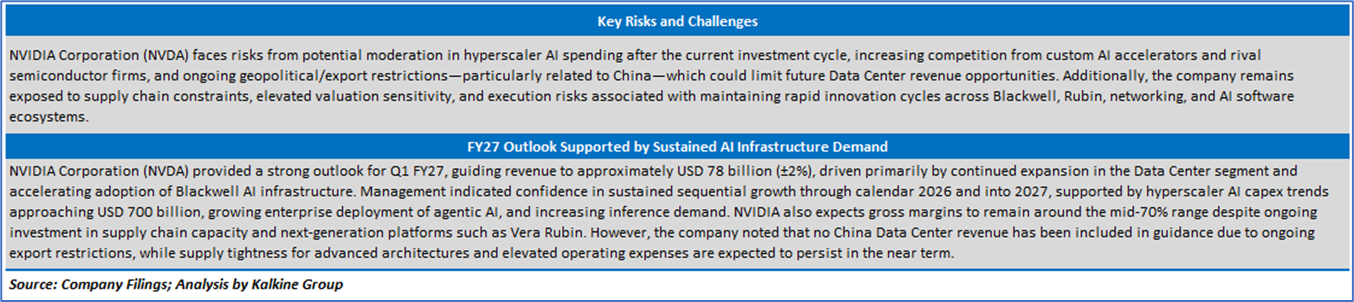
- Revenue Growth Reflects Exceptional AI-Driven Scaling: NVIDIA Corporation (NVDA) has demonstrated extraordinary top-line expansion, with revenue increasing from approximately USD 26.9 billion in FY22 to USD 215.9 billion in FY26, representing a strong 4-year CAGR of ~68.3%. The acceleration became particularly pronounced from FY24 onward, driven by explosive adoption of AI infrastructure, accelerated computing, and hyperscaler demand for Blackwell and Hopper GPU platforms. This growth trajectory significantly outpaces the broader semiconductor industry and highlights NVIDIA’s dominant positioning in generative AI and data center compute markets.
- Gross Profit Expansion and Strong Margin Structure: Gross profit expanded substantially from USD 17.5 billion in FY22 to USD 153.5 billion in FY26, reflecting a robust 4-year CAGR of ~72.2%. Gross margins improved materially from 9% in FY23 to nearly 75.0% in FY25, before moderating slightly to 71.1% in FY26, indicating strong pricing power and favorable product mix despite scaling costs and supply chain investments. Importantly, NVDA’s Q4 FY26 gross margin of 75.0% remains significantly above the industry median of 53.8%, underscoring superior economics and high-value AI product concentration.
- Industry-Leading Profitability Metrics: NVIDIA’s profitability profile remains substantially stronger than industry averages across nearly all key metrics. Q4 FY26 EBITDA margin stood at 5% versus industry median of 20.5%, while operating margin reached 65.0% compared to 11.1% for peers. Similarly, pretax margin of 74.0% and net margin of 63.1% dramatically exceed broader industry levels, reflecting exceptional operating leverage, software ecosystem monetization, and AI accelerator dominance. These margins highlight NVIDIA’s ability to convert revenue growth into disproportionately higher earnings and cash flow generation.
- Efficient Capital Utilization and Shareholder Value Creation: Return on equity (ROE) of 1% significantly exceeds the industry median of 2.1%, indicating highly efficient capital deployment and strong shareholder value creation. Despite aggressive investment in R&D, networking, AI infrastructure, and ecosystem expansion, the company continues to generate substantial returns on invested capital. Additionally, NVIDIA has maintained disciplined capital allocation through large-scale buybacks and dividends while preserving a strong liquidity position and funding long-term growth initiatives.
- Balanced Tax Structure and Financial Sustainability: NVIDIA’s effective tax rate of 8% remains relatively aligned with the industry median of 13.3%, suggesting that the company’s outsized profitability is fundamentally operational rather than tax-driven. The combination of high margins, accelerating revenue growth, robust free cash flow generation, and strong balance sheet liquidity supports financial sustainability even amid elevated AI infrastructure investment cycles. However, sustaining these exceptional profitability levels over the long term may depend on continued innovation leadership, supply chain execution, and hyperscaler AI spending momentum.
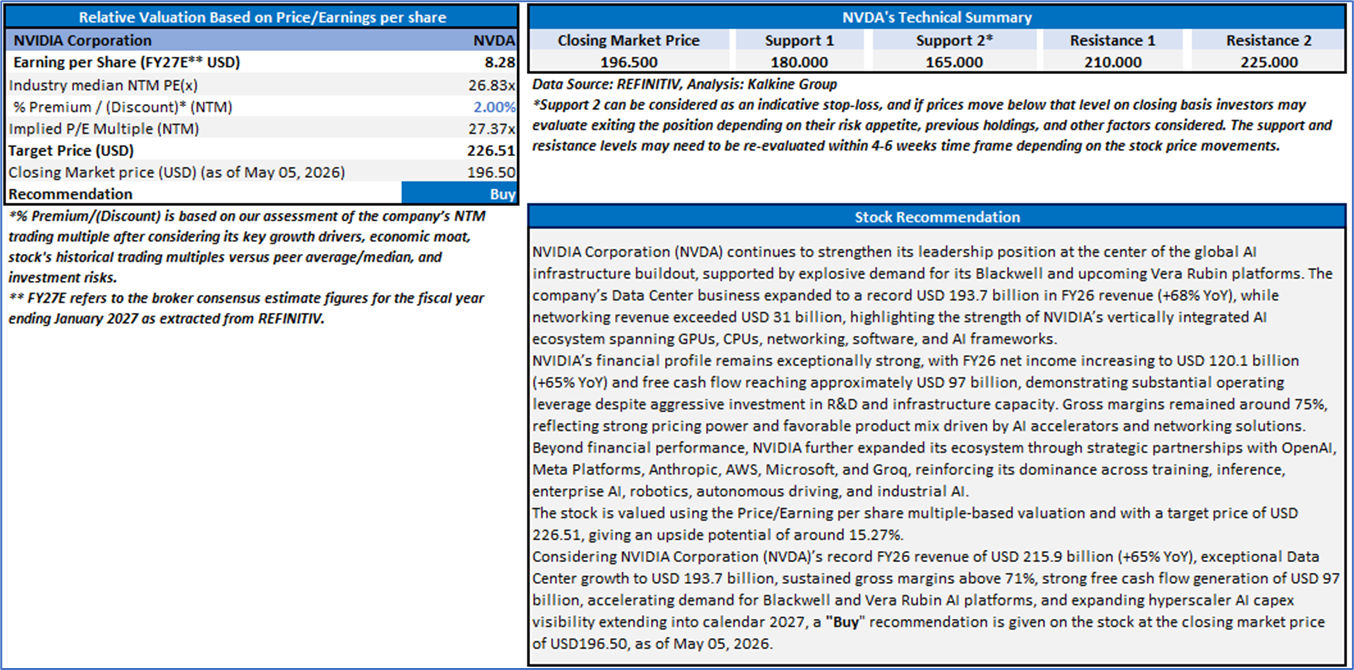
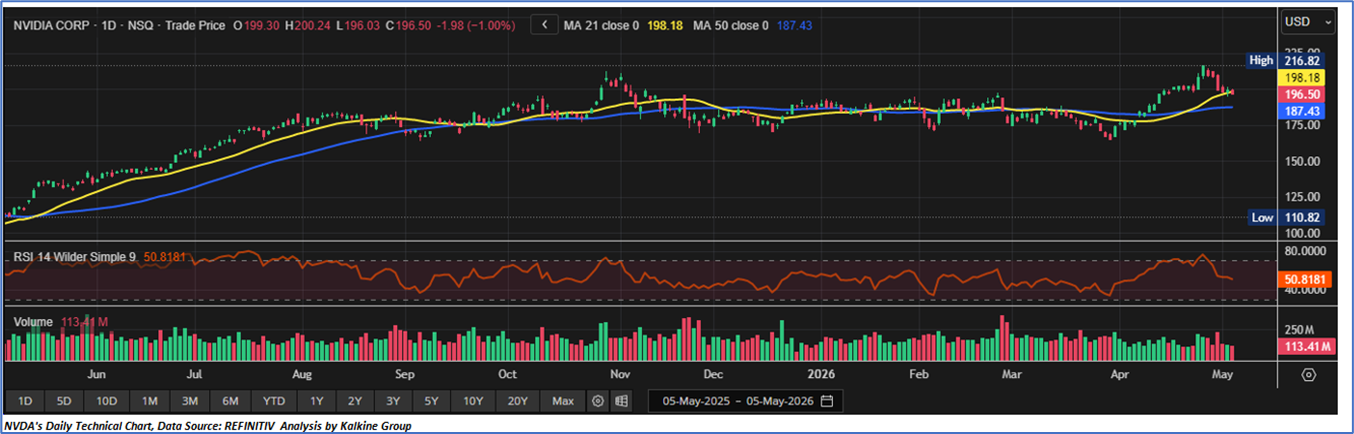
Section 2: NVIDIA Corporation (NASDAQ: NVDA) (“Buy” at the closing market price of USD 196.50, as of May 05, 2026)
2.1 Company Details
2.2 Technical Guidance and Stock Recommendation
Magnachip Semiconductor Corporation
Section 1: Company Fundamentals
1.1 Company Overview and Performance summary
Company Overview:
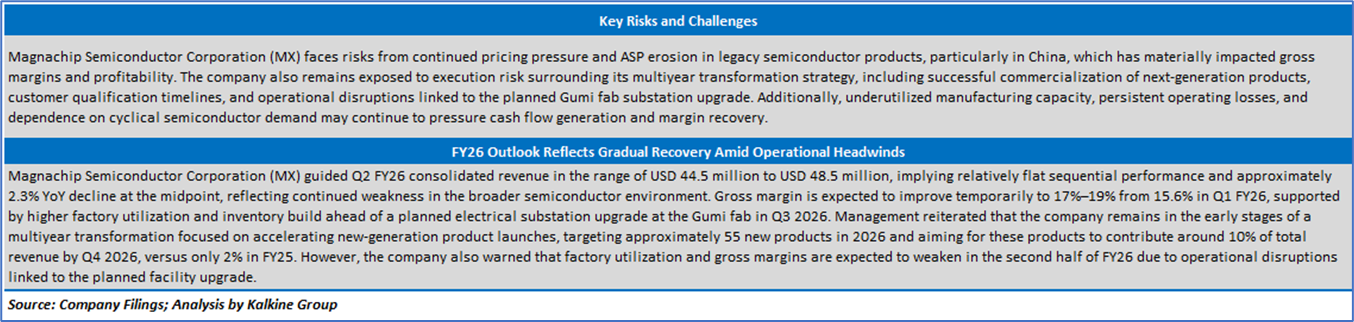
Magnachip Semiconductor Corp (NYSE: MX) is a company principally engaged in designing and manufacturing of analog and mixed-signal power semiconductor platform solutions. The Company's solutions are used in different applications, including industrial, automotive, communication, consumer and computing. The Company develops and manufactures power discrete products and develops power integrated circuit (IC) products.
This Global AI and Emerging Market Report covers the Company Overview & Price performance, Summary table, Key positives & negatives, Key metrics, Company details, technical guidance & Stock recommendation, and Price chart.
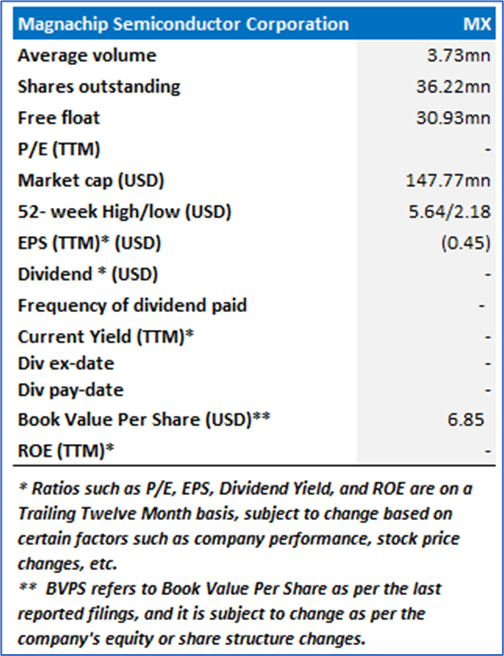
1.2 Summary Table
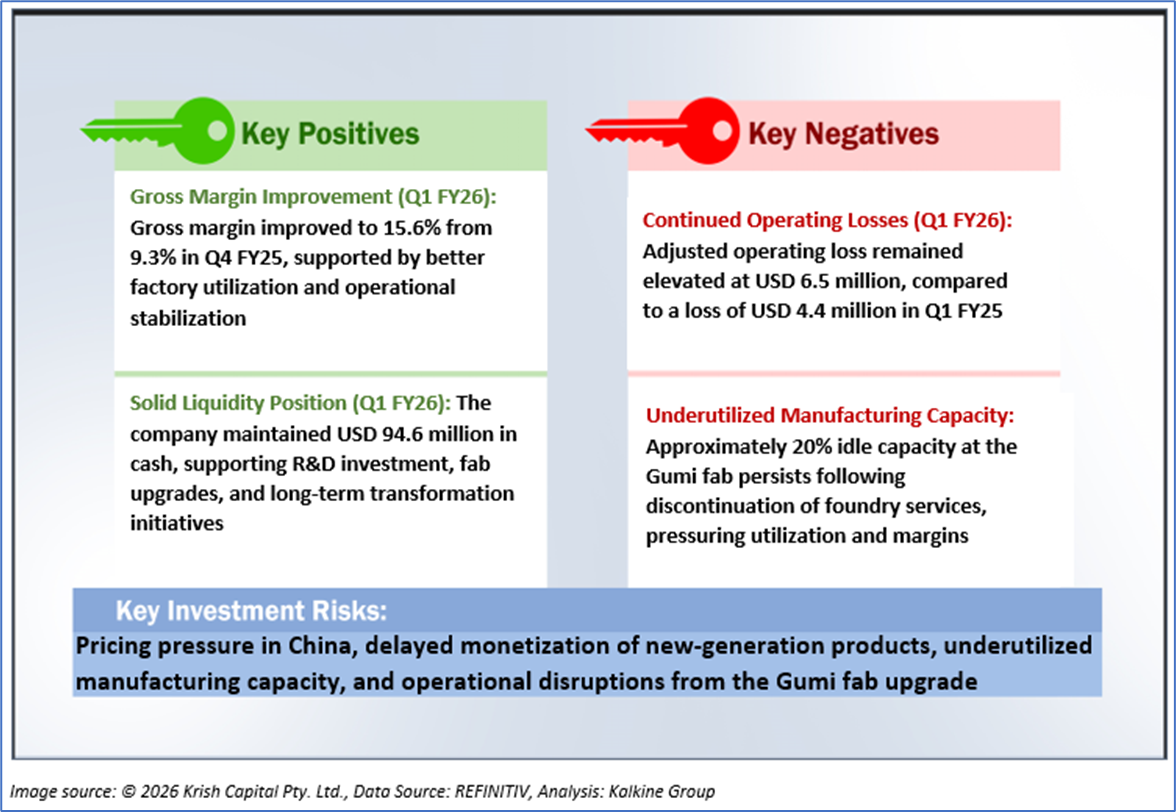
1.3 The Key Positives & Negatives
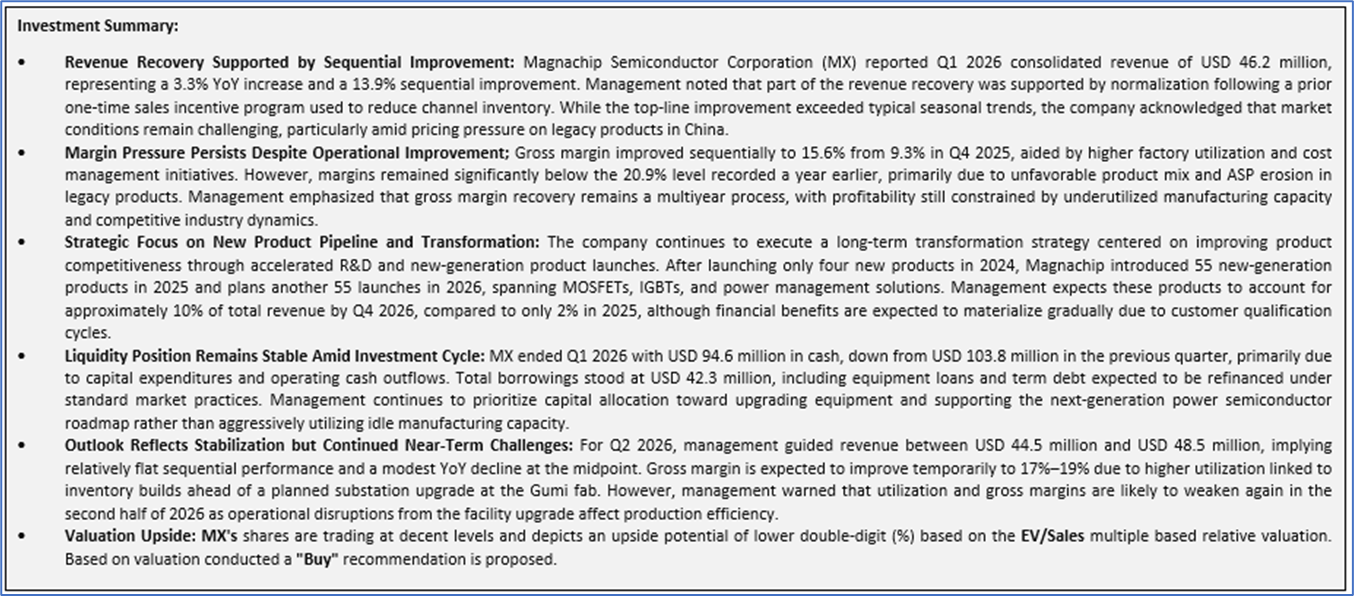
Section 2: Magnachip Semiconductor Corporation (NYSE: MX) (“Buy” at the closing market price of USD 4.08, as of May 05, 2026)
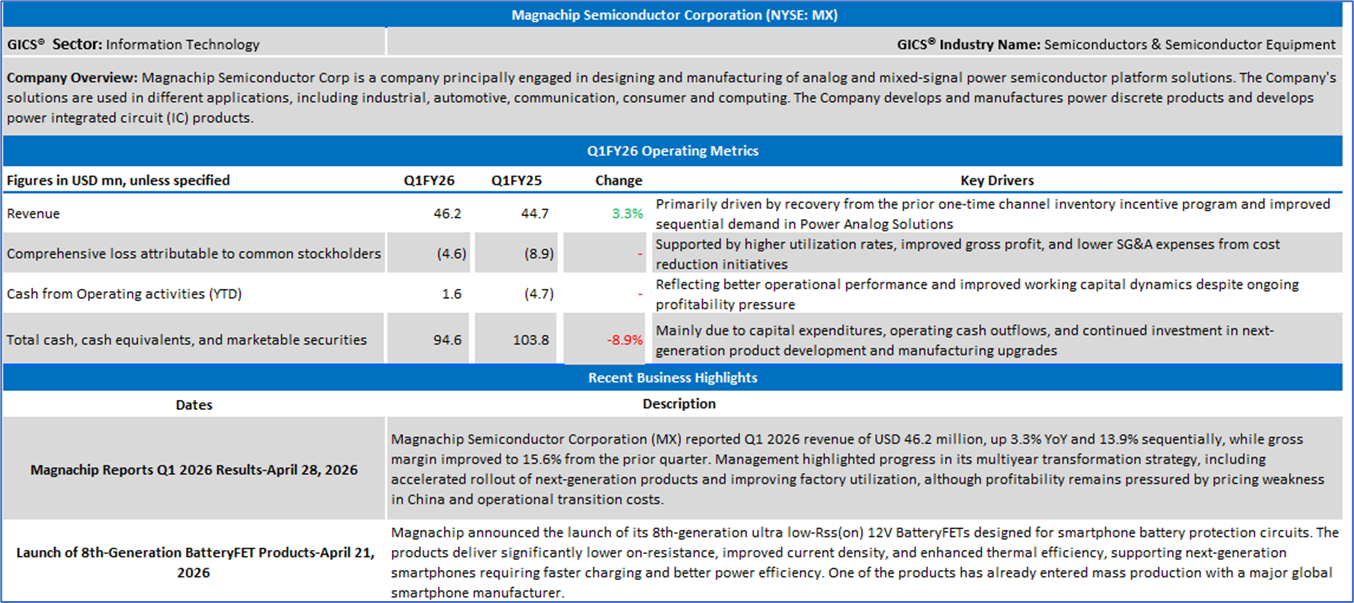
2.1 Company Details
2.2 Technical Guidance and Stock Recommendation
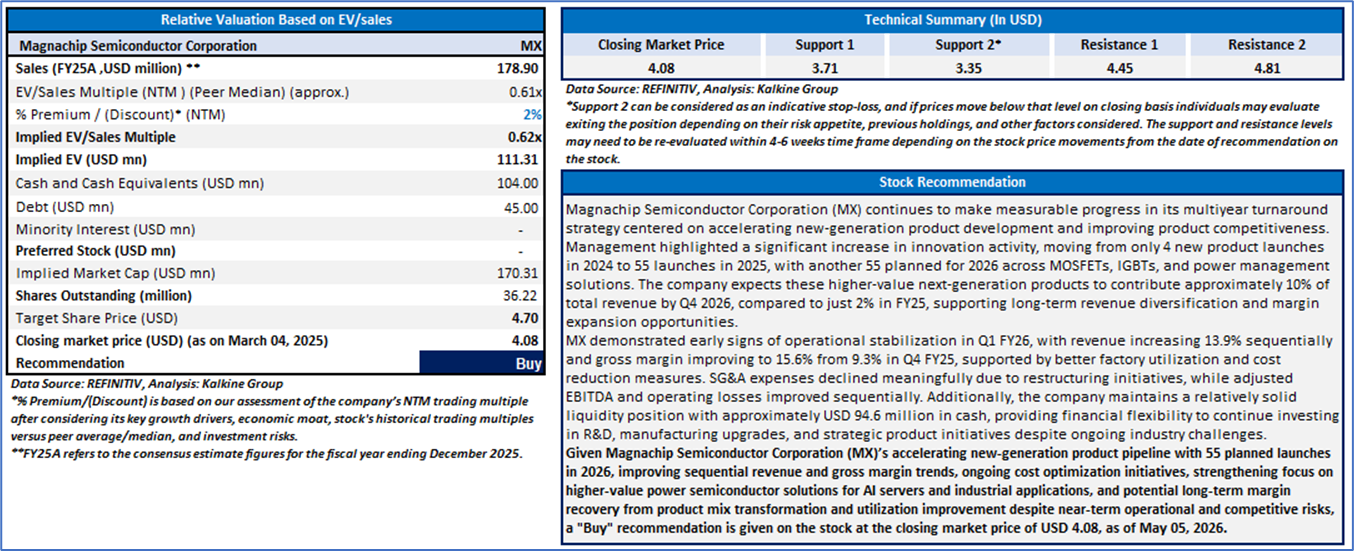
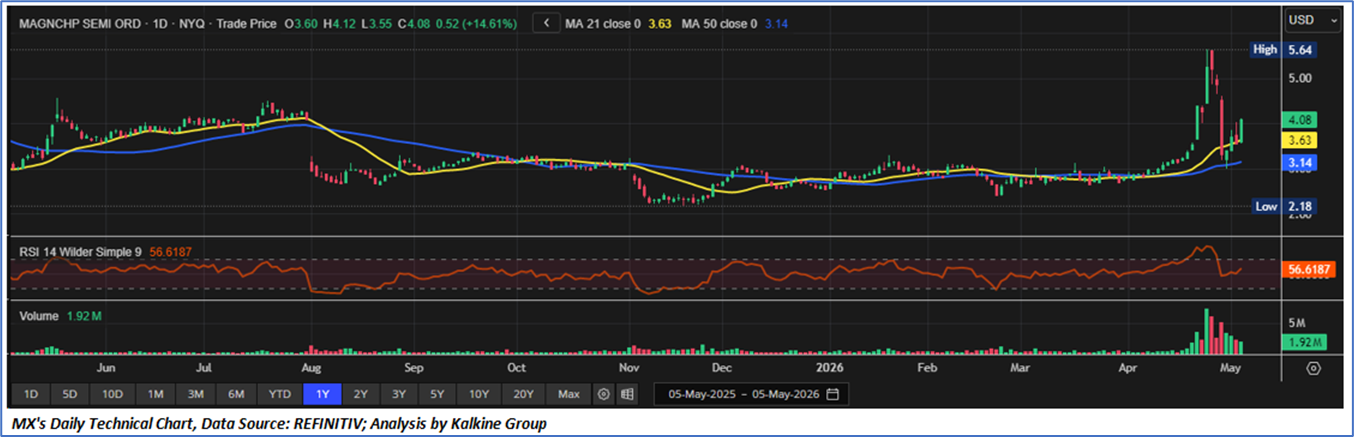
Markets are trading in a highly volatile zone currently due to certain macroeconomic issues and geopolitical tensions prevailing. Therefore, it is prudent to follow a cautious approach while investing.
Note 1: Past performance is not a reliable indicator of future performance.
Note 2: The reference date for all price data, currency, technical indicators, support, and resistance levels is May 05, 2026. The reference data in this report has been partly sourced from REFINITIV.
Note 3: Investment decisions should be made depending on an individual's appetite for upside potential, risks, holding duration, and any previous holdings. An 'Exit' from the stock can be considered if the Target Price mentioned as per the Valuation and or the technical levels provided has been achieved and is subject to the factors discussed above.
Note 4: The report publishing date is as per the Pacific Time Zone.
Technical Indicators Defined: -
Support: A level at which the stock prices tend to find support if they are falling, and a downtrend may take a pause backed by demand or buying interest. Support 1 refers to the nearby support level for the stock and if the price breaches the level, then Support 2 may act as the crucial support level for the stock.
Resistance: A level at which the stocks prices tend to find resistance when they are rising, and an uptrend may take a pause due to profit booking or selling interest. Resistance 1 refers to the nearby resistance level for the stock and if the price surpasses the level, then Resistance 2 may act as the crucial resistance level for the stock.
Stop-loss: It is a level to protect against further losses in case of unfavorable movement in the stock prices.
Past performance is not a reliable indicator of future performance.

 NZ
 UK
 US
 AU
 IND

 CA

 Please wait processing your request...