This is the updated version of the report, which was published on March 16, 2026, at 11:30 AM GMT
Kalkine’s Global Tariff Report provides fully independent analysis and data-driven analysis of major global sectors affected by tariff changes, evaluating the implications these shifts may have on equity valuations across those industries. The report concentrates on trade-sensitive sectors that typically experience heightened investor scrutiny during periods of tariff uncertainty. It also identifies defensive and countercyclical segments that demonstrate relative resilience or may even outperform, amid disruptions to global trade flows.
As illustrated in the table below, several key sectors in different countries are directly impacted by the recent tariff announcement from President Trump.


Key Highlights
Latest Key Developments (as 16 March 2026)
UK
- New proposed U.S. tariffs tied to the Greenland dispute: On January 17, 2026, U.S. President Donald Trump has warned that the United States may introduce additional tariffs of 10 percent on imports from the United Kingdom and several European allies, including Denmark, Norway, Sweden, France, Germany, the Netherlands, and Finland, beginning on 1 February 2026.
- These tariffs could increase to as much as 25 percent by June 2026 if the U.S. does not secure a deal related to Greenland.
Australia
- Baseline U.S. tariffs include a 10% import duty on Australian goods under Trump’s broad tariff regime (applies to nearly all countries).
- Australia has mostly escaped the steep “reciprocal” tariff hikes that hit other trading partners, so direct U.S. duty increases on Australian exports have been relatively limited.
- However, spillover effects — especially slower Chinese demand and global trade disruption — could weigh on Australian exports and mining, tightening economic conditions.
Canada
- Trump’s earlier plan included 25% tariffs on Canadian imports as part of his tariff escalation — though exemptions for products compliant with USMCA (trade deal) were negotiated, and timing changed due to pauses/extensions.
- Canada is prominent among U.S. allies opposing these tariffs, and Ottawa has signaled a desire to resolve disagreements through talks rather than deepening trade conflict.
- Tariffs remain a major point of friction in U.S.–Canada trade relations, with potential risks for auto and industrial supply chains if full reciprocal duties take effect.
India
- After months of severe tariff tensions (with U.S. duties on Indian goods reaching very high levels), the U.S. and India have agreed an interim trade framework that reduces U.S. tariffs on Indian imports to ~18% from previously elevated levels.
- Under that deal, India committed to curbing Russian oil purchases as part of broader negotiations, which was a key trigger for earlier tariff escalation.
- While tariffs have eased, significant duties still remain on key goods, and India maintains protection for sensitive sectors — progress toward a full trade deal continues into 2026.
China
- China has been a central target of Trump’s tariff increases, with U.S. duties on Chinese imports raised sharply above baseline levels.
- Beijing has responded with retaliatory tariffs and export controls on U.S. goods, contributing to intensifying trade tensions.
- Despite tensions, negotiations and dialogue persist intermittently — including possible talks aimed at easing the trade standoff — but a stable resolution remains elusive.
European Union
- Under Trump’s tariff regime, the EU faces reciprocal U.S. tariffs significantly higher than historic levels(around 20% on many goods, according to U.S. tariff lists).
- EU policymakers have pushed back firmly, rejecting U.S. proposals for ultra-high tariffs and instead favouring targeted, proportionate retaliatory measures remained justified.
- Trade negotiations with the U.S. remain complicated by broader geopolitical frictions, including concerns over Russia and NATO cooperation, which intersect with tariff policy discussions.
- Steel and aluminumremain the most sensitive unresolved area, with continued risk of selective tariff escalation or policy tightening into early 2026.

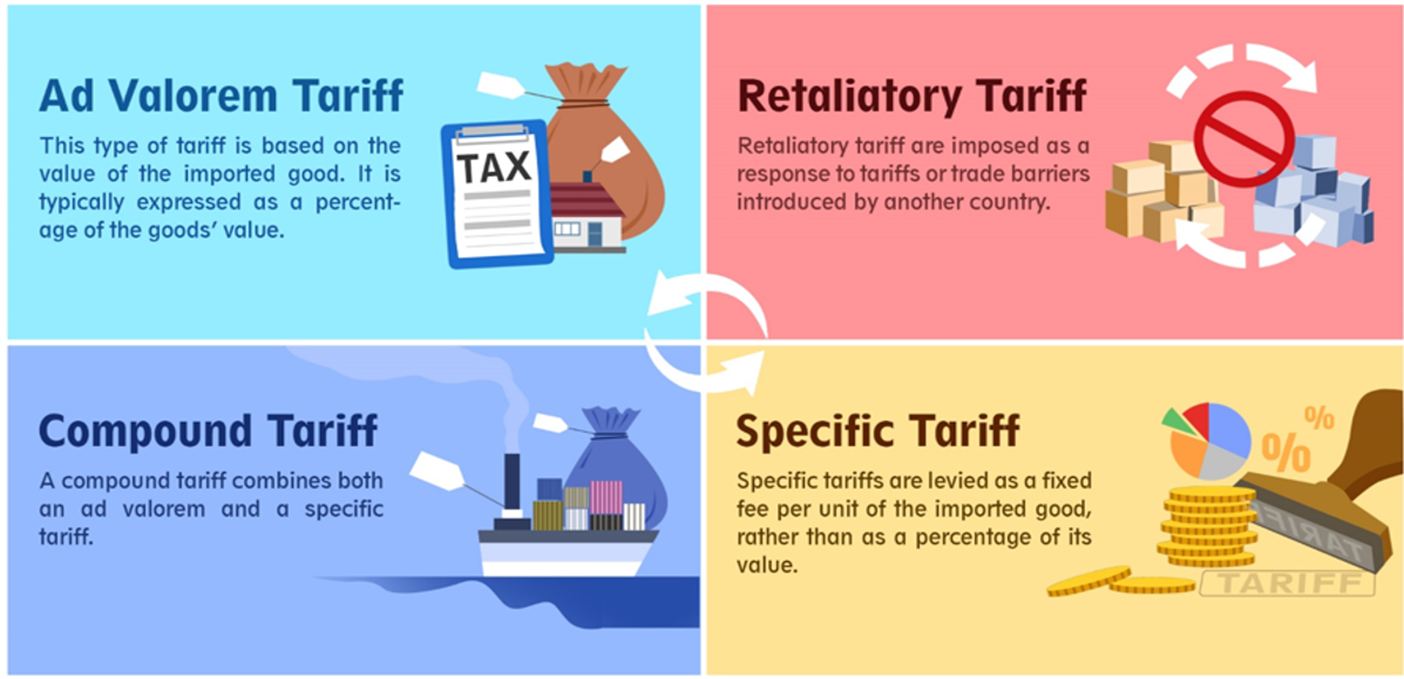
Image source: © 2026 Krish Capital Pty. Ltd., Data Source: REFINITIV, Analysis: Kalkine Group

The UK closed for 3 months to December 2025 with a trade deficit of GBP ~3.70 bn. Total exports reached GBP ~231.70 billion, while imports stood at GBP ~235.40 billion.
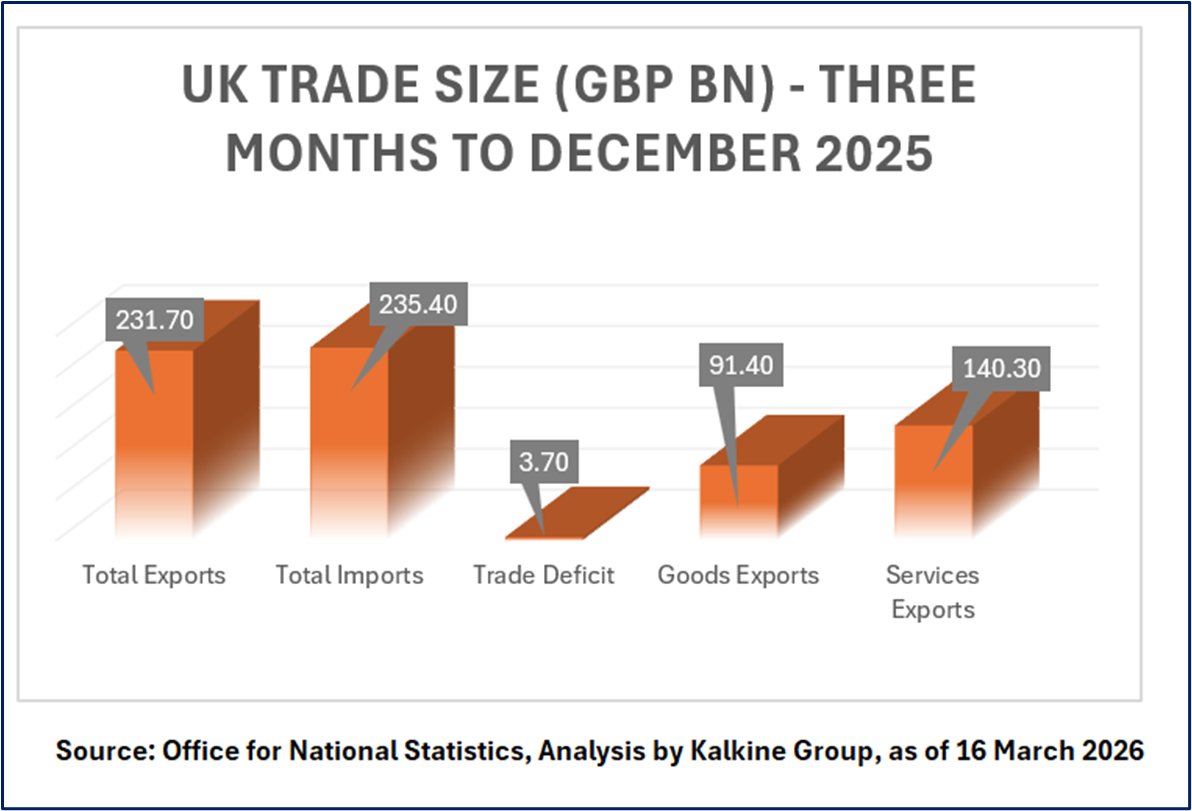

Image source: © 2026 Krish Capital Pty. Ltd., Data Source: REFINITIV, Analysis: Kalkine Group

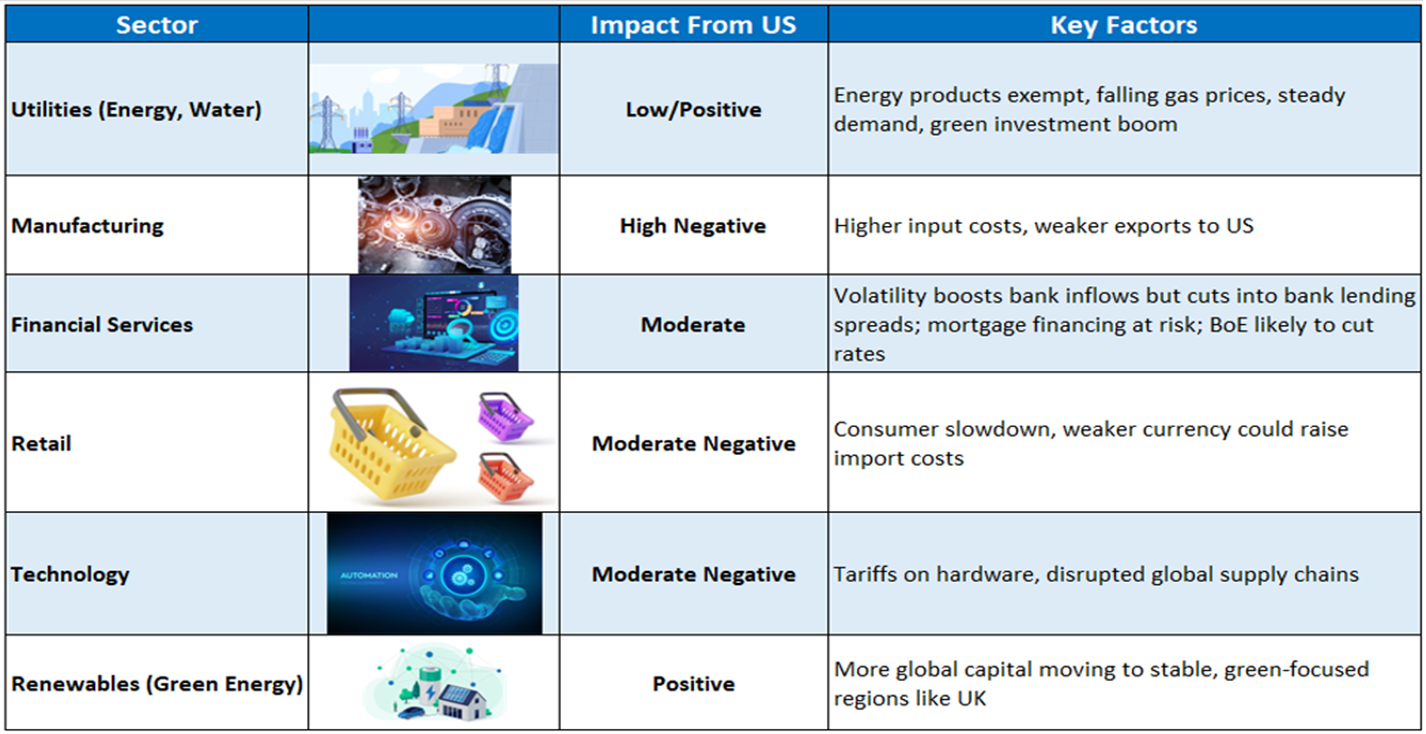
Image source: © 2026 Krish Capital Pty. Ltd., Data Source: REFINITIV, Analysis: Kalkine Group
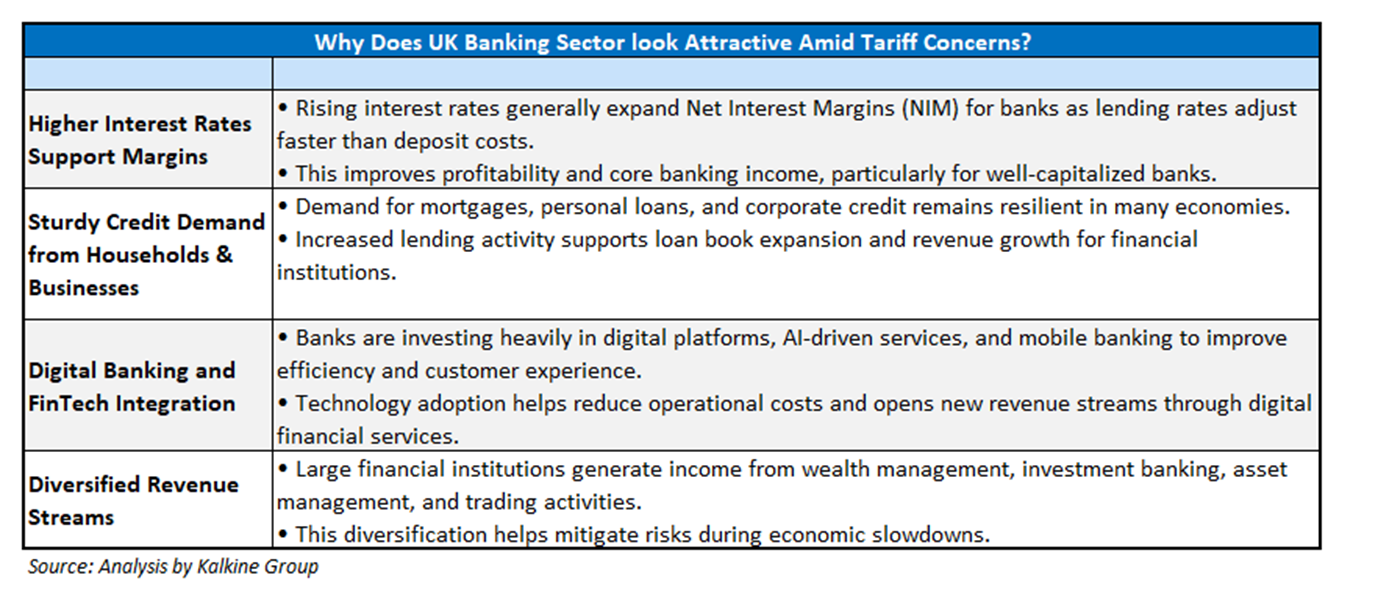
Amid elevated Market Volatility and Tariff pressures, HSBC Holdings PLC (LSE: HSBA) stands out as our defensive pick within the Financial sector, supported by rigorous fundamental and technical research.
Section1: Company Overview and Fundamental Insights:

HSBC Holdings PLC (LSE: HSBA)
HSBC Holdings PLC (LSE: HSBA) is an FTSE 100 Index listed banking and financial services company. The Company’s segments include Wealth and Personal Banking (WPB), Commercial Banking (CMB), and Global Banking and Markets (GBM). WPB provides a range of retail banking and wealth Index-listed management services, including insurance and investment. This Report covers the Key Recommendation Rationale, and Conclusion on the stock.
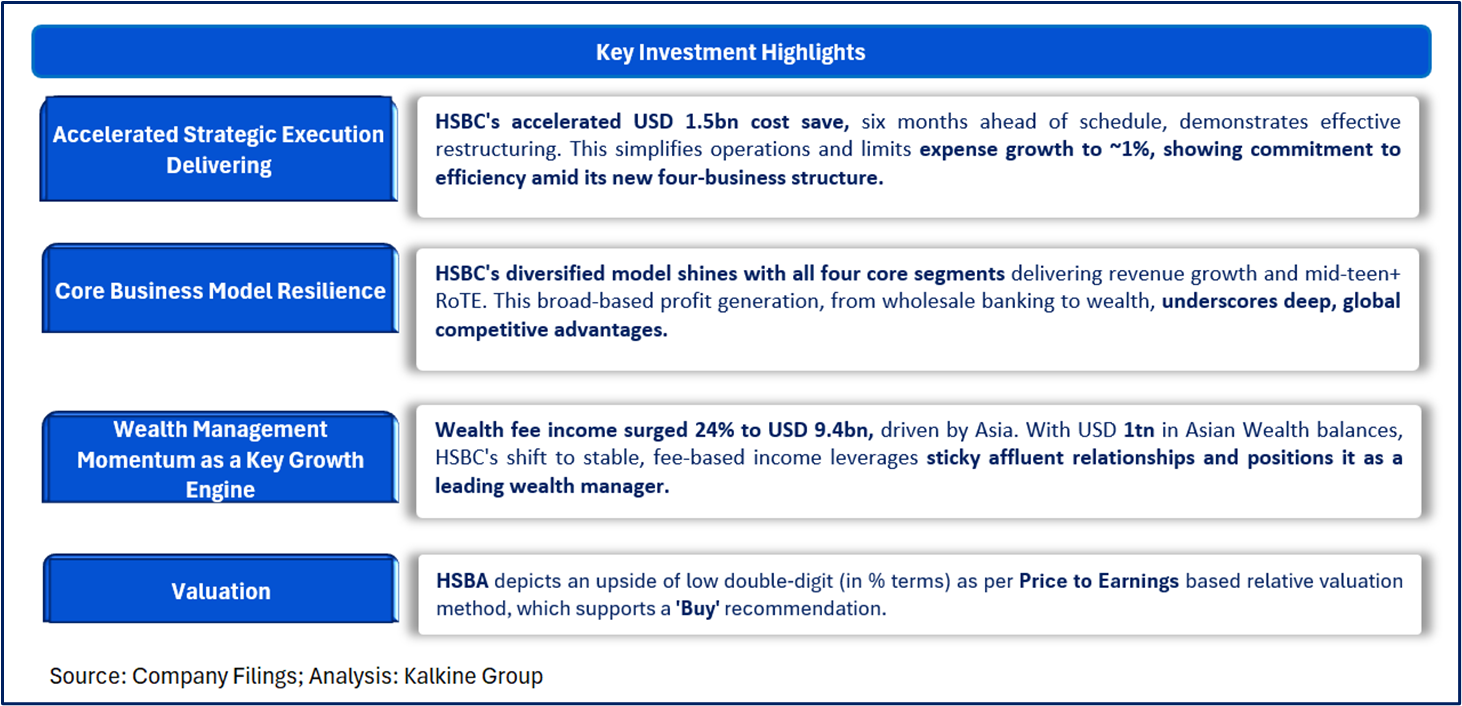
Kalkine’s Global Tariff Report covers the Investment Highlights, Key Financial Metrics, Risks, and Recent Business Updates along with the Valuation, Target Price, and Recommendation on the stock.
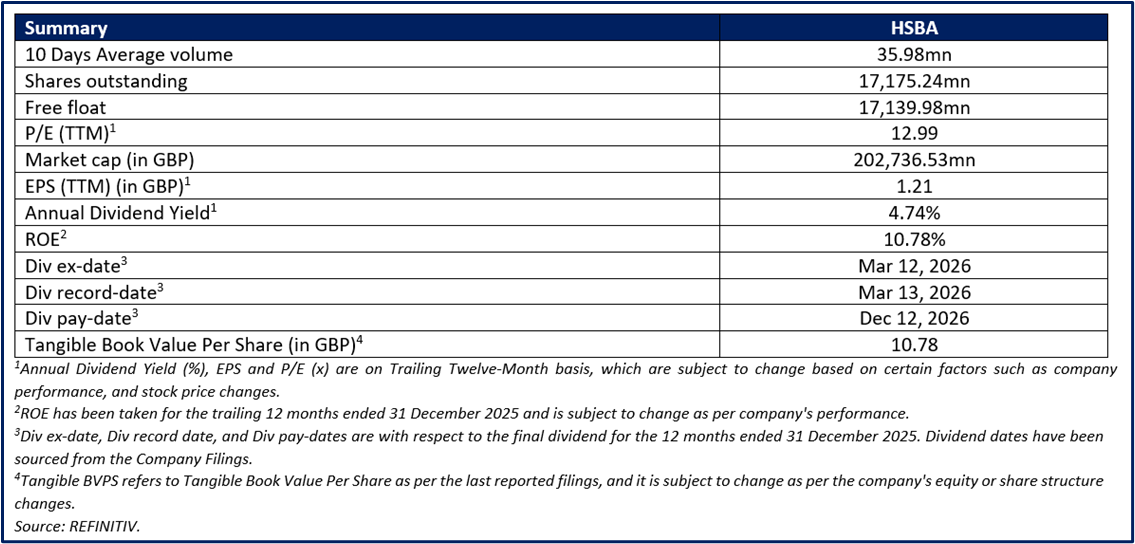


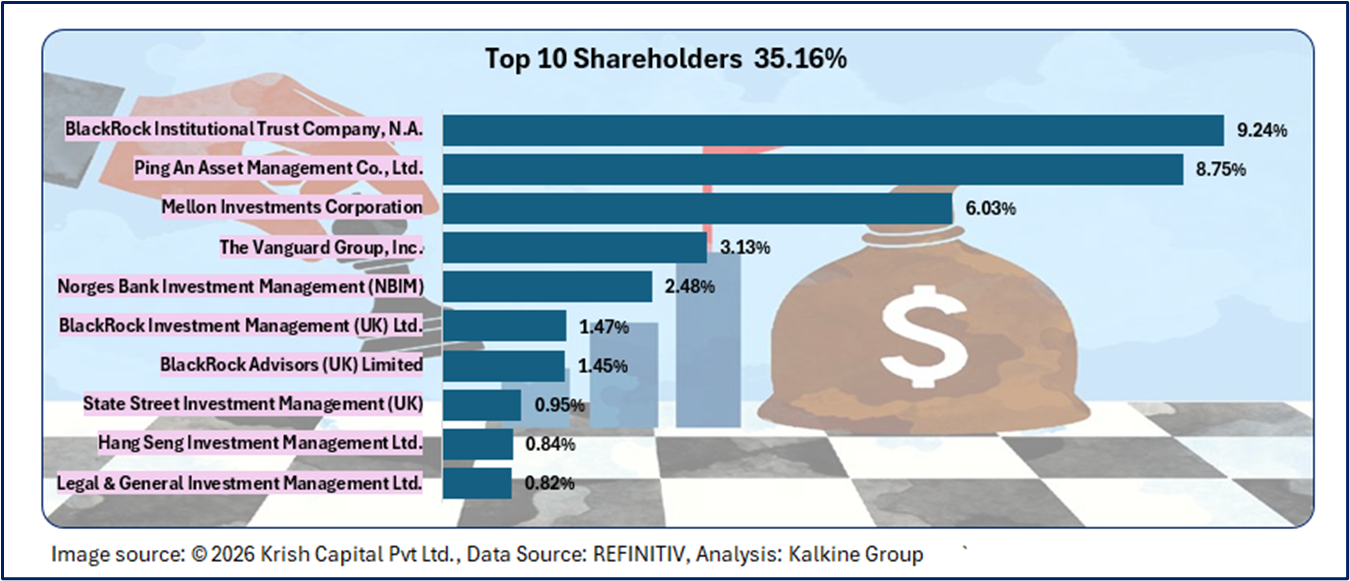
The top 10 shareholders together form ~35.16% of the total shareholding. BlackRock Institutional Trust Company, N.A. and Ping An Asset Management Co., Ltd. hold a maximum stake in the company at ~9.24% and ~8.75%, respectively.

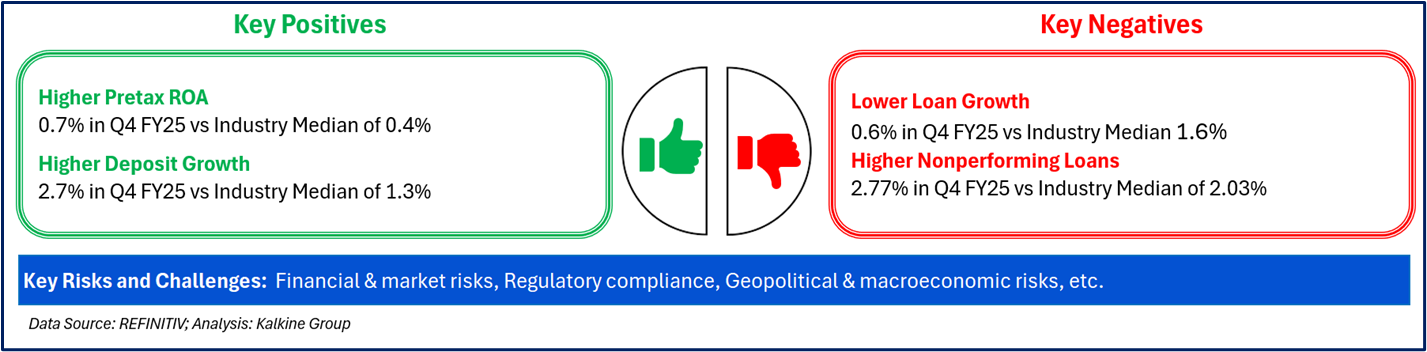
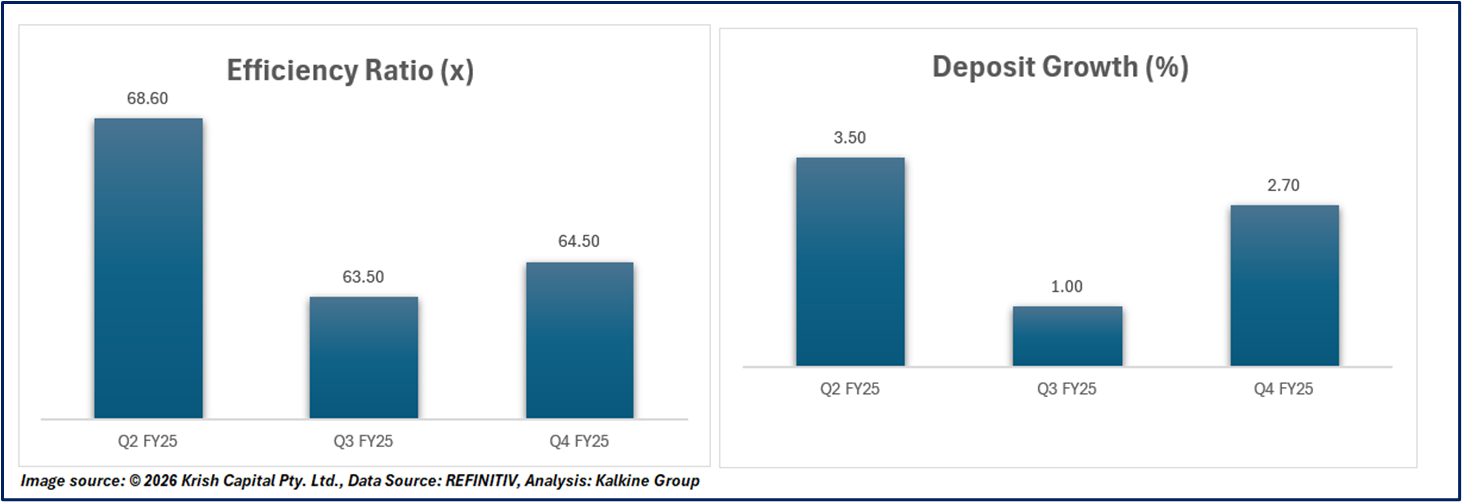
In Q4 FY25, HSBC's operational efficiency improved, with the cost-to-income ratio falling from 68.6% to 64.5% by Q4. However, this was achieved amid moderate deposit growth, which grew from 1.0% to 2.7% in Q4 FY25 from Q3 FY25.
Below charts data are compared on year-on-year basis
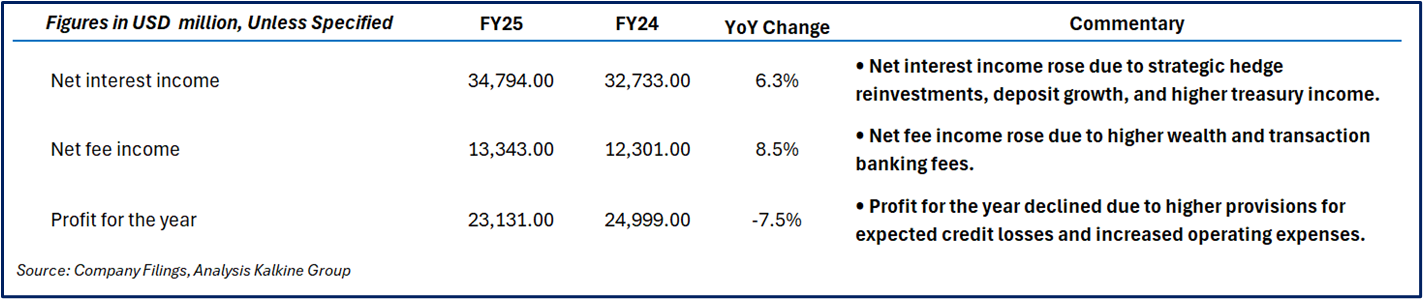
Section 2: Business Updates and Financial Highlights

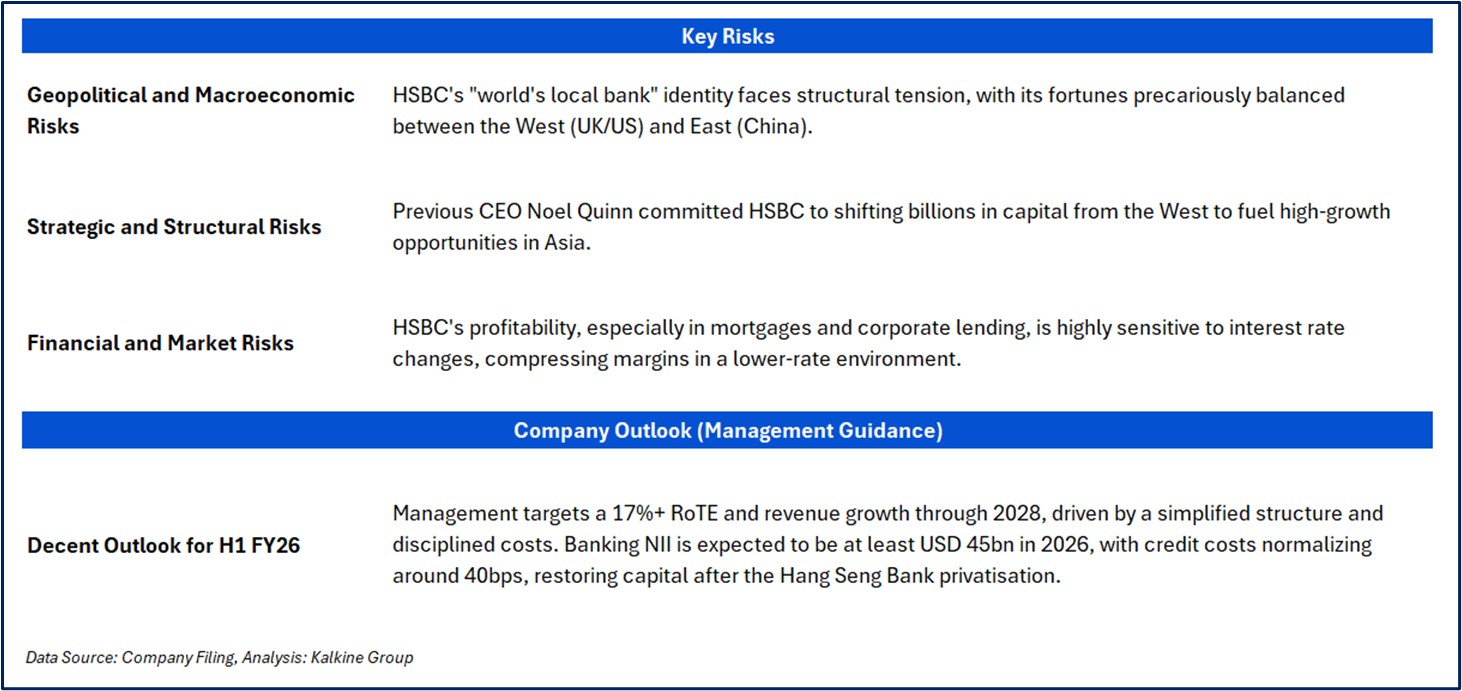
Section 3: Key Risks and Company Outlook
Section 4: Stock Recommendation Summary



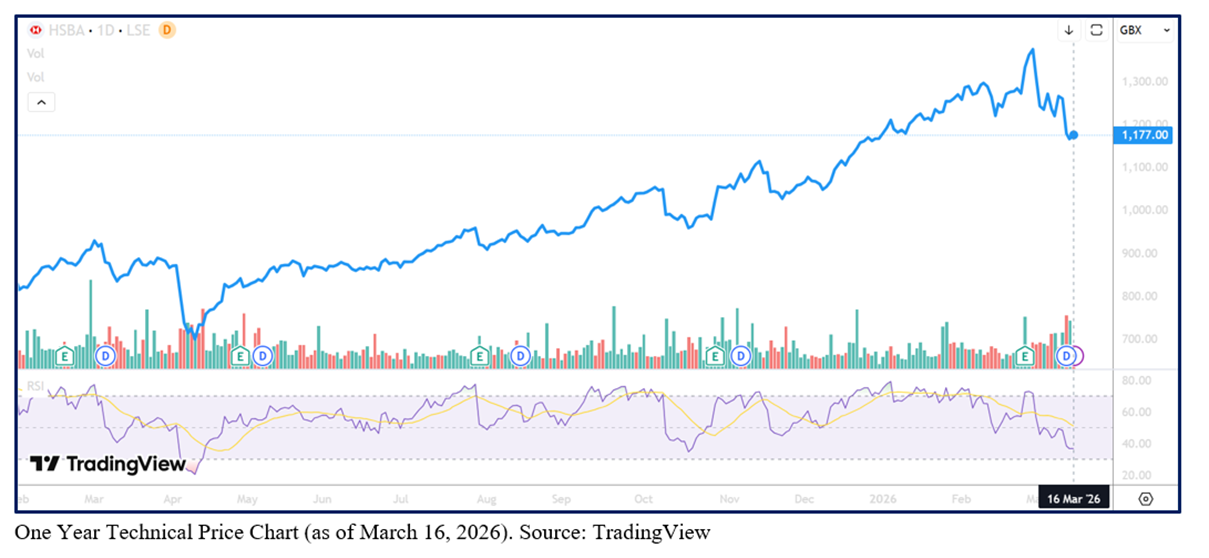

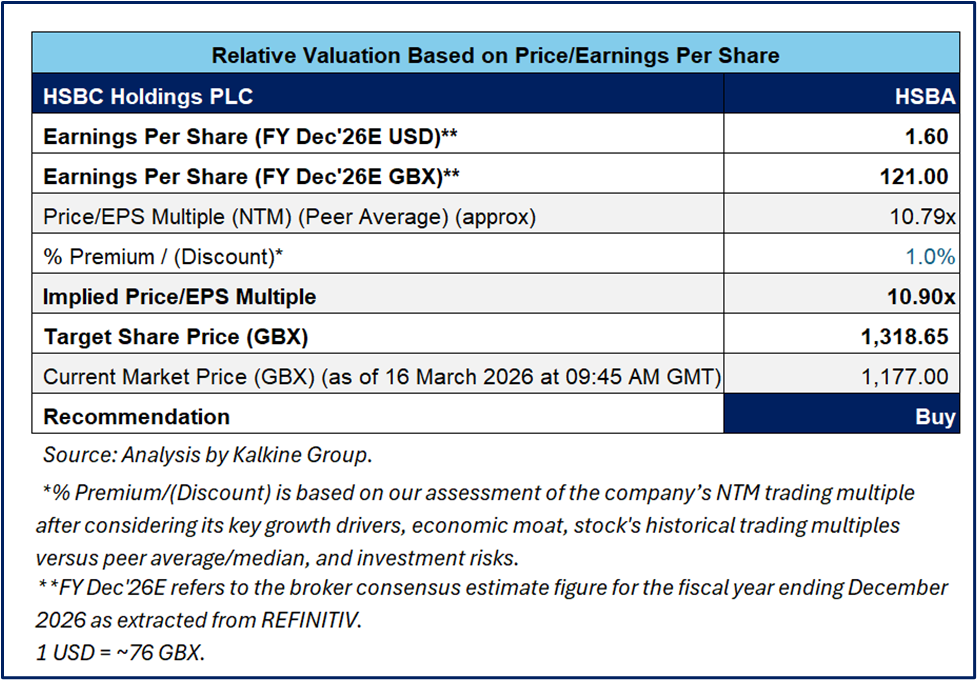
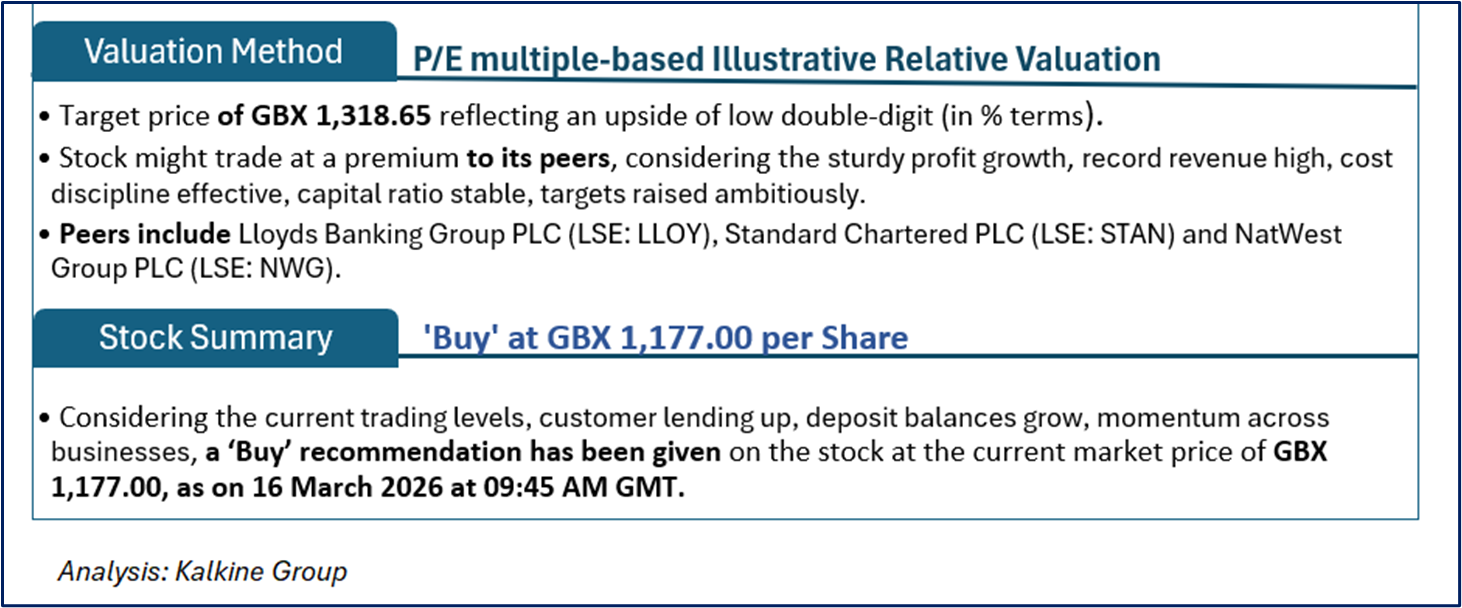
Markets are trading in a highly volatile zone currently due to certain macroeconomic issues and geopolitical tensions prevailing. Therefore, it is prudent to follow a cautious approach while investing.
Note 1: Past performance is not a reliable indicator of future performance.
Note 2: The reference date for all price data, currency, technical indicators, support, and resistance level is 16 March 2026. The reference data in this report has been partly sourced from REFINITIV.
Note 3: Investment decisions should be made depending on an individual's appetite for upside potential, risks, holding duration, and any previous holdings. An 'Exit' from the stock can be considered if the Target Price mentioned as per the Valuation and or the technical levels provided has been achieved and is subject to the factors discussed above.
Note 4: Target Price refers to a price level which the stock is expected to reach as per the relative valuation method and or technical analysis taking into consideration both short-term and long-term scenarios.
Note 5: ‘Kalkine reports are prepared based on the stock prices captured either from the London Stock Exchange (LSE) and or REFINITIV. Typically, both sources (LSE and or REFINITIV) may reflect stock prices with a delay which could be a lag of 15-20 minutes. There can be no assurance that future results or events will be consistent with the information provided in the report. The information is subject to change without any prior notice.
Note 6: Dividend Yield may vary as per the stock price movement.
Technical Indicators Defined: -
Support: A level at which the stock prices tend to find support if they are falling, and a downtrend may take a pause backed by demand or buying interest. Support 1 refers to the nearby support level for the stock and if the price breaches the level, then Support 2 may act as the crucial support level for the stock.
Resistance: A level at which the stock prices tend to find resistance when they are rising, and an uptrend may take a pause due to profit booking or selling interest. Resistance 1 refers to the nearby resistance level for the stock and if the price surpasses the level, then Resistance 2 may act as the crucial resistance level for the stock.
Stop-loss: It is a level to protect further losses in case of unfavourable movement in the stock prices.
Past performance is not a reliable indicator of future performance.

 NZ
 UK
 US
 AU
 IND

 CA

 Please wait processing your request...