Section 1: Company Overview and Fundamental Insights
1.1 Company Overview:
IGM Financial Inc. (TSX: IGM) is the largest non-bank-affiliated asset manager in Canada. The firm is part of the Power Financial group of companies, which includes Great-West Life, London Life, Canada Life, and Putnam Investments. IGM has two main operating divisionsasset management (operated through Mackenzie Investments) and wealth management (via its Investors Group Wealth Management and Investment Planning Counsel subsidiaries)that provide investment management products and services
Kalkine’s Investor Report covers the Investment Highlights, Key Financial Metrics, Risks, Technical Analysis along with the Valuation, Target Price, and Recommendation on the stock.
One Finance Stock Clocking Higher Asset Under Management – IGM
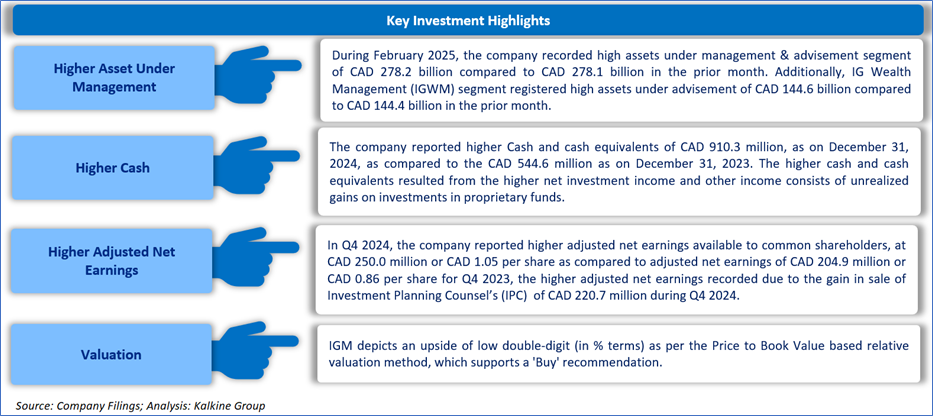
1.2 The Key Positives, Negatives, Investment Highlights and Risk
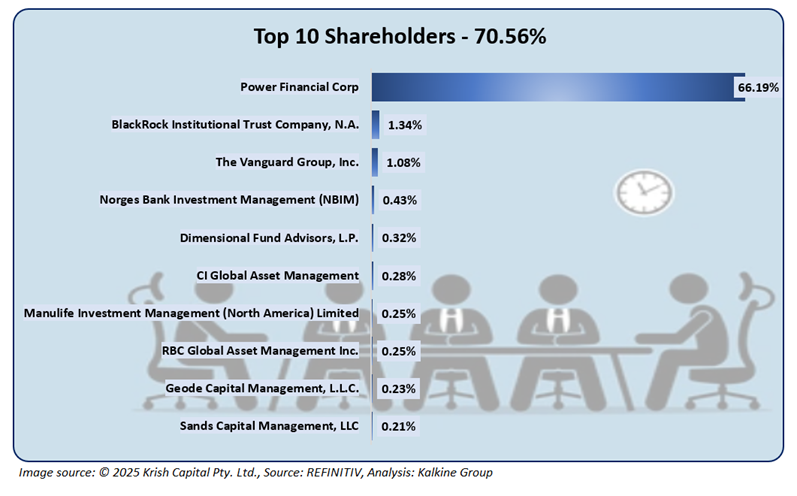
1.3 Top 10 Shareholders:
The top 10 owners represent around 70.56% of the total shareholding. Power Financial Corp and BlackRock Institutional Trust Company, N.A. have the most holding in the company, at 66.19% and ~1.34%, respectively.
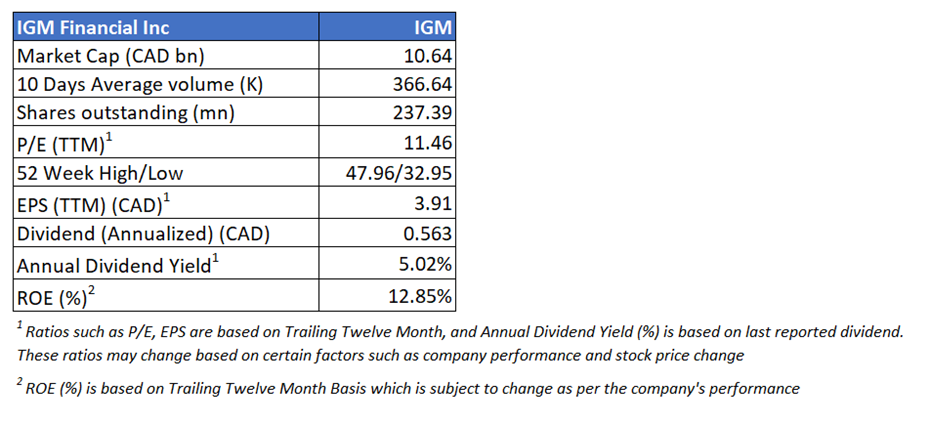
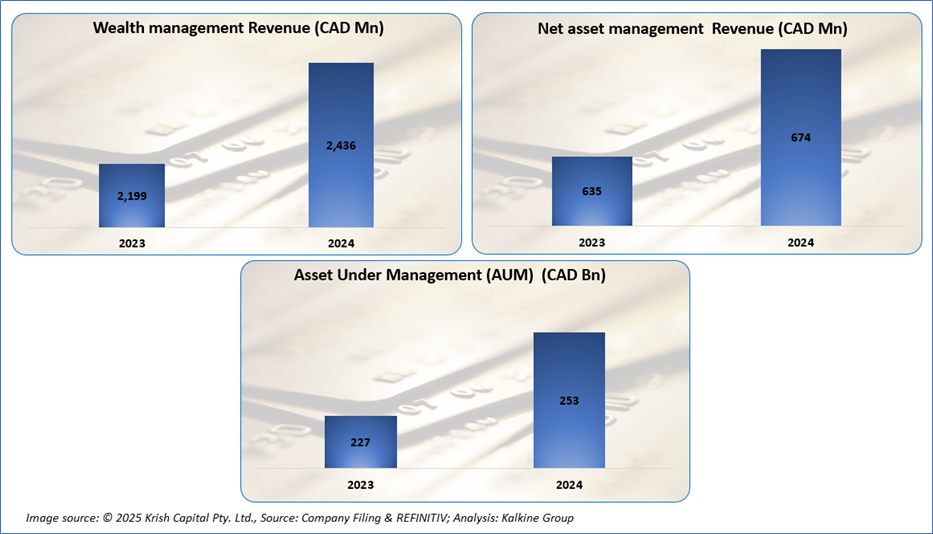
1.4 Key Metrics:
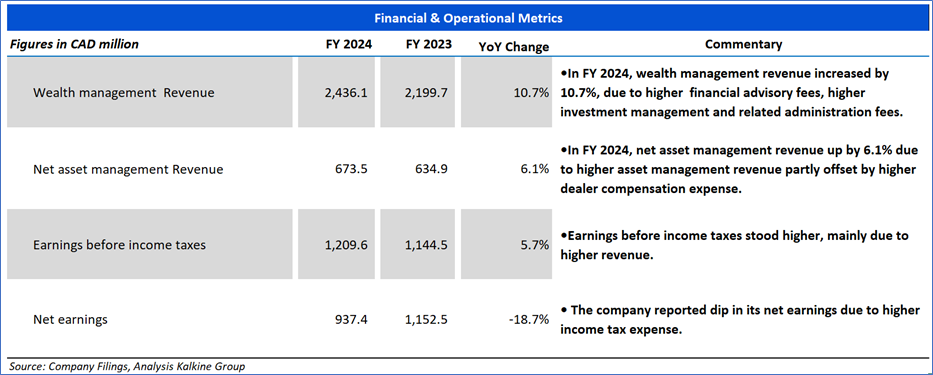
In FY 2024, the company reported higher wealth management revenue and higher net asset management revenue, which is a significant positive. Furthermore, it reported improving asset under management (AUM), demonstrating persistence and adaptability.
Section 2: Business Updates and Financial Highlights
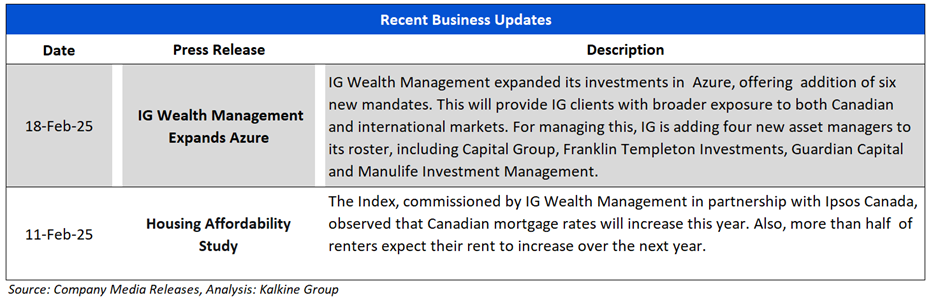
2.1 Recent Updates: The image below depicts an overview of the company's recent actions; here, the company presented information about its expansion in Azure’s Investments and IG Wealth Management released a study about Canadian Housing affordability.
2.2 Insights on FY 2024 Financial Performance:
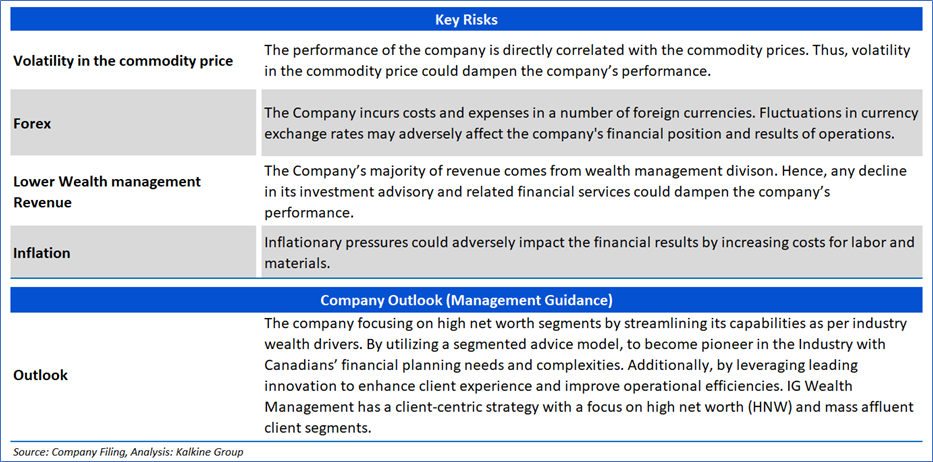
Section 3: Key Risks, Company Outlook:
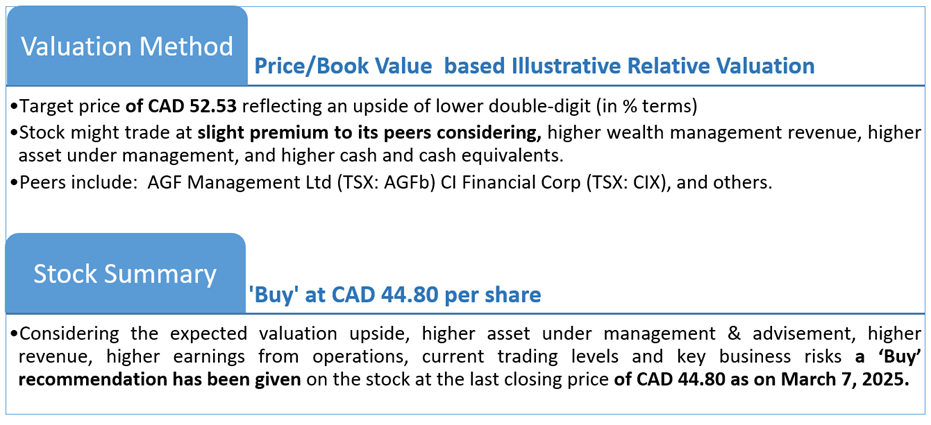
Section 4: Stock Recommendation Summary:
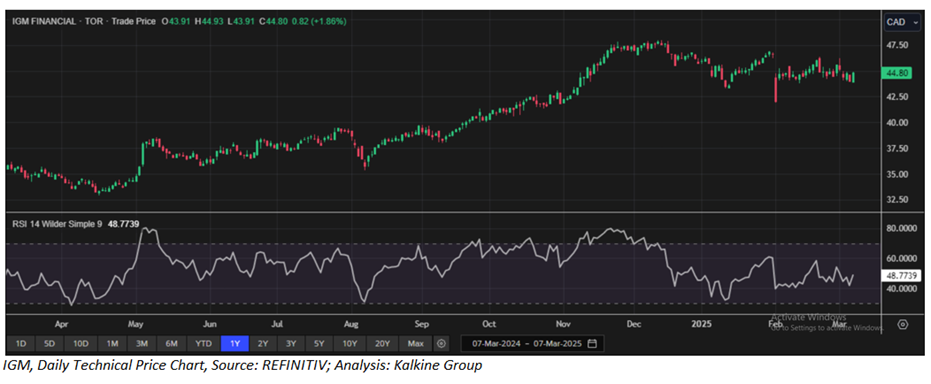
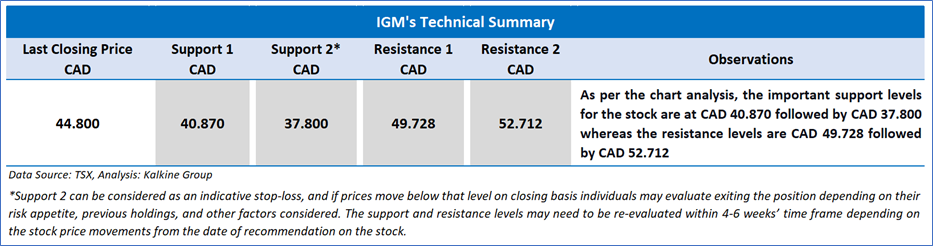
4.1 Price Performance and Technical Summary:

In one week, the stock decreased by ~1.73%, but it increased mildly by ~0.56% in the last one month. Furthermore, the company is trading above its average 52-week high of CAD 47.96 and a 52-week low of CAD 32.95, creating an opportunity to ride the trend.
4.2 Fundamental Valuation
Valuation Methodology: Price to Book Value Multiple Based Relative Valuation (Illustrative)
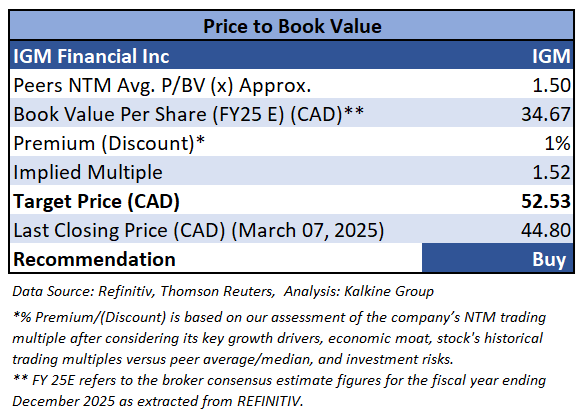
Markets are trading in a highly volatile zone currently due to certain macroeconomic issues and geopolitical tensions prevailing. Therefore, it is prudent to follow a cautious approach while investing.
Note 1: Past performance is not a reliable indicator of future performance.
Note 2: The reference date for all price data, currency, technical indicators, support, and resistance levels as on March 7, 2025. The reference data in this report has been partly sourced from REFINITIV.
Note 3: Investment decisions should be made depending on an individual's appetite for upside potential, risks, holding duration, and any previous holdings. An 'Exit' from the stock can be considered if the Target Price mentioned as per the Valuation and or the technical levels provided has been achieved and is subject to the factors discussed above.
Note 4: Dividend Yield may vary as per the stock price movement.
Note 5: Kalkine reports are prepared based on the stock prices captured either from REFINITIV or Trading View. Typically, REFINITIV or Trading View may reflect stock prices with a delay which could be a lag of 25-30 minutes. There can be no assurance that future results or events will be consistent with the information provided in the report. The information is subject to change without any prior notice.
Technical Indicators Defined: -
Support: A level at which the stock prices tend to find support if they are falling, and a downtrend may take a pause backed by demand or buying interest.
Resistance: A level at which the stock prices tend to find resistance when they are rising, and the uptrend may take a pause due to profit booking or selling interest.
Stop-loss: In general, it is a level to protect further losses in case of any unfavorable movement in the stock prices.
Past performance is not a reliable indicator of future performance.

 Please wait processing your request...