This report is an updated version of the report published on 30 October 2025 at 10:12 AM GMT.

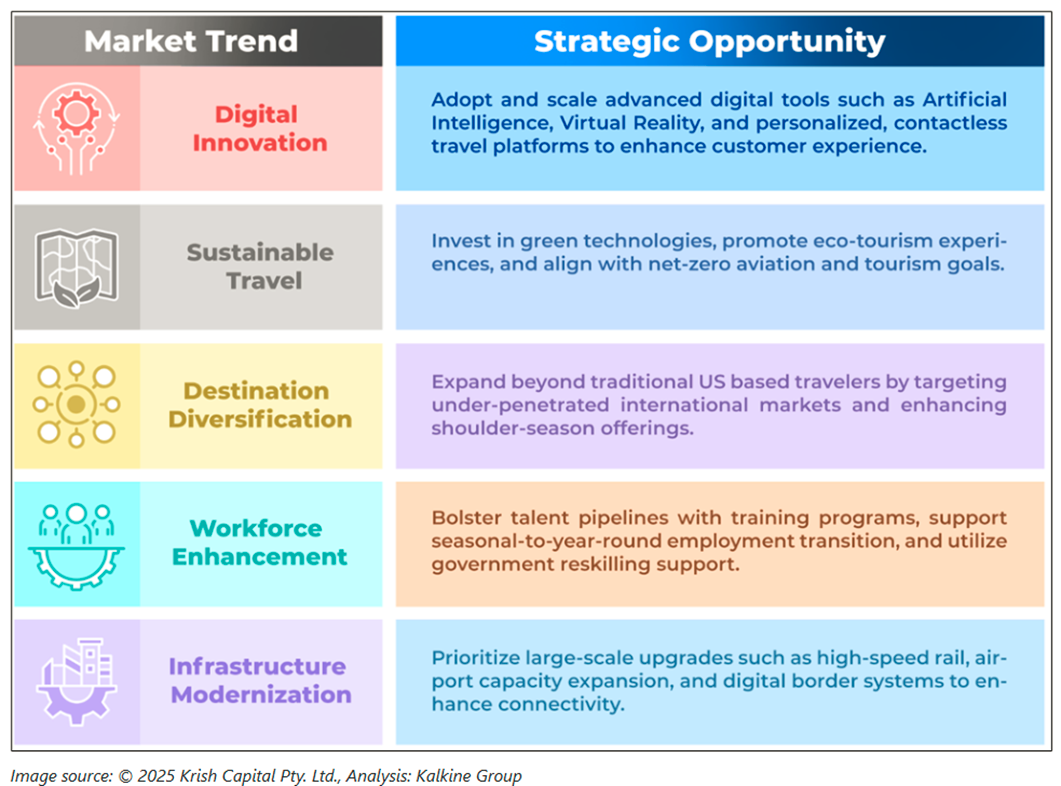
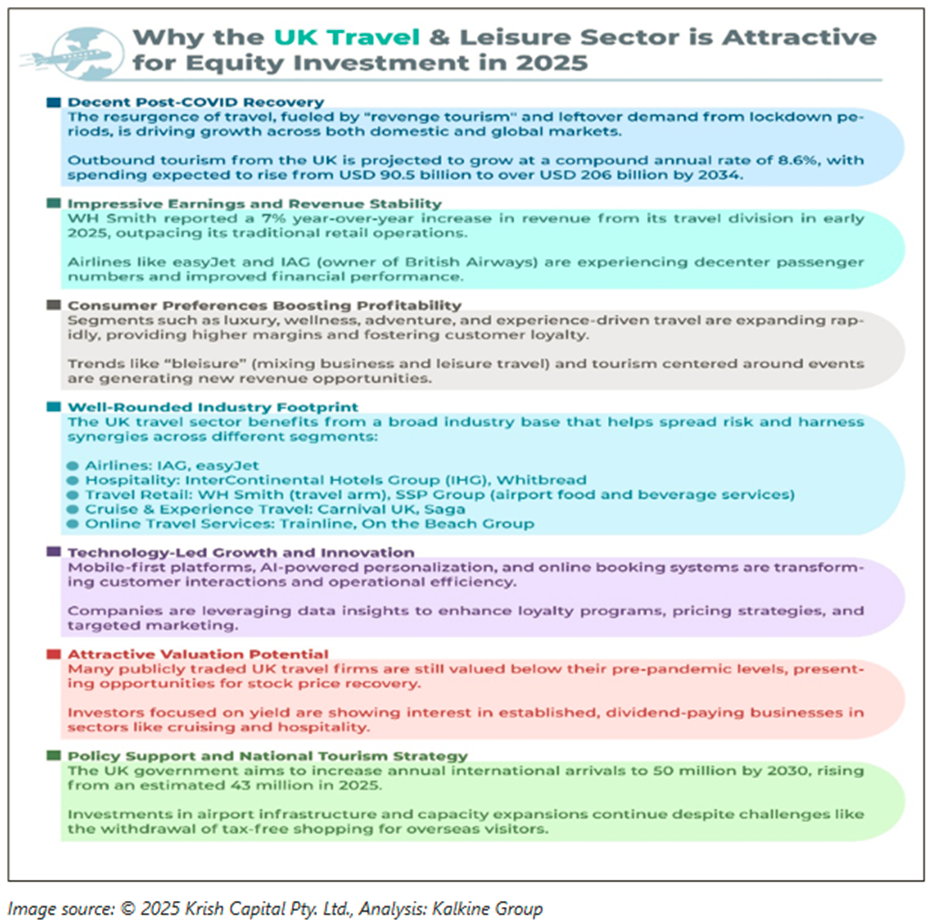
The UK travel and leisure sector is undergoing a steady and sustainable recovery, supported by strong growth in luxury, adventure, and domestic travel. Despite this momentum, the industry continues to face hurdles such as rising costs from policy changes, inflationary pressures, labour shortages, and climate-related challenges. To maintain progress, stakeholders should focus on enhancing visitor spending, embracing digital innovation and experiential offerings, and appealing to new customer demographics. With enduring demand, a shift toward premium and experience-driven travel, and supportive digital trends, the sector presents compelling long-term opportunities for investors. It stands out as a promising option for those interested in recovery-driven, income-generating, or thematically aligned investments such as wellness and sustainable tourism.


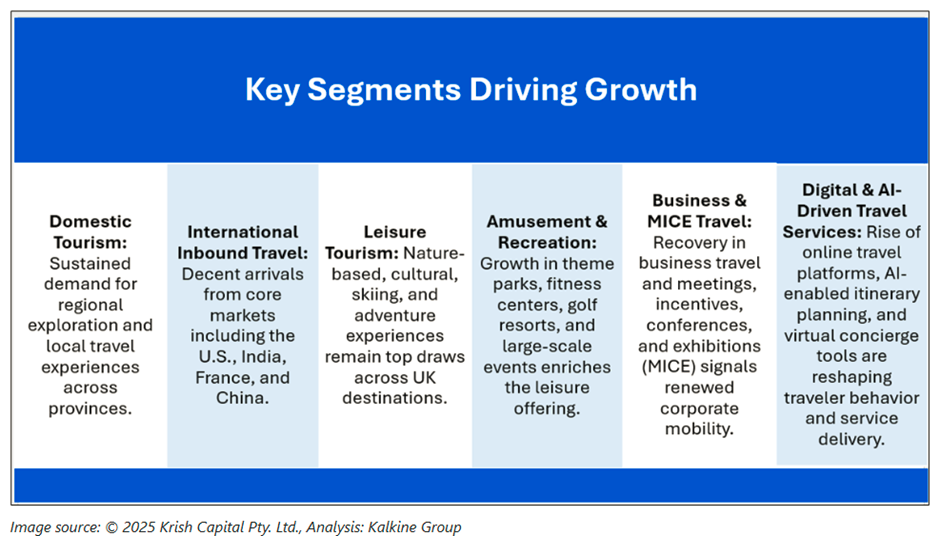
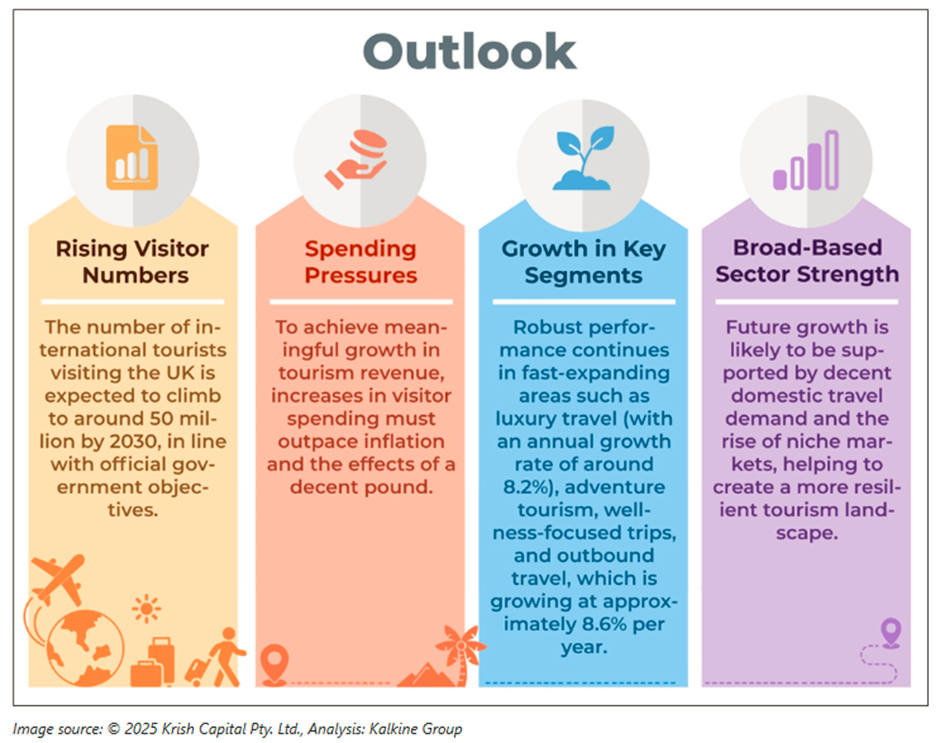
UK’s travel and tourism industry continues to demonstrate resilience and recovery in 2024, contributing significantly to the national economy and employment landscape.
- The UK’s overall tourism economy is valued at approximately £140 billion and continues to show consistent growth.
- Inbound travel has rebounded strongly, surpassing pre-pandemic levels, while outbound travel by UK residents has reached record highs in both volume and spending.
- Online travel is growing steadily at a 6% annual rate, with business travel standing out as the fastest-growing segment within the sector.


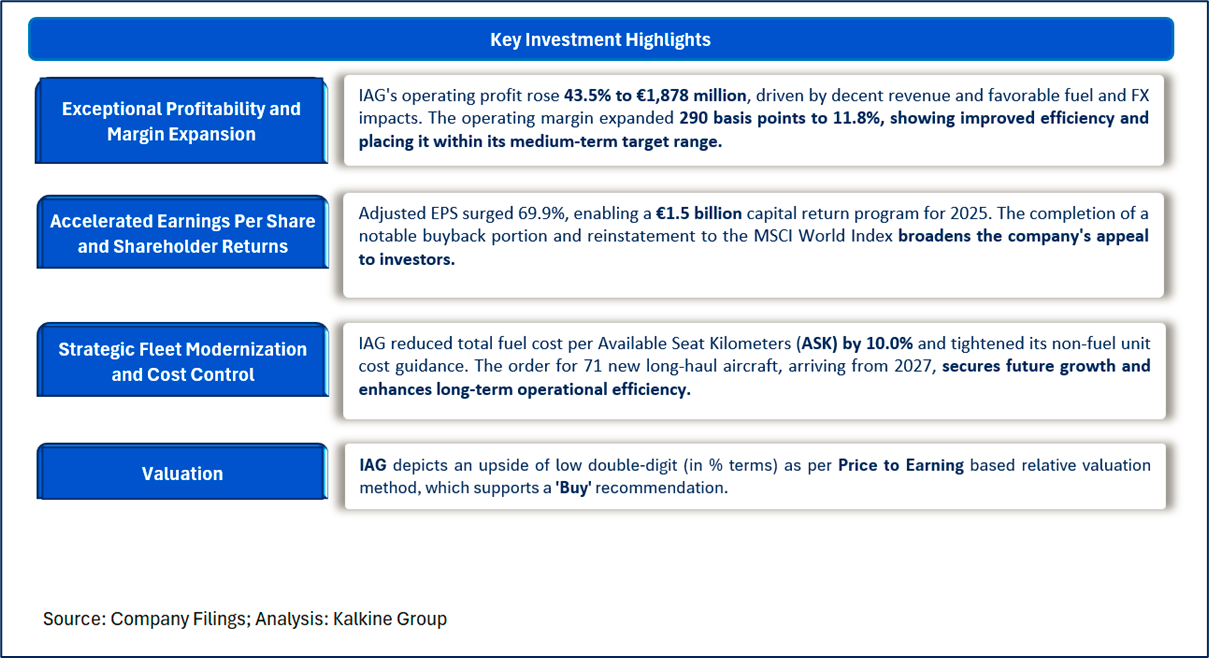
Amid elevated Market Volatility and Global Economic Headwinds, International Consolidated Airlines Group SA (LSE: MAB) stands out as our defensive pick within the
Section1: Company Overview and Fundamental Insights:

International Consolidated Airlines Group SA
International Consolidated Airlines Group SA (LSE: IAG) is an FTSE 100 index-listed European aviation conglomerate that operates flights under the British Airways, Iberia, Aer Lingus, and Vueling banners. Over the past period, the company transported 264 million travelers to 185 destinations worldwide. Its primary airport hubs are situated in London Heathrow, London Gatwick, Madrid, Barcelona, and Dublin.
Kalkine’s Global Travel and Leisure Report covers the Investment Highlights, Key Financial Metrics, Risks, and Recent Business Updates along with the Valuation, Target Price, and Recommendation on the stock.
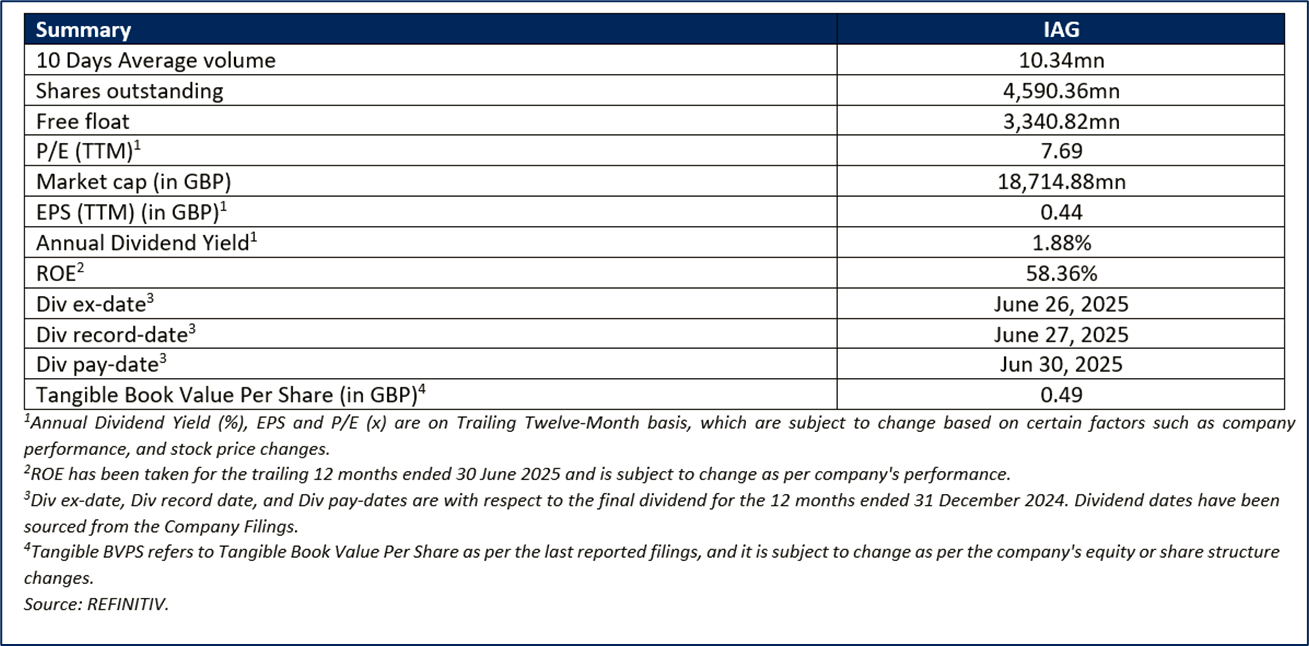


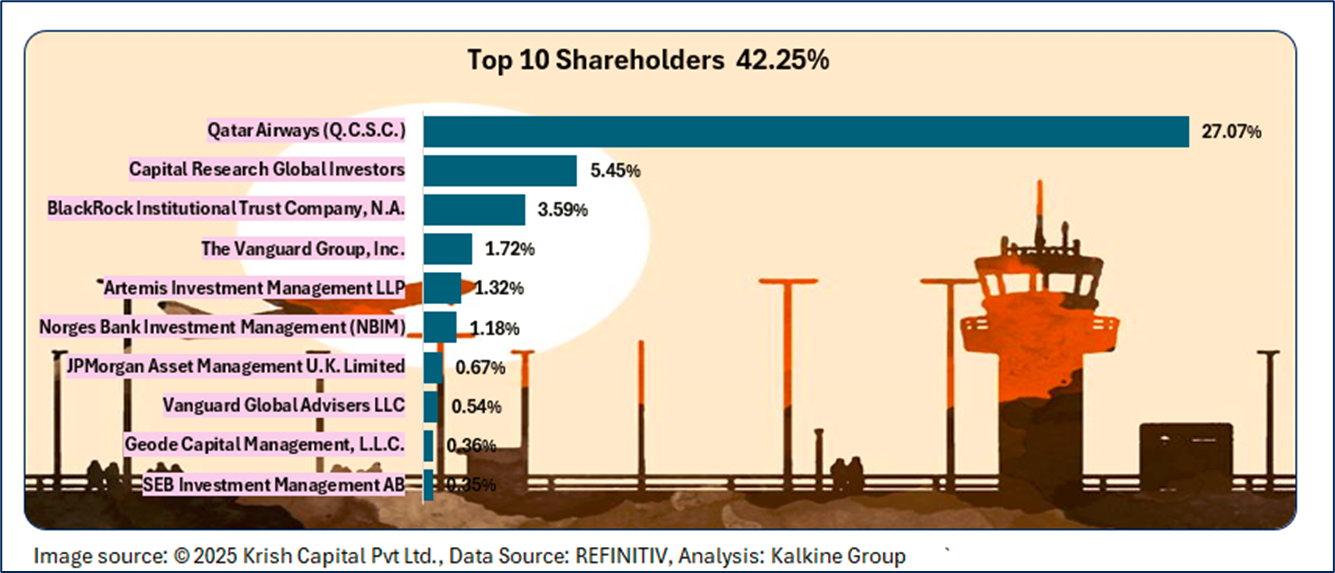
The top 10 shareholders together form ~42.25% of the total shareholding. Qatar Airways (Q.C.S.C.) and Capital Research Global Investors hold a maximum stake in the company at ~27.07% and ~5.45%, respectively.

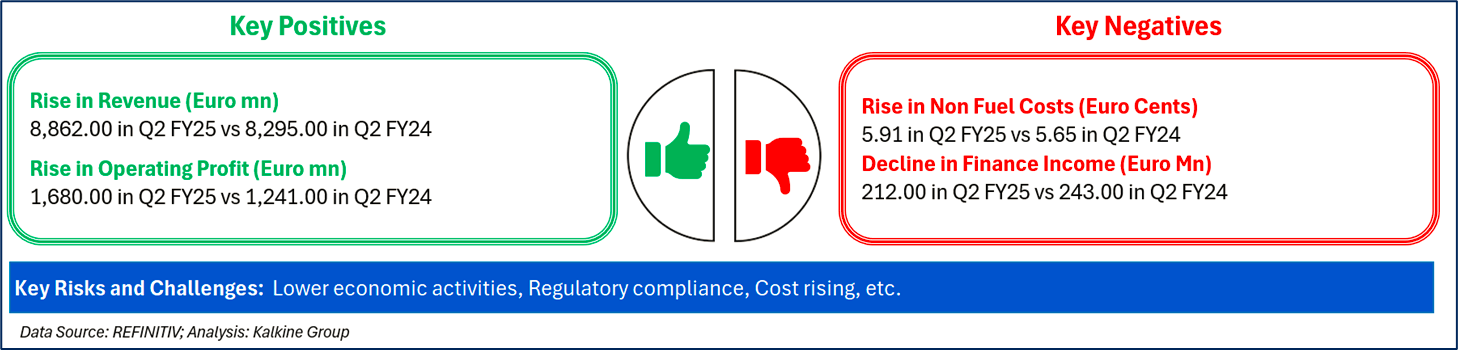
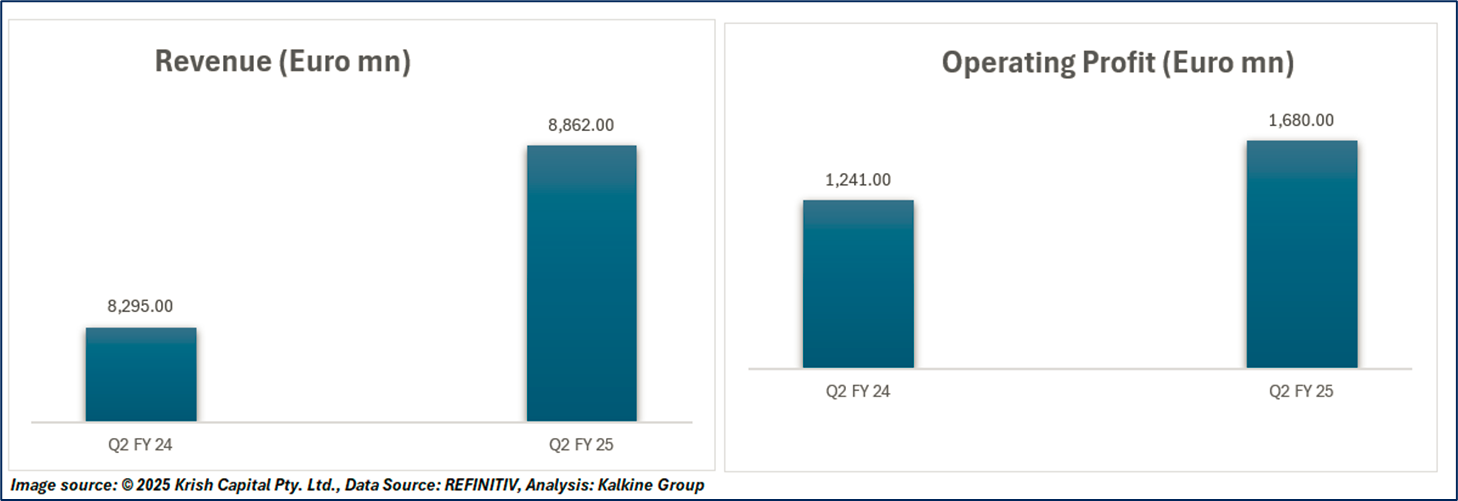
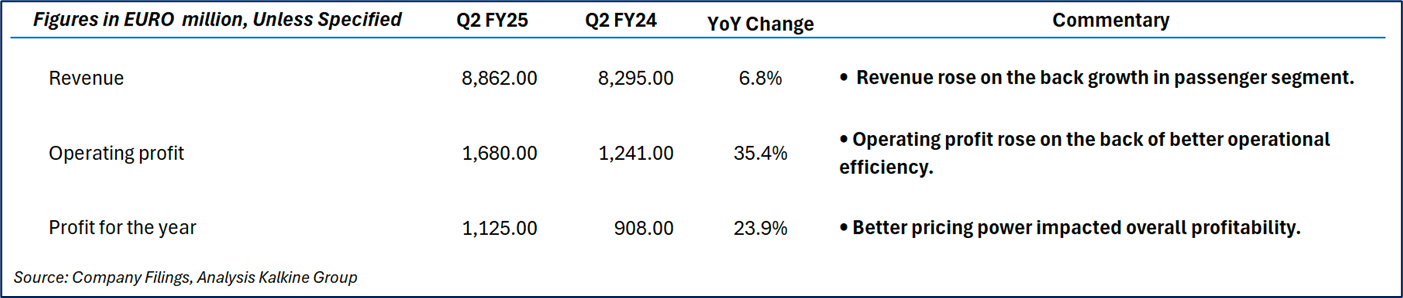
In Q2 FY25, the revenue increased to Euro 8,862 mn, on the back of higher revenue per passenger. The operating profit also rose to Euro 1,680 mn, indicating enhanced operational efficiency.
Below charts data are compared on year-on-year basis
Section 2: Business Updates and Financial Highlights

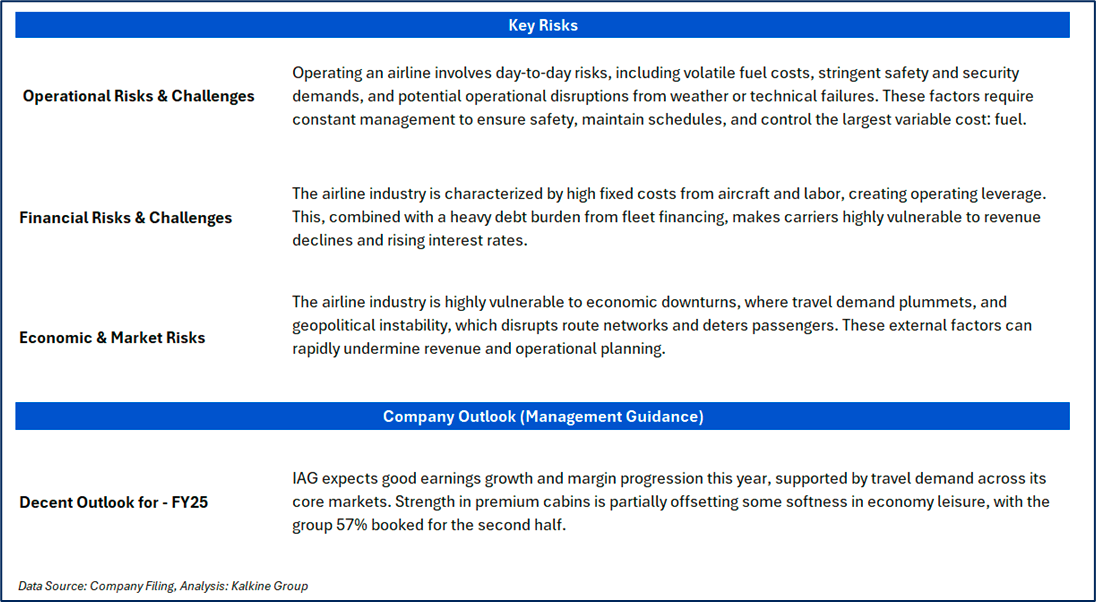
Section 3: Key Risks and Company Outlook
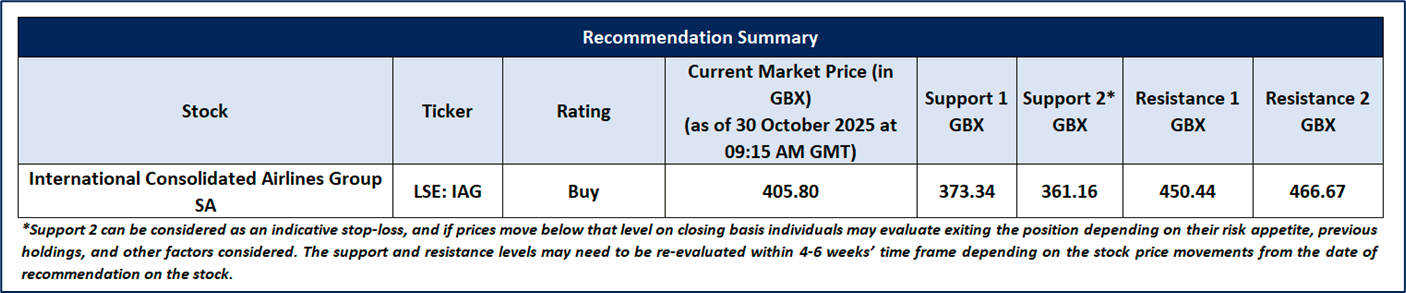
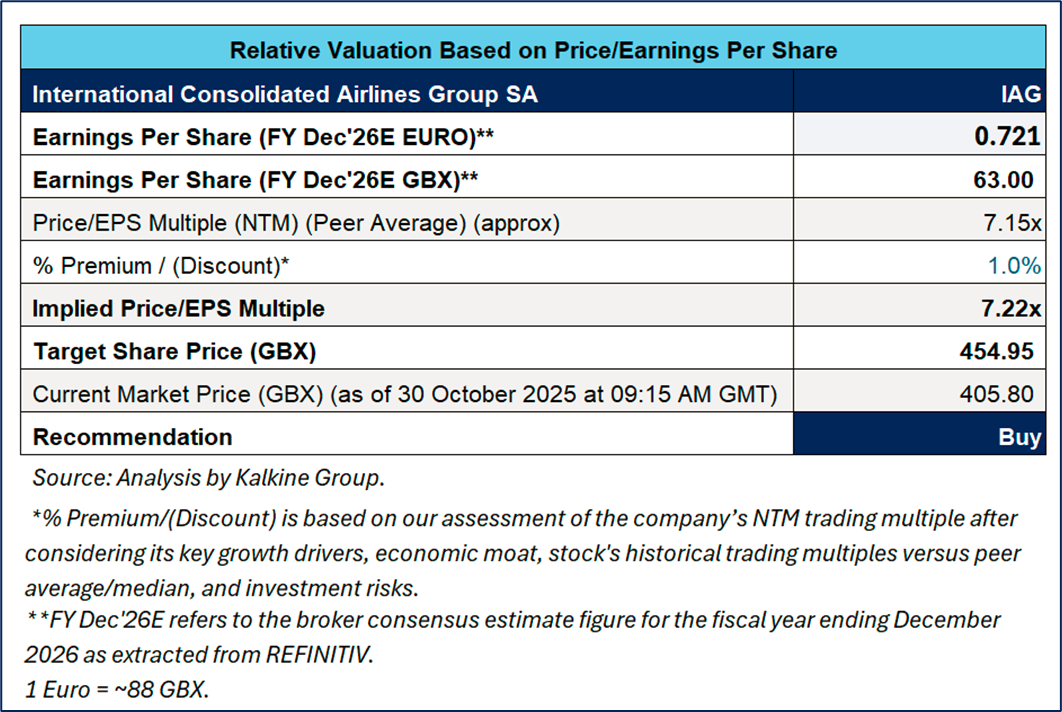
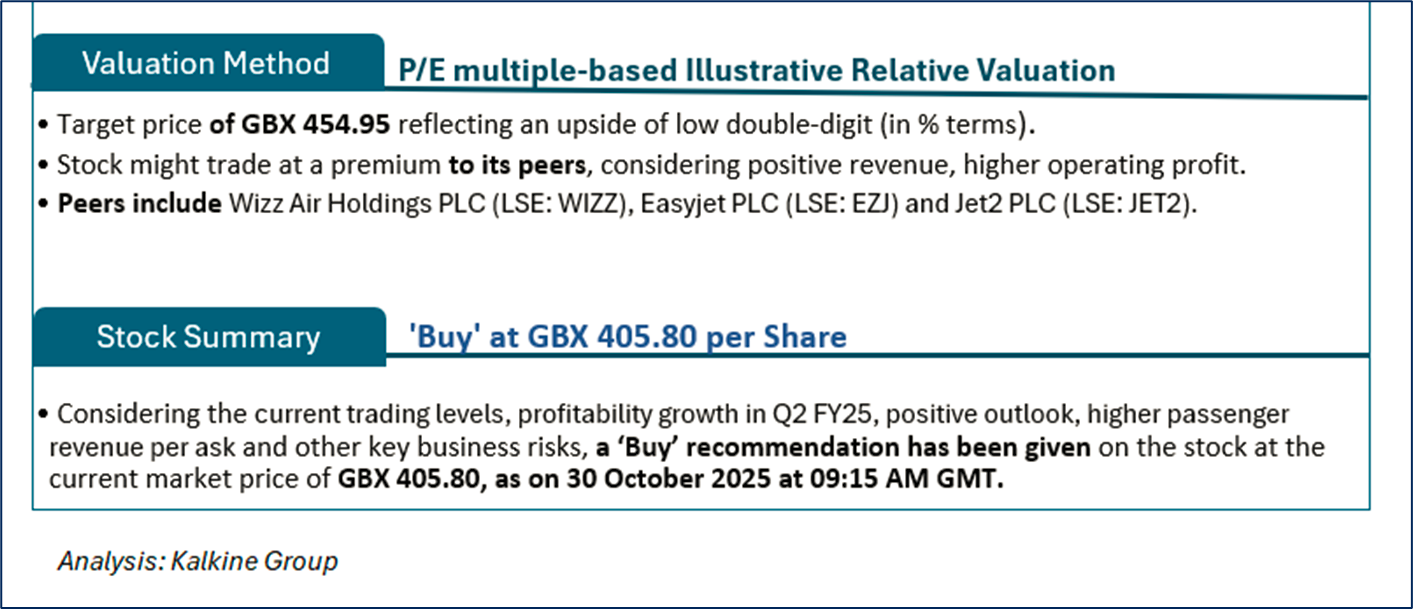
Section 4: Stock Recommendation Summary

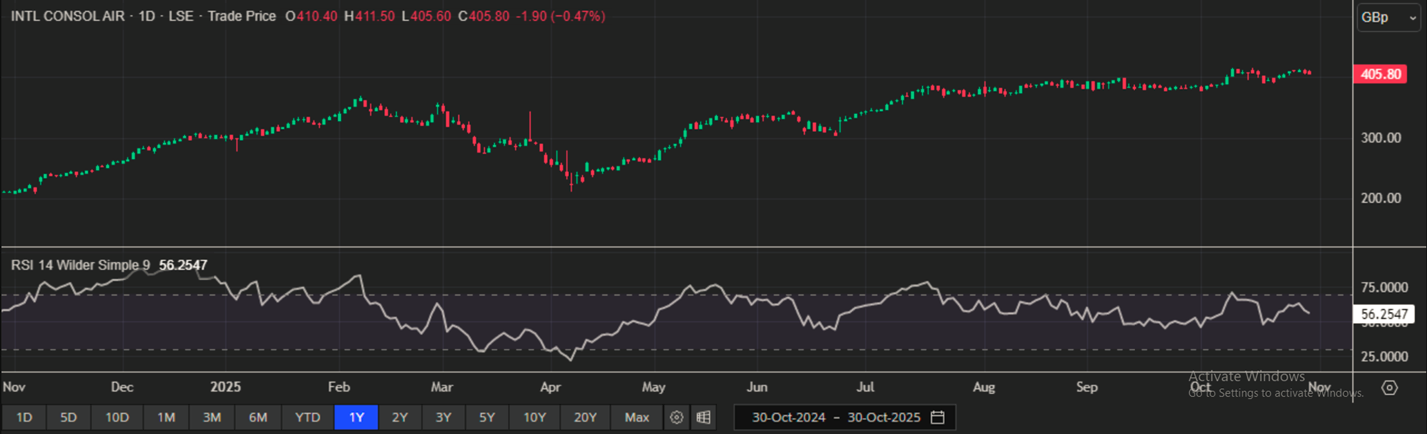
One Year Technical Price Chart (as of October 30, 2025). Source: REFINITIV, Analysis: Kalkine Group

Markets are trading in a highly volatile zone currently due to certain macroeconomic issues and geopolitical tensions prevailing. Therefore, it is prudent to follow a cautious approach while investing.
Note 1: Past performance is not a reliable indicator of future performance.
Note 2: The reference date for all price data, currency, technical indicators, support, and resistance level is 30 October 2025. The reference data in this report has been partly sourced from REFINITIV.
Note 3: Investment decisions should be made depending on an individual's appetite for upside potential, risks, holding duration, and any previous holdings. An 'Exit' from the stock can be considered if the Target Price mentioned as per the Valuation and or the technical levels provided have been achieved and is subject to the factors discussed above.
Note 4: Target Price refers to a price level which the stock is expected to reach as per the relative valuation method and technical analysis taking into consideration both short-term and long-term scenarios.
Note 5: ‘Kalkine reports are prepared based on the stock prices captured either from the London Stock Exchange (LSE) and REFINITIV. Typically, both sources (LSE and or REFINITIV) may reflect stock prices with a delay which could be a lag of 15-20 minutes. There can be no assurance that future results or events will be consistent with the information provided in the report. The information is subject to change without any prior notice.
Note 6: Dividend Yield may vary as per the stock price movement.
Technical Indicators Defined: -
Support: A level at which the stock prices tend to find support if they are falling, and a downtrend may take a pause backed by demand or buying interest. Support 1 refers to the nearby support level for the stock and if the price breaches the level, then Support 2 may act as the crucial support level for the stock.
Resistance: A level at which the stock prices tend to find resistance when they are rising, and an uptrend may take a pause due to profit booking or selling interest. Resistance 1 refers to the nearby resistance level for the stock and if the price surpasses the level, then Resistance 2 may act as the crucial resistance level for the stock.
Stop-loss: It is a level to protect further losses in case of unfavourable movement in the stock prices.
Past performance is not a reliable indicator of future performance.

 Please wait processing your request...