Section 1: Company Overview and Fundamentals
1.1 Company Overview:
IREN Limited (NASDAQ: IREN) is an Australia-based company, which owns and operates data centers powered by 100% renewable energy. Its facilities are optimized for Bitcoin mining, artificial intelligence (AI) cloud services, and other power-dense compute. Its data center mining facilities are in Canal Flats, Mackenzie, Prince George and Childress. Bitcoin Mining provides security to the Bitcoin network.
Kalkine’s American Tech Report covers the Company Overview, Key positives & negatives, Investment summary, Key investment metrics, Top 10 shareholding, Business updates and insights into company recent financial results, Key Risks & Outlook, Price performance and technical summary, Target Price, and Recommendation on the stock.
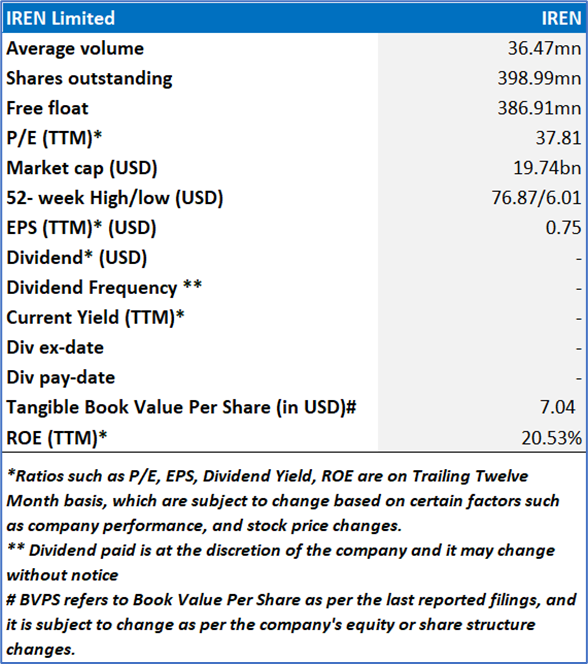
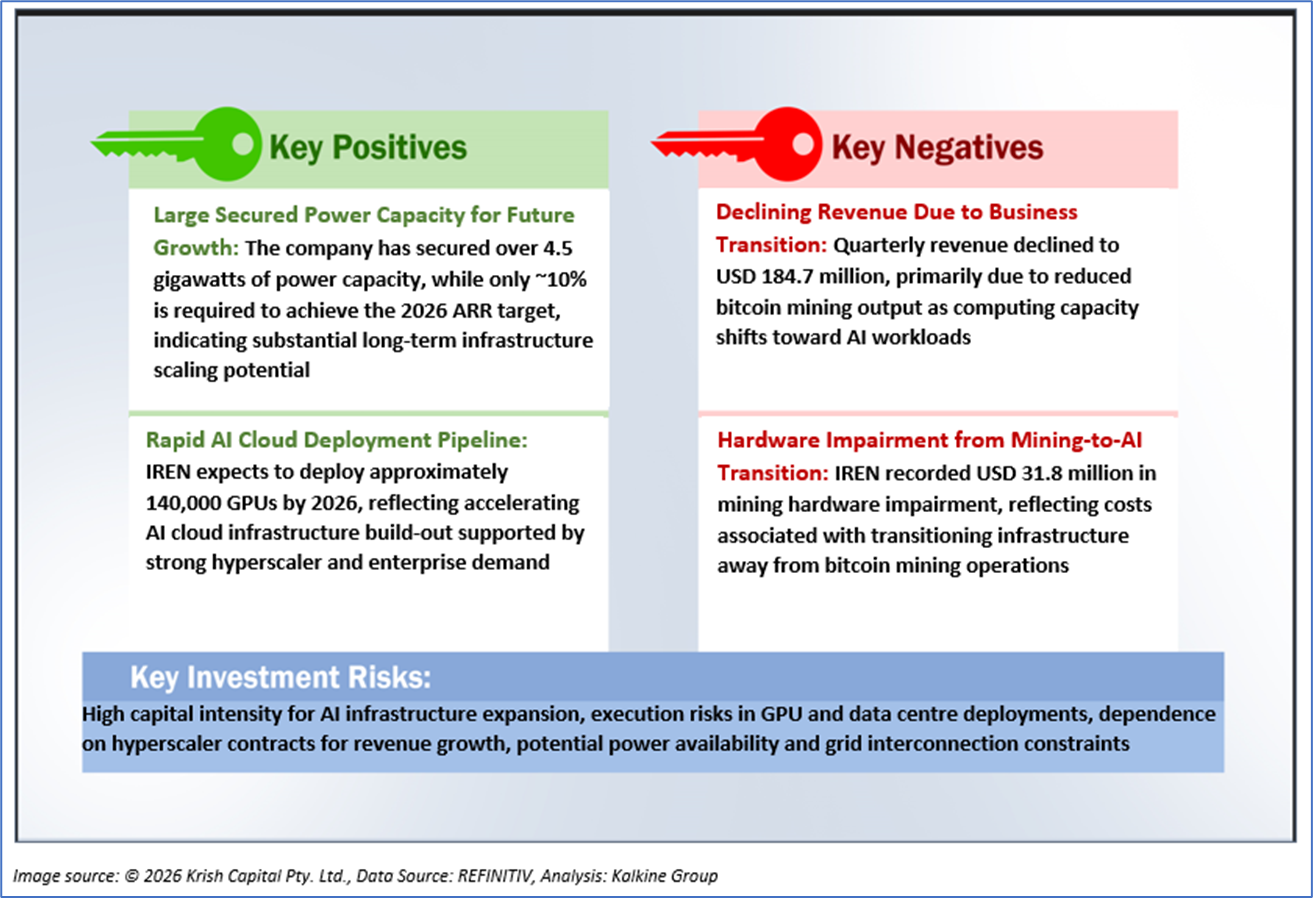
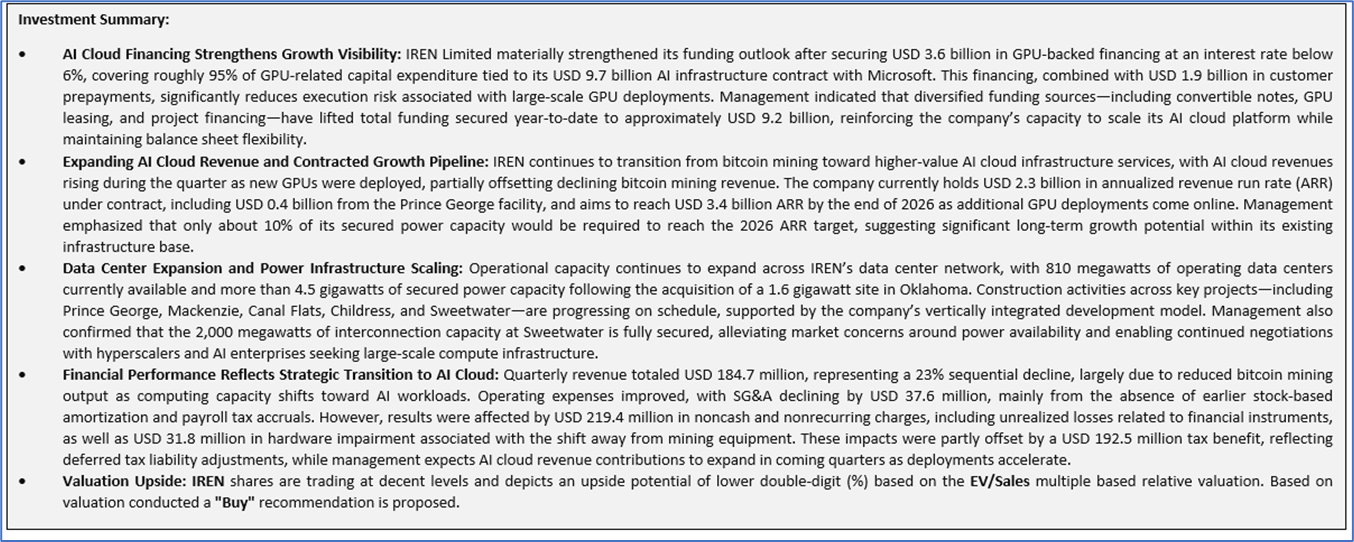
1.2 The Key Positives, Negatives, and Investment summary
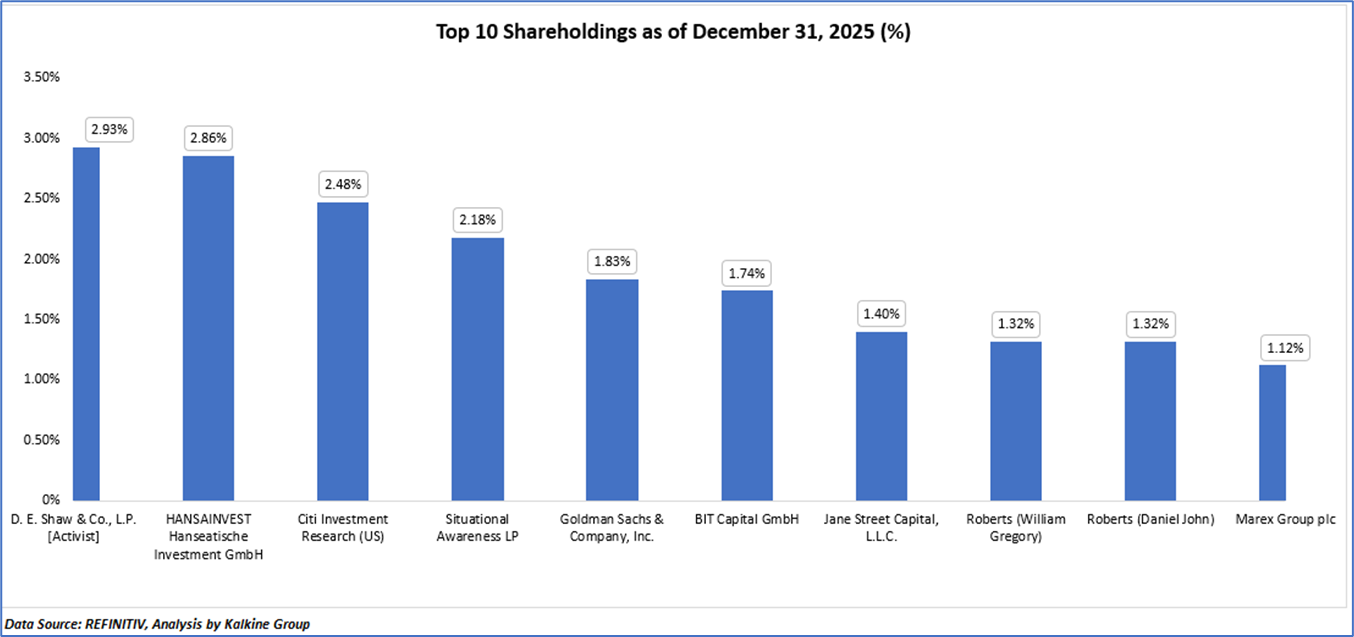
1.3 Top 10 shareholders:
The top 10 shareholders together form ~19.17% of the total shareholding, signifying dispersed shareholding. D. E. Shaw & Co., L.P. [Activist] and HANSAINVEST Hanseatische Investment GmbH are the biggest shareholders, holding the maximum stake in the company at ~2.93% and ~2.86%, respectively.
1.4 Key Metrics:
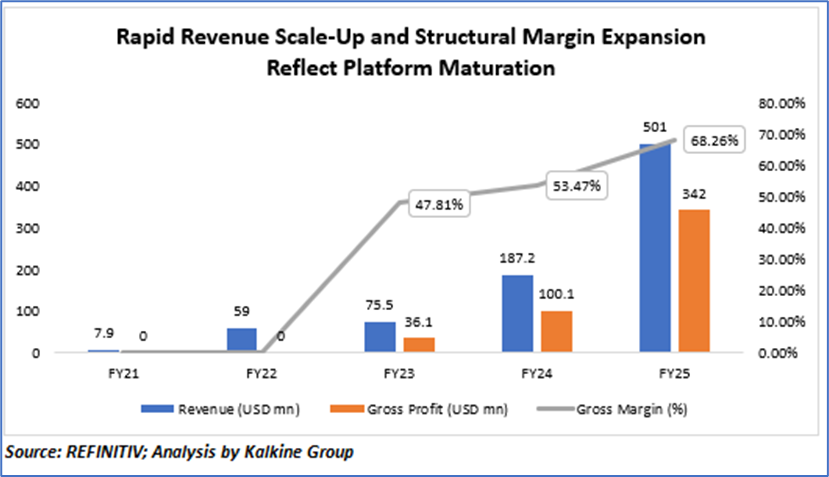
IREN Limited (IREN) has demonstrated a strong hyper-growth trajectory, with revenue scaling from USD 7.9 million in FY21 to USD 501 million in FY25, reflecting exponential expansion driven by Bitcoin mining scale-up and early AI cloud monetization, consistent with reported ~168% YoY growth in FY25 alone. At the same time, profitability has improved materially, with gross profit rising from negligible levels to USD 342 million in FY25, while gross margins expanded sharply from near zero to ~68%, indicating significant operating leverage and improved unit economics. This margin expansion highlights the company’s transition toward higher-value compute services and efficiency gains in energy and infrastructure utilization. However, the financial profile remains influenced by business mix shifts, particularly the transition from volatile Bitcoin mining to more stable AI cloud revenues, suggesting that while growth and margins are structurally improving, sustainability will depend on successful execution of the AI pivot and continued scaling of high-margin compute services.
Section 2: Business Updates and Financial Highlights
2.1 Recent Updates:
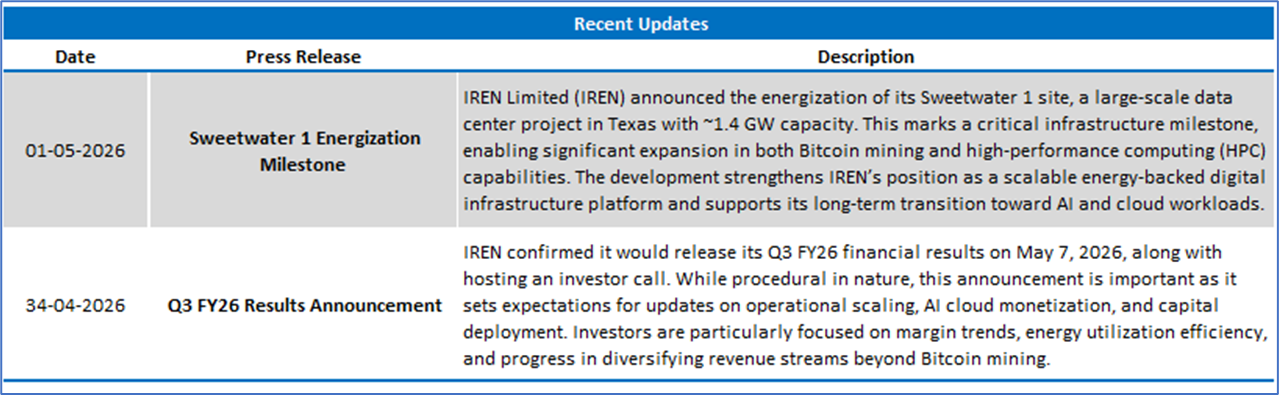
The below picture gives an overview of the recent updates:
2.2 Insights of Q2FY26:
Section 3: Key Risks and Outlook:
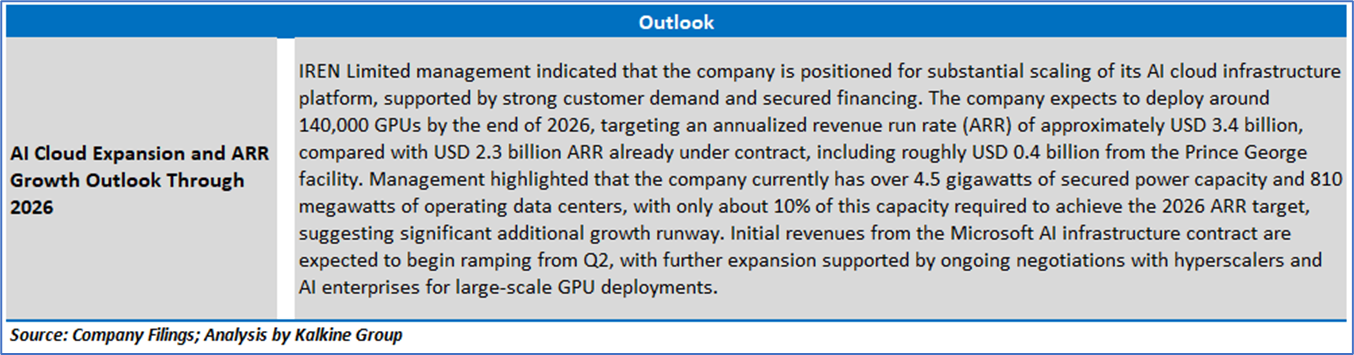
Section 4: Stock Recommendation Summary:
4.1 Technical Summary:
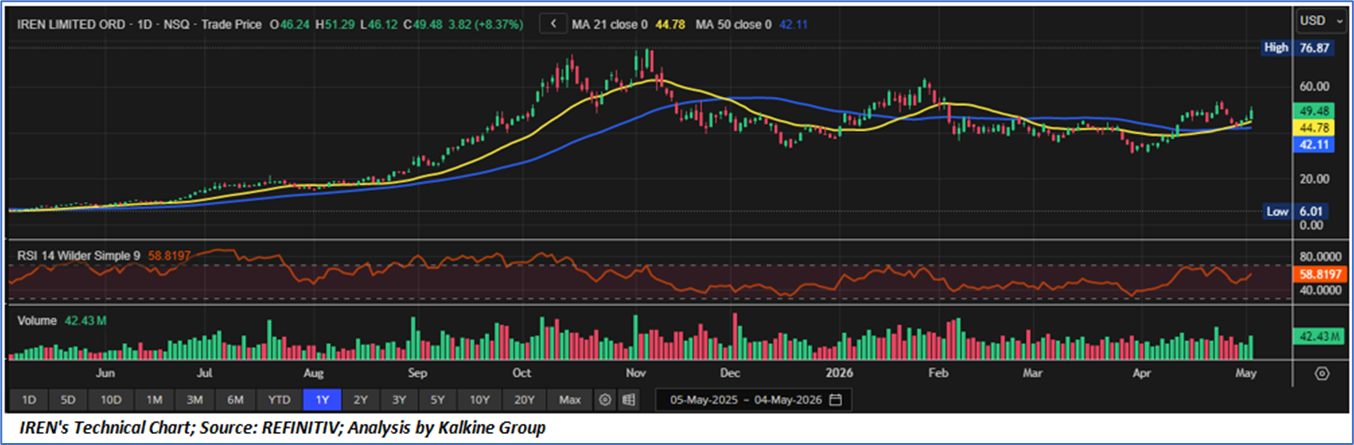
Price Performance:
- Trend Structure and Moving Average Alignment: IREN Limited (IREN) is currently exhibiting a bullish trend continuation, supported by price trading above both the 21-day (~USD 44.8) and 50-day (~USD 42.1) moving averages. The upward slope of these averages indicates strengthening trend momentum, while the recent breakout toward the USD 49–50 zone reflects renewed buying interest after a period of consolidation. Importantly, the stock has formed higher lows over recent weeks, suggesting accumulation and a shift from corrective structure to trend resumption. Sustained price action above the 21-day moving average reinforces near-term bullish bias.
- Momentum Indicators and RSI Behaviour: Momentum remains constructive, with RSI positioned near ~58–60, indicating a balanced but bullish momentum profile without entering overbought territory. This mid-to-upper RSI range typically supports trend continuation, as it reflects steady buying pressure rather than exhaustion. Additionally, the absence of sharp RSI spikes suggests that the current move is more structurally driven rather than speculative. If RSI sustains above the 55–60 range, it would confirm ongoing momentum strength, while a move toward 70 could signal acceleration in the uptrend.
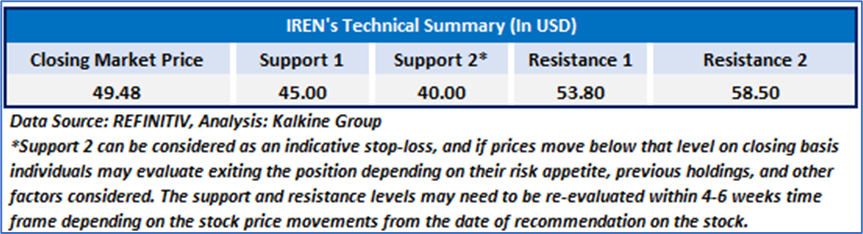
- Volume Dynamics and Key Technical Levels: Volume trends show periodic spikes during upward price moves, indicating institutional participation and accumulation phases, although not yet at extreme breakout levels. From a key levels perspective, immediate support is established near the USD 44–45 zone (21-day MA), followed by stronger support around USD 42 (50-day MA). On the upside, resistance is observed near the USD 50–52 range, with a breakout above this level potentially opening room toward previous highs. Overall, the setup suggests a bullish continuation structure, contingent on sustained volume support and holding above key moving averages.
4.2 Fundamental Valuation
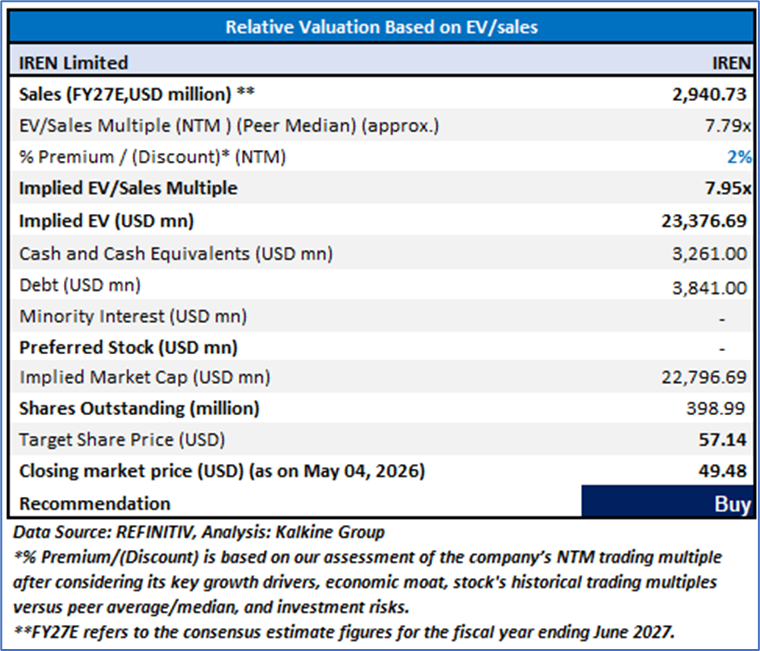
Valuation Methodology: EV/Sales Multiple Based Relative Valuation
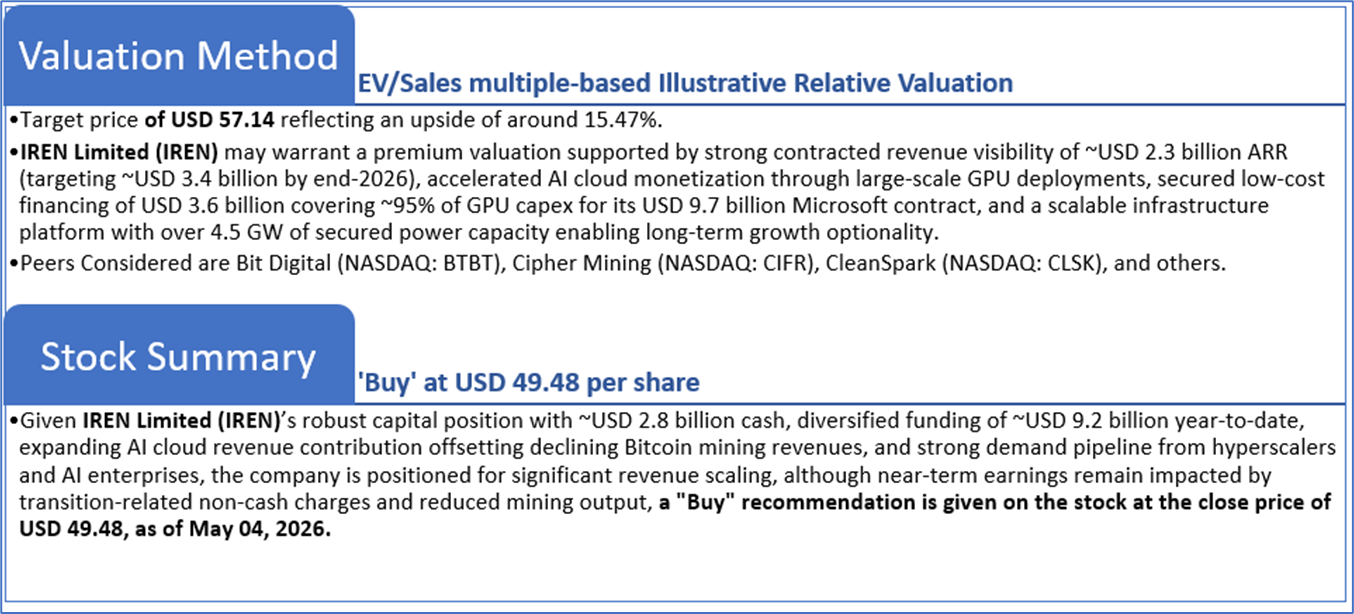
Markets are trading in a highly volatile zone currently due to certain macroeconomic issues and geopolitical tensions prevailing. Therefore, it is prudent to follow a cautious approach while investing.
Note 1: Past performance is not a reliable indicator of future performance.
Note 2: The reference date for all price data, currency, technical indicators, support, and resistance levels is May 04, 2026. The reference data in this report has been partly sourced from REFINITIV.
Note 3: Investment decisions should be made depending on an individual's appetite for upside potential, risks, holding duration, and any previous holdings. An 'Exit' from the stock can be considered if the Target Price mentioned as per the Valuation and or the technical levels provided has been achieved and is subject to the factors discussed above.
Note 4: The report publishing date is as per the Pacific Time Zone.
Technical Indicators Defined: -
Support: A level at which the stock prices tend to find support if they are falling, and a downtrend may take a pause backed by demand or buying interest. Support 1 refers to the nearby support level for the stock and if the price breaches the level, then Support 2 may act as the crucial support level for the stock.
Resistance: A level at which the stock prices tend to find resistance when they are rising, and an uptrend may take a pause due to profit booking or selling interest. Resistance 1 refers to the nearby resistance level for the stock and if the price surpasses the level, then Resistance 2 may act as the crucial resistance level for the stock.
Stop-loss: It is a level to protect against further losses in case of unfavorable movement in the stock prices.
Past performance is not a reliable indicator of future performance.

 NZ
 UK
 US
 AU
 IND

 CA

 Please wait processing your request...