Section1: Commodity Update:
The green energy transition is expected to significantly increase copper demand, driven by its essential role in electricity networks and clean energy technologies, including electric vehicles. The copper price is hovering near the highest levels in nine months after US President Donald Trump suggested that he could impose 25% tariffs on copper imports. Recently, copper prices surged more than 5% following Trump's remarks during a joint session of the US Congress, which contradicted earlier statements that any potential levies on the metal were still under investigation by the Department of Commerce and would be implemented later in the year. Such a move would increase reliance on domestic production, which is limited to just two major smelters, as the US imports nearly half of its copper.
Data Source: Government of Canada
Section 2: Company Overview and Fundamental Insights
2.1 Company Overview:
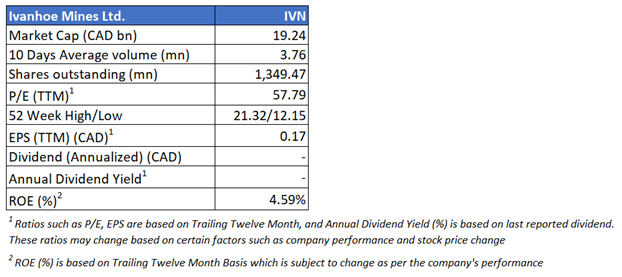
Ivanhoe Mines Ltd (TSX: IVN) is a mineral exploration and development company. The company, together with its subsidiaries, explores, develops, and recovers minerals and precious gems from its property interests located in Africa. The group explores platinum, nickel, copper, gold, silver, cobalt, iron, vanadium, and chrome.
Kalkine’s Resource Report covers the Investment Highlights, Key Financial Metrics, Risks, Technical Analysis along with the Valuation, Target Price, and Recommendation on the stock.
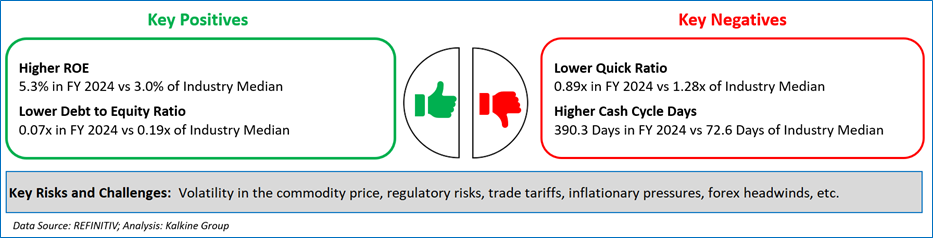
2.2 The Key Positives, Negatives, Investment Highlights and Risks
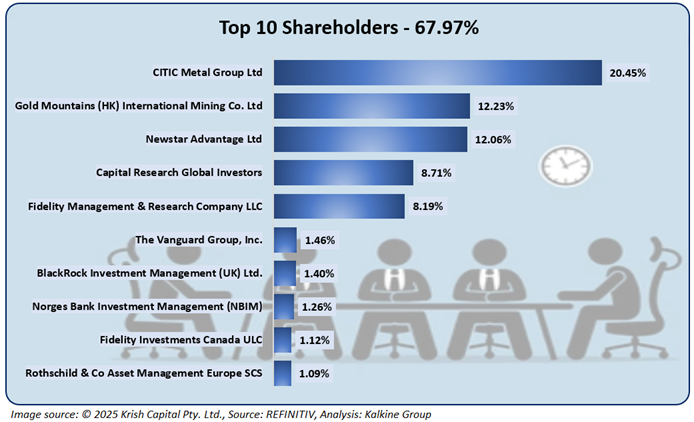
2.3 Top 10 Shareholders:
The top 10 owners represent around 67.97% of the total shareholding. CITIC Metal Group Ltd and Gold Mountains (HK) International Mining Co. Ltd have the most holding in the company, at 20.45% and ~12.23%, respectively.
2.4 Key Metrics:
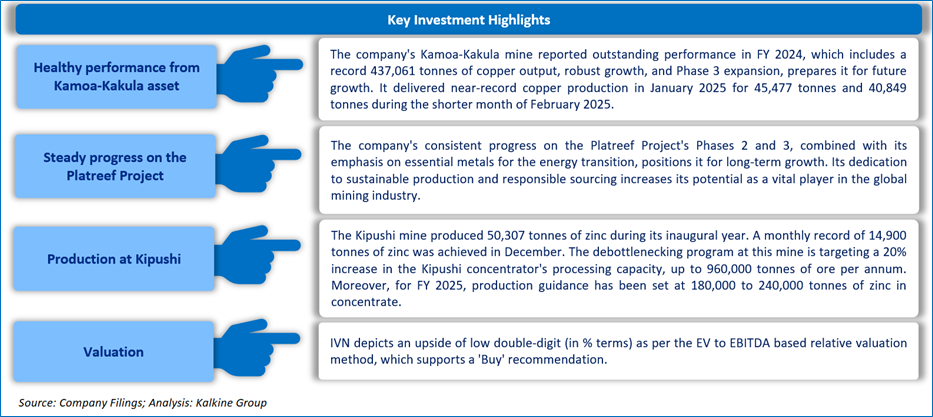
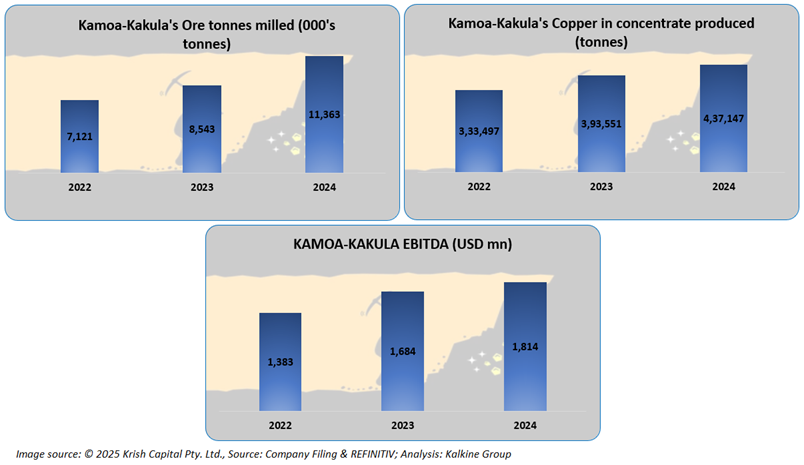
In FY 2024, the company's KAMOA-KAKULA mine recorded higher ore milling and copper concentrate production numbers than the previous similar period, which is a significant positive. Furthermore, it reported greater EBITDA, demonstrating persistence and versatility.
Section 3: Business Updates and Financial Highlights
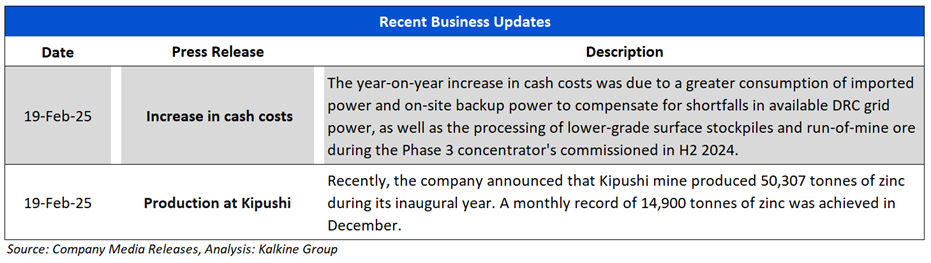
3.1 Recent Updates: The image below depicts an overview of the company's recent actions; here, the company presented information about increased cash costs and production at Kipushi mine.
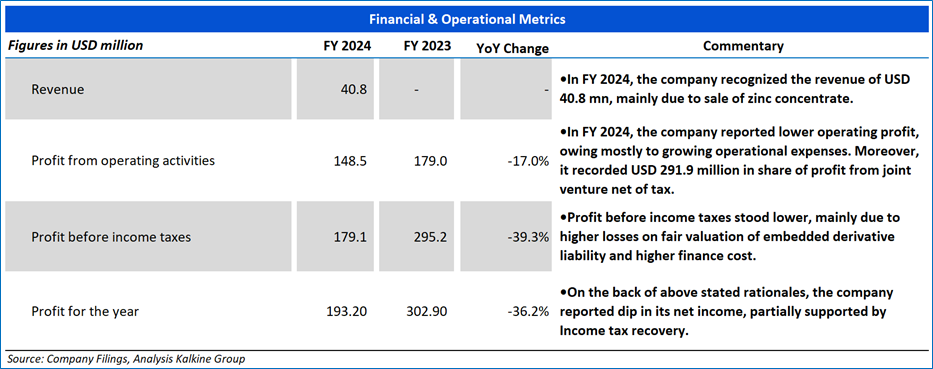
3.2 Insights on FY 2024 Financial Performance:
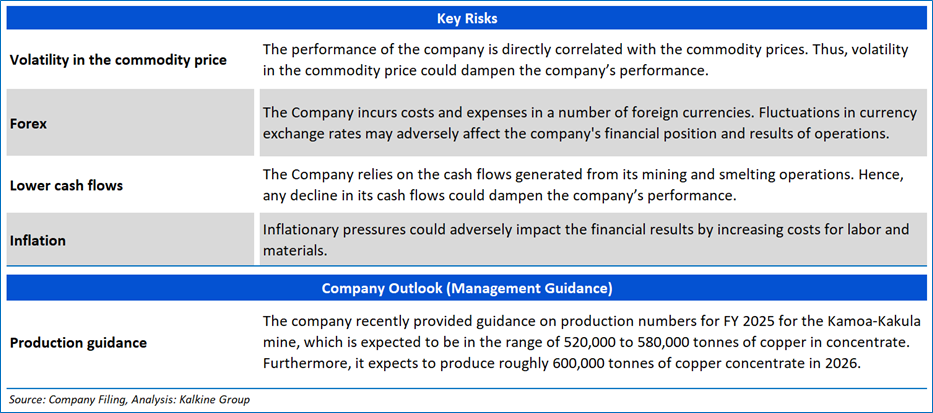
Section 4: Key Risks, Company Outlook:
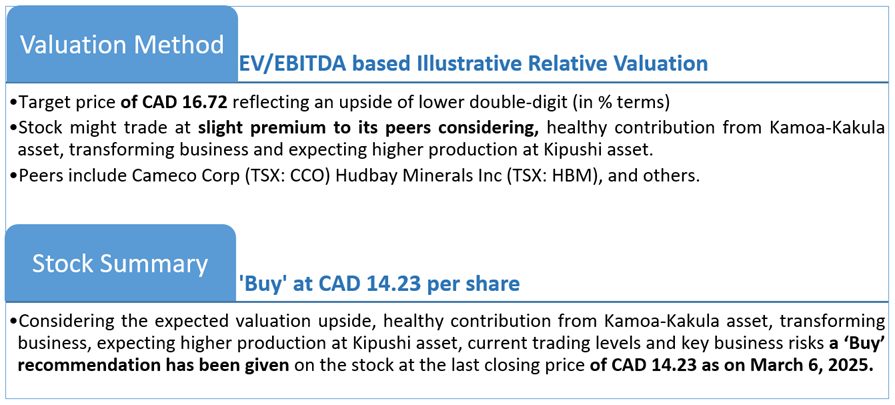
Section 5: Stock Recommendation Summary:
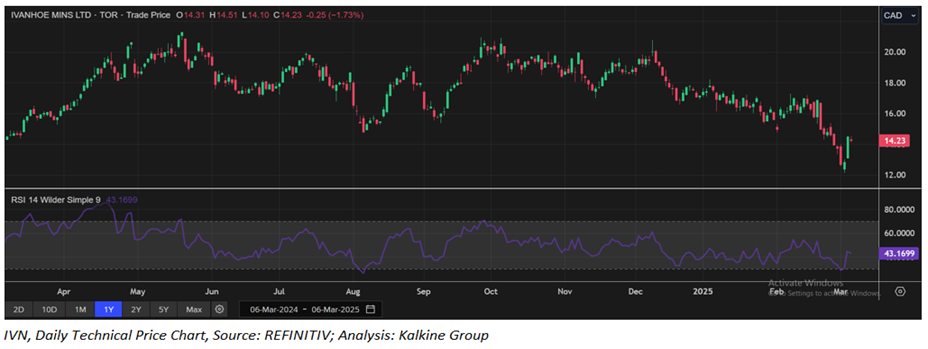
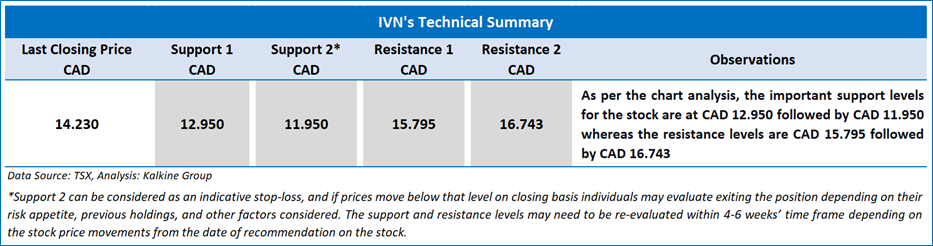
5.1 Price Performance and Technical Summary:

In one week, the stock increased by ~2.15%, but it decreased by ~10.55% in the last one month. Furthermore, the company is trading below its average 52-week high of CAD 21.32 and a 52-week low of CAD 12.15, creating an opportunity to accumulate the stock.
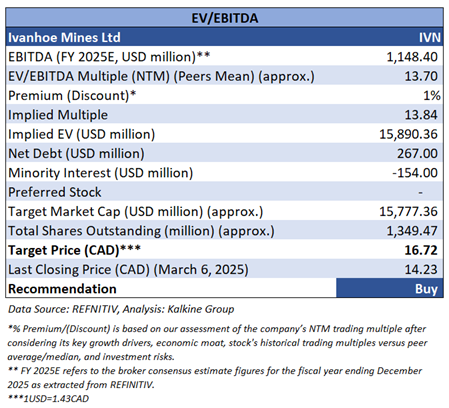
5.2 Fundamental Valuation
Valuation Methodology: EV/EBITDA Multiple Based Relative Valuation (Illustrative)
Markets are trading in a highly volatile zone currently due to certain macroeconomic issues and geopolitical tensions prevailing. Therefore, it is prudent to follow a cautious approach while investing.
Note 1: Past performance is not a reliable indicator of future performance.
Note 2: The reference date for all price data, currency, technical indicators, support, and resistance levels as on March 6, 2025. The reference data in this report has been partly sourced from REFINITIV.
Note 3: Investment decisions should be made depending on an individual's appetite for upside potential, risks, holding duration, and any previous holdings. An 'Exit' from the stock can be considered if the Target Price mentioned as per the Valuation and or the technical levels provided has been achieved and is subject to the factors discussed above.
Note 4: Dividend Yield may vary as per the stock price movement.
Note 5: Kalkine reports are prepared based on the stock prices captured either from REFINITIV or Trading View. Typically, REFINITIV or Trading View may reflect stock prices with a delay which could be a lag of 25-30 minutes. There can be no assurance that future results or events will be consistent with the information provided in the report. The information is subject to change without any prior notice.
Technical Indicators Defined: -
Support: A level at which the stock prices tend to find support if they are falling, and a downtrend may take a pause backed by demand or buying interest.
Resistance: A level at which the stock prices tend to find resistance when they are rising, and the uptrend may take a pause due to profit booking or selling interest.
Stop-loss: In general, it is a level to protect further losses in case of any unfavorable movement in the stock prices.
Past performance is not a reliable indicator of future performance.

 Please wait processing your request...