Section1: Commodity Update:
Gold is Canada’s most valuable mined commodity, with a production value of $15.1 billion in 2023. Gold is mined in ten Canadian provinces and territories, mostly in Ontario and Quebec, which together accounted for 70% of Canada’s total gold output in 2023. In 2023, Canada ranked as the fourth-largest gold producer globally, with its mines yielding nearly 200 tonnes of gold. In 2023, the value of Canadian gold exports reached $30.2 billion, a 34% increase from $22.5 billion in 2022. This surge was fueled by rising gold prices and strong demand from central banks seeking to diversify reserves and hedge against inflation and geopolitical risks. The market outlook suggests that if inflation stabilizes and interest rates fall, demand for gold could grow further as lower rates reduce the opportunity cost of holding non-yielding assets like gold, making it more attractive compared to interest-bearing investments such as bonds.
Data Source: Government of Canada
Section2: Company Overview and Fundamental Insights:
2.1 Company Overview:
Jaguar Mining Inc. (TSX: JAG) is a junior gold mining company based in Brazil that focuses on the acquisition, exploration, development, and operation of gold-producing properties in the Iron Quadrangle, a prolific greenstone belt located in Minas Gerais, Brazil.
Kalkine’s Penny Report covers the Investment Highlights, Key Financial Metrics, Risks, Technical Analysis along with the Valuation, Target Price, and Recommendation on the stock.
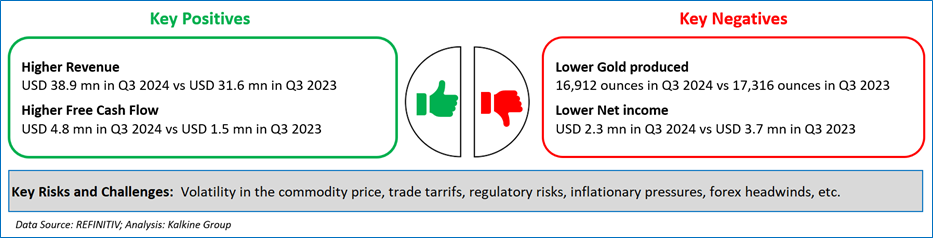
2.2 The Key Positives, Negatives, Investment Highlights and Risks
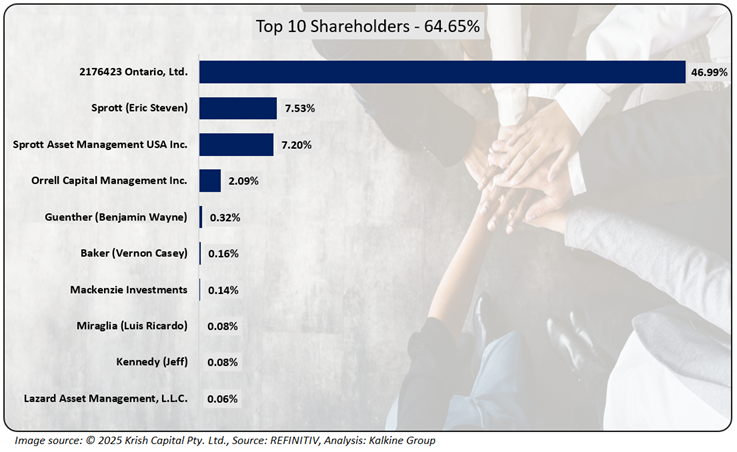
2.3 Top 10 Shareholders:
The top 10 shareholders together form ~64.65% of the total shareholding. 2176423 Ontario, Ltd. and Sprott (Eric Steven) hold a maximum stake in the company at ~46.99% and ~7.53%, respectively.
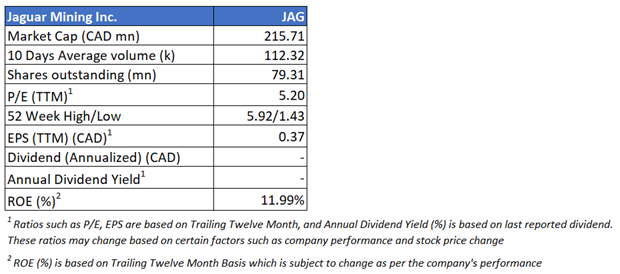
2.4 Key Metrics:
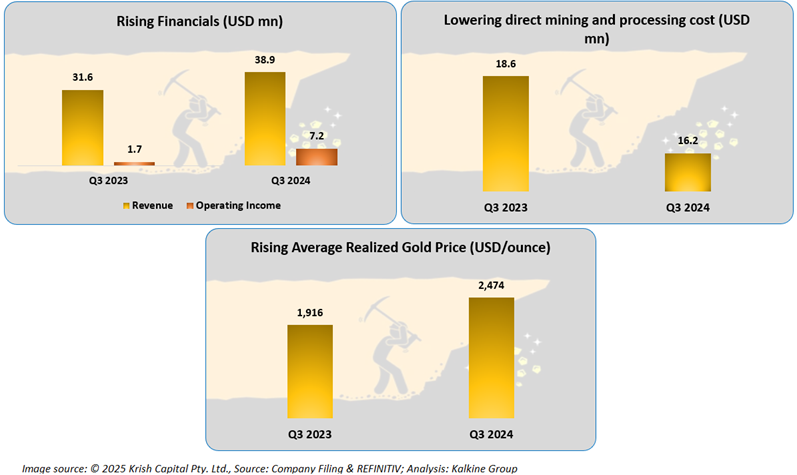
The company reported higher financials in Q3 2024 compared to Q3 2023, where it witnessed growth in its revenue as well as in operating income. Furthermore, it clocked lower direct mining and processing costs and elevated realized gold prices in the same reported period, which is a key positive.
Section 3: Business Updates and Financial Highlights
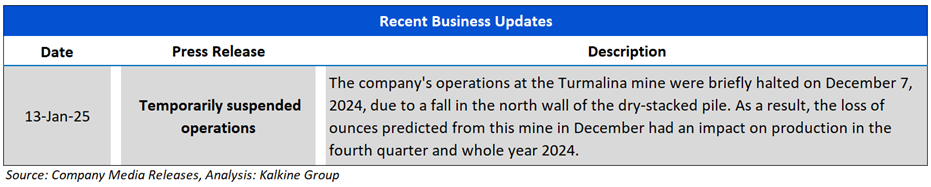
3.1 Recent Updates: The below picture gives an overview of the company’s recent activity, such as an announcement regarding temporarily suspended operations at one of its mines.
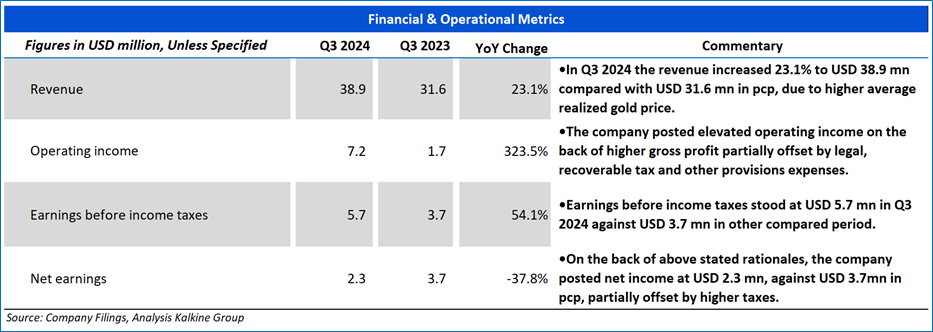
3.2 Insights on Q3 2024 Financial Performance:
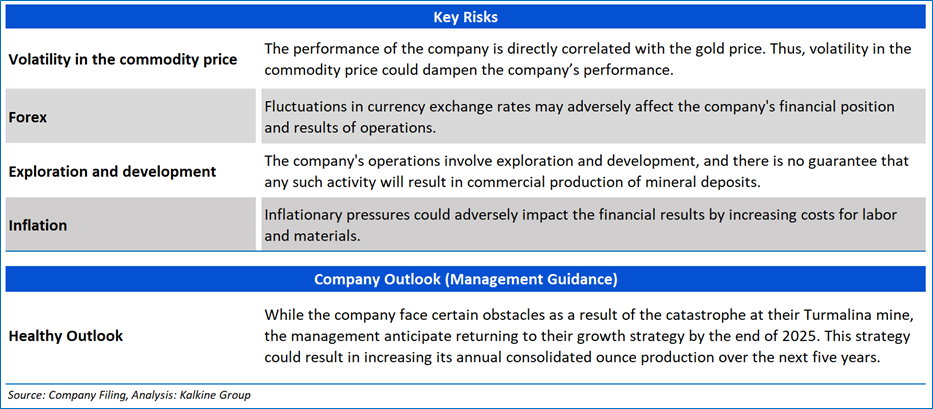
Section 4: Key Risks and Company Outlook
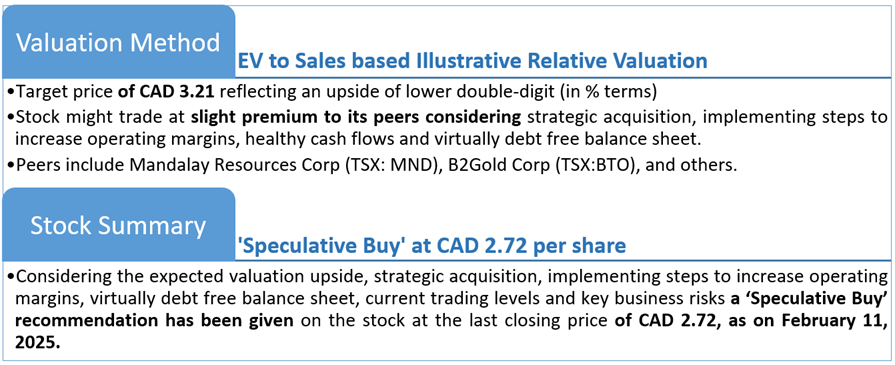
Section 5: Stock Recommendation Summary:
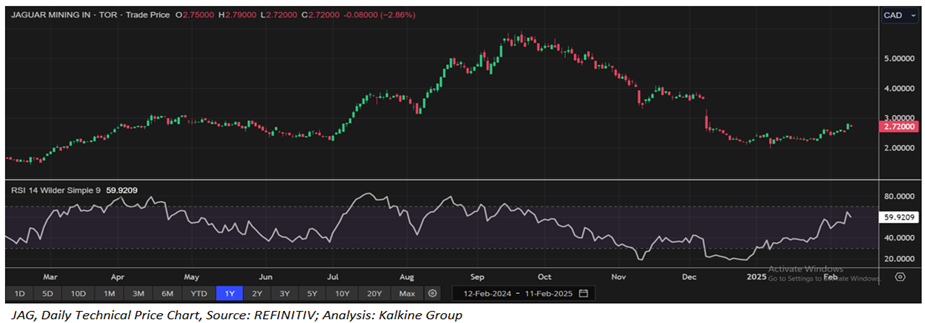
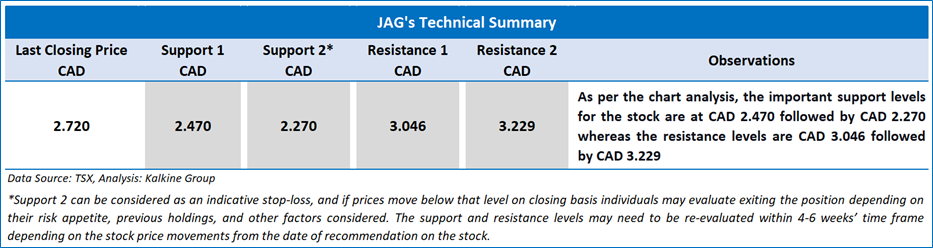
5.1 Price Performance and Technical Summary:

The stock has witnessed an upside of ~8.80% and ~20.88% over the last 1 week and 1 month respectively. Moreover, the stock is trading below the average 52-week high price of CAD 5.92 and 52-week low price of CAD 1.43 providing an opportunity to accumulate the stock.
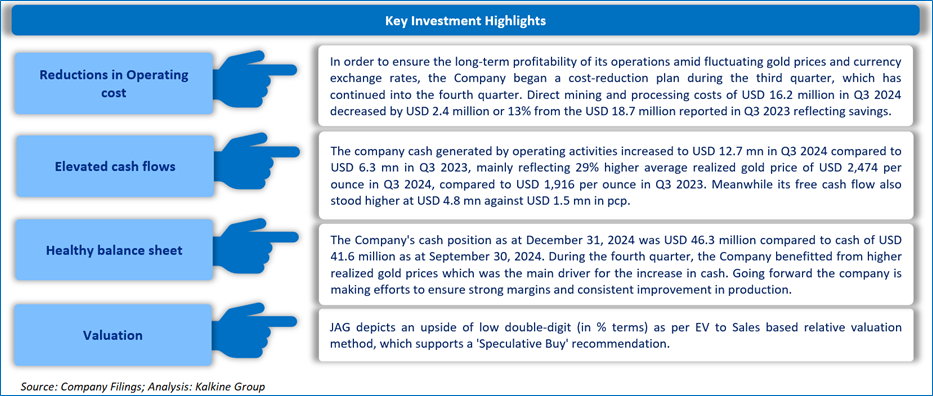
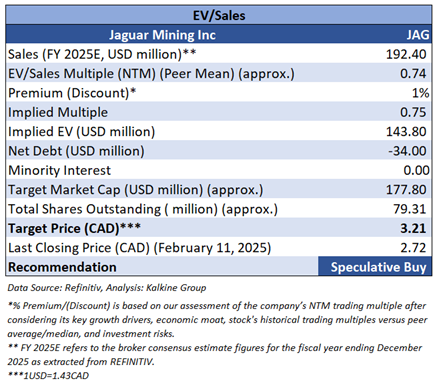
5.2 Fundamental Valuation
Valuation Methodology: EV to Sales Based Relative Valuation (Illustrative)
Markets are trading in a highly volatile zone currently due to certain macroeconomic issues and geopolitical tensions prevailing. Therefore, it is prudent to follow a cautious approach while investing.
Note 1: Past performance is not a reliable indicator of future performance.
Note 2: The reference date for all price data, currency, technical indicators, support, and resistance levels is February 11, 2025. The reference data in this report has been partly sourced from REFINITIV.
Note 3: Investment decisions should be made depending on an individual's appetite for upside potential, risks, holding duration, and any previous holdings. An 'Exit' from the stock can be considered if the Target Price mentioned as per the Valuation and or the technical levels provided has been achieved and is subject to the factors discussed above.
Note 4: Dividend Yield may vary as per the stock price movement.
Note 5: Kalkine reports are prepared based on the stock prices captured either from REFINITIV or Trading View. Typically, REFINITIV or Trading View may reflect stock prices with a delay which could be a lag of 25-30 minutes. There can be no assurance that future results or events will be consistent with the information provided in the report. The information is subject to change without any prior notice.
Technical Indicators Defined: -
Support: A level at which the stock prices tend to find support if they are falling, and a downtrend may take a pause backed by demand or buying interest. Support 1 refers to the nearby support level for the stock and if the price breaches the level, then Support 2 may act as the crucial support level for the stock.
Resistance: A level at which the stock prices tend to find resistance when they are rising, and an uptrend may take a pause due to profit booking or selling interest. Resistance 1 refers to the nearby resistance level for the stock and if the price surpasses the level, then Resistance 2 may act as the crucial resistance level for the stock.
Stop-loss: It is a level to protect further losses in case of unfavourable movement in the stock prices.
Past performance is not a reliable indicator of future performance.

 Please wait processing your request...