Kalkine’s Global Travel & Leisure Report offers a comprehensive view of the key companies and evolving trends across the travel value chain covering countries including US, Canada, Australia, UK, and New Zealand. This includes airlines, hospitality chains, digital travel platforms, as well as the rapidly growing leisure, entertainment, and gaming segments that are redefining the way people engage with travel experiences.

Airline Service and Cargo Market: A Dynamic Growth Trajectory:
- Global aviation revenues reached ~USD 970–990 billion in 2024, with passenger traffic recovering to ~102% of 2019 levels, signaling a fully normalized demand environment.
- 2025 passenger demand is projected to grow ~5–6% YoY, while aircraft delivery delays keep supply tight, supporting stronger fares and load factors.
- North America remains the most profitable region, generating over 60% of global airline net income, driven by strong U.S. leisure travel and diversified revenue models.
- Air cargo volumes are expected to grow ~4% YoY in 2025, with e-commerce–driven demand benefiting carriers with dedicated freighters—relevant for SNCY’s Amazon-based cargo operations.
- Fuel costs remain elevated at ~USD 110–120/bbl equivalent for 2025, maintaining pressure on margins and increasing the competitive advantage of low-cost and hybrid carriers with efficient cost structures.

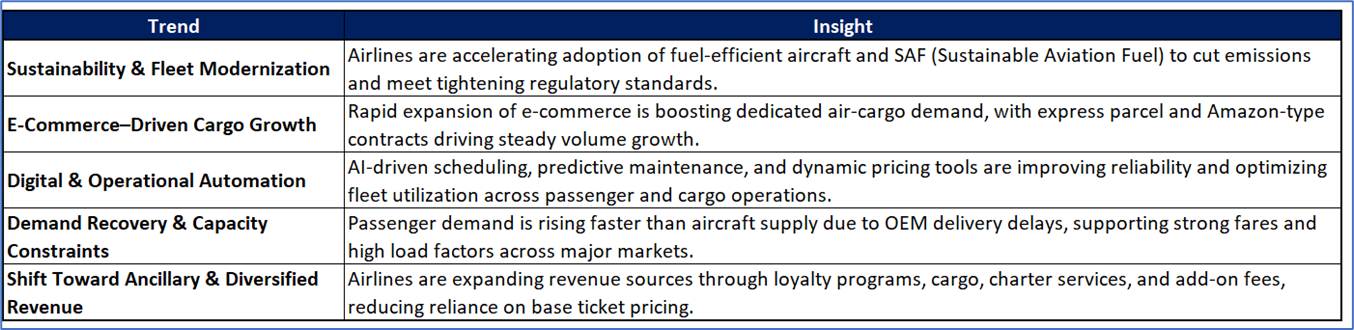

- 2020 – Industry Collapse and Cargo Becomes the Lifeline: The aviation sector suffered an unprecedented contraction, with global passenger traffic down ~65% and airline losses exceeding USD 130 billion, driven by border closures and grounded fleets. Air cargo, supported by booming e-commerce and supply-chain bottlenecks, grew to over 35% of total airline revenue, which is its highest share in history. Cargo yields surged more than 40%, freighter capacity ran at peak utilization, and dedicated cargo operators became essential to global trade continuity.
- 2021 – Domestic Recovery Begins, Cargo Demand Stays Elevated: Passenger demand recovered to ~50% of 2019 levels, led by U.S. leisure travel, with TSA throughput rising steadily from March onward. Airlines restructured fleets, renegotiated leases, and pushed digital ticketing and contactless operations. Cargo volumes grew an additional 6–8%, benefiting from persistent supply-chain disruptions, tight belly capacity, and e-commerce growth exceeding 20% annually. Hybrid carriers with freighter arrangements, like Sun Country, began emerging as operationally advantaged models.
- 2022 – International Reopening, Strong Revenue Rebound, Supply Constraints: Global passenger demand climbed to ~70–75% of 2019, with strong gains in Europe and early APAC reopening phases. Airline revenues recovered to approximately USD 780–800 billion, and load factors improved to 80–81%, though staffing shortages and aircraft delivery delays constrained supply. Cargo performance peaked, with yields still ~25–30% above 2019, supported by resilient e-commerce and high-value goods transport. North America became the first region to exceed its pre-pandemic financial performance.
- 2023 – Full Passenger Recovery and Cargo Normalization at a Higher Base: Passenger traffic returned to 100% of 2019 levels, and global airline revenue exceeded USD 900 billion, marking full top-line recovery. Load factors averaged ~83–84%, among the highest ever recorded. Cargo volumes stabilized as supply chains normalized but yields remained 5–10% above pre-pandemic levels, aided by structural e-commerce demand. Fleet shortages—driven by Boeing/Airbus certification delays—kept supply tight, supporting fare strength and improving unit economics.
- 2024 – Profitability Consolidation and Hybrid Models Gain Momentum: The industry generated ~USD 970–990 billion in revenue and recorded the strongest global profitability since 2010, with North America producing more than 60% of world airline net income. Passenger demand grew ~11%, while capacity increased more slowly due to aircraft delays and pilot shortages, sustaining high load factors. Air cargo revenue normalized but remained above 2019 levels, with e-commerce expanding 15–18% YoY. Airlines increasingly diversified into loyalty monetization, cargo operations, charter services, and ancillary revenue—directly mirroring SNCY’s strategic mix.
- 2025 – Moderation, Structural Tightness, and Strength in Cargo Partnerships: Passenger demand is projected to grow 5–6%, while load factors remain elevated due to continued aircraft delivery constraints. Jet-fuel prices stabilize around USD 110–120/bbl equivalent, keeping cost discipline paramount. Cargo volumes are forecast to rise ~4%, driven by Amazon-style contract flying and cross-border express shipping. North America remains the profit engine of global aviation, supported by strong leisure demand, robust ancillary revenue streams, and stable cargo economics. The industry shifts from rebound to steady, structurally supported growth, favoring flexible operators with diversified revenue—an environment well-suited for Sun Country’s scheduled, charter, and cargo tri-model strategy.
Kalkine’s Global Travel & Leisure Report covers the Investment Highlights, Key Financial Metrics, Risks, Technical Analysis along with the Valuation, Target Price, and Recommendation on JetBlue Airways Corporation (NASDAQ: JBLU).
Section 1: Company Overview and Fundamentals Insights
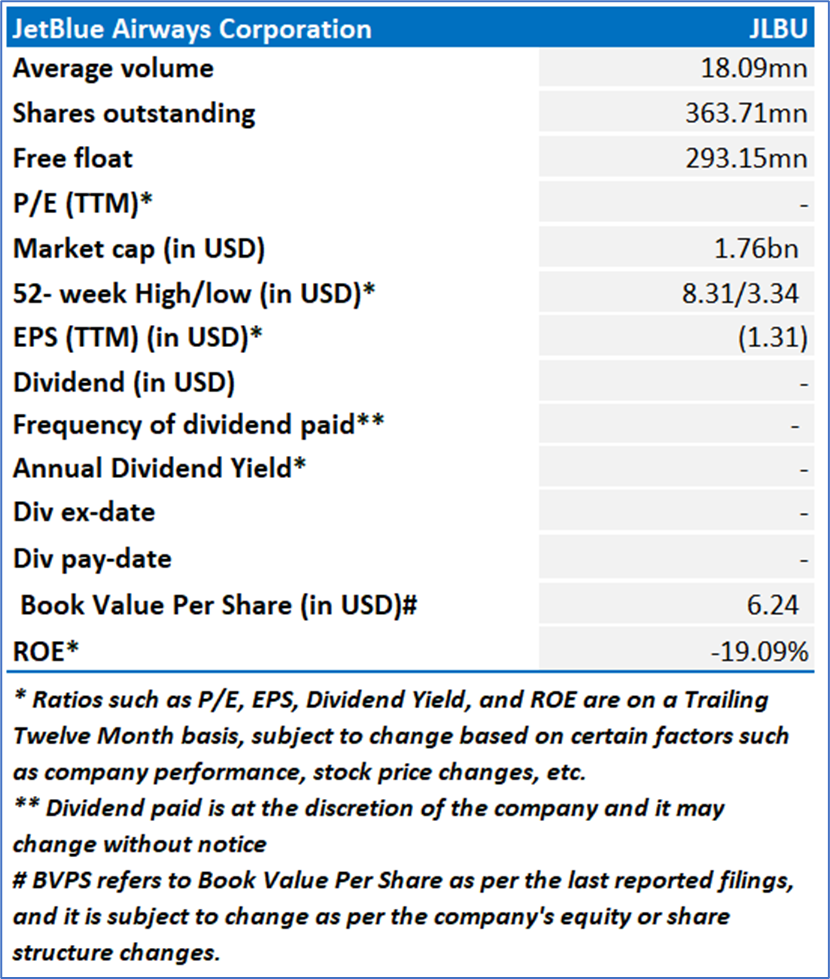
Company Overview: JetBlue Airways Corporation (NASDAQ: JBLU) provides air transportation services across the United States, Latin America, the Caribbean, Canada, and Europe. The Company operates five types of aircraft, including Airbus A220, Airbus A320, Airbus A321, Airbus A321neo, and Embraer E190.
Kalkine’s Global Travel and Leisure Report cover the Investment Highlights, Key Financial Metrics, Risks, and Technical Analysis along with the Valuation, Target Price, and Recommendation on the stock.
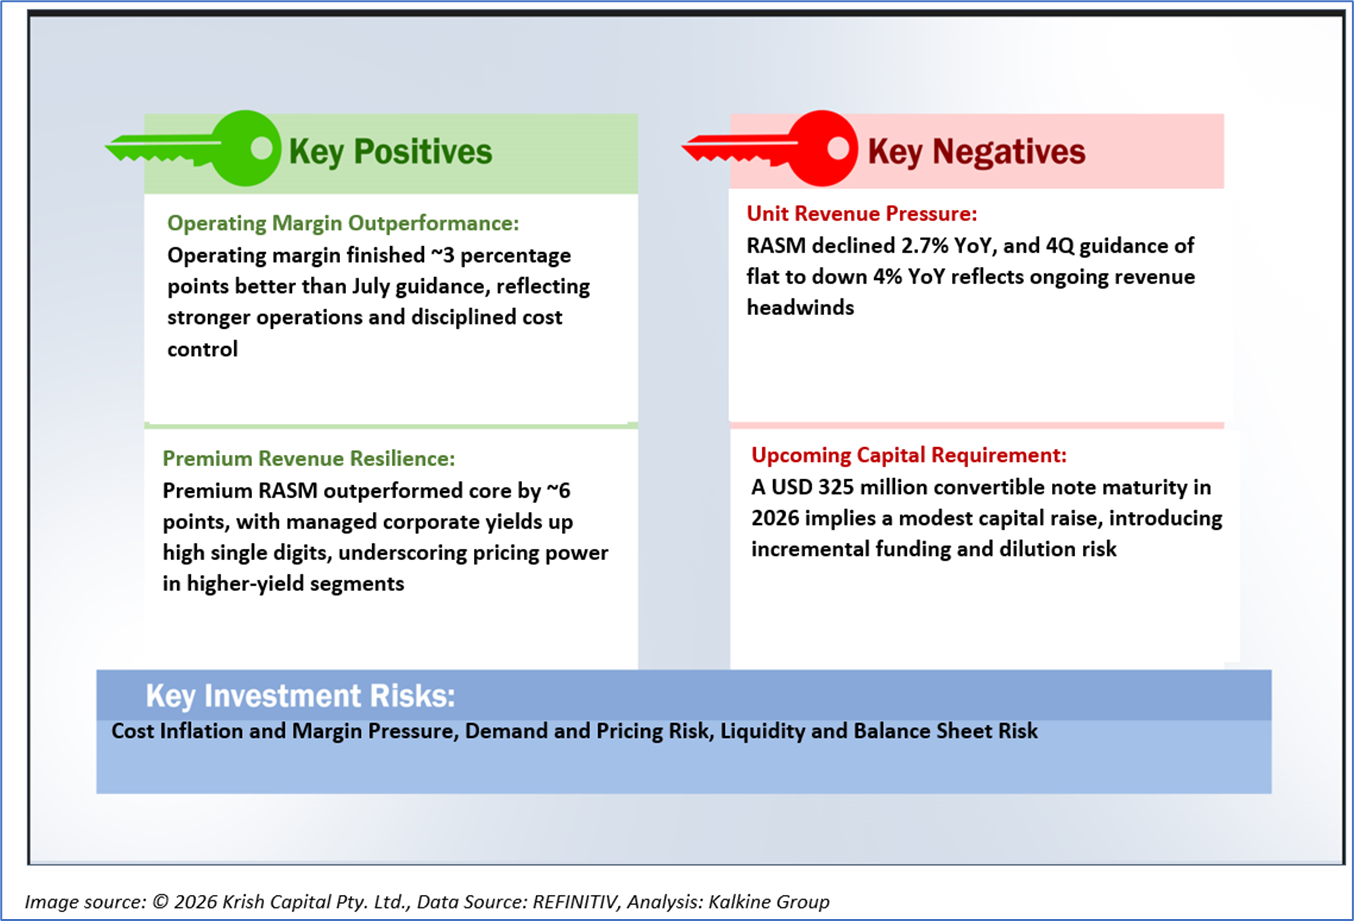
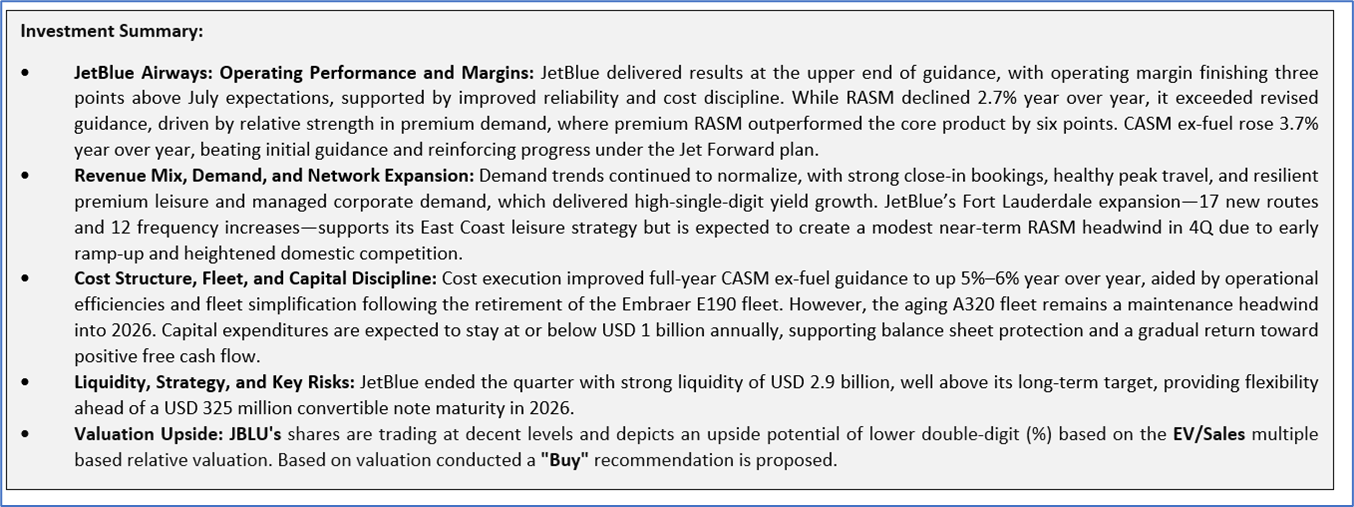
1.2 The Key Positives, Negatives, Investment Highlights, and Risks
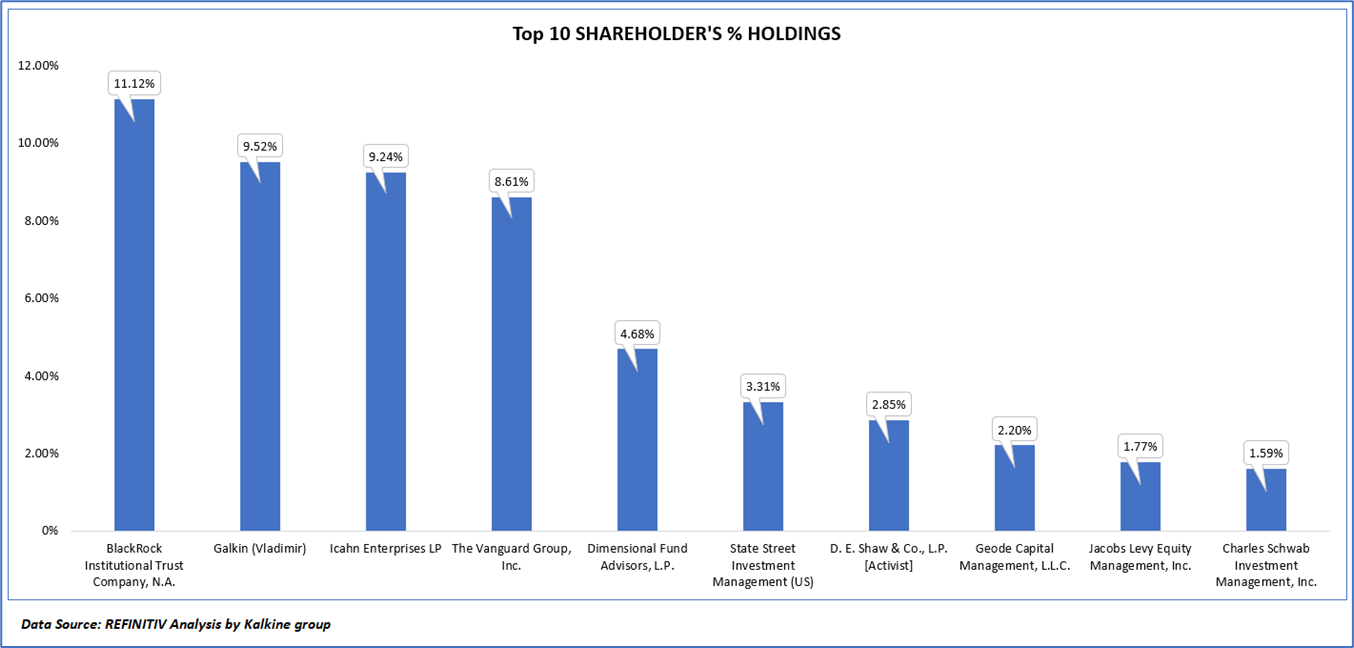
1.3 Top 10 Shareholders:
The top 10 shareholders together form ~54.90% of the total shareholding. BlackRock Institutional Trust Company, N.A. and Galkin (Vladimir) hold maximum stakes of 11.12% and 9.52%, respectively.
1.4 Key Metrics:
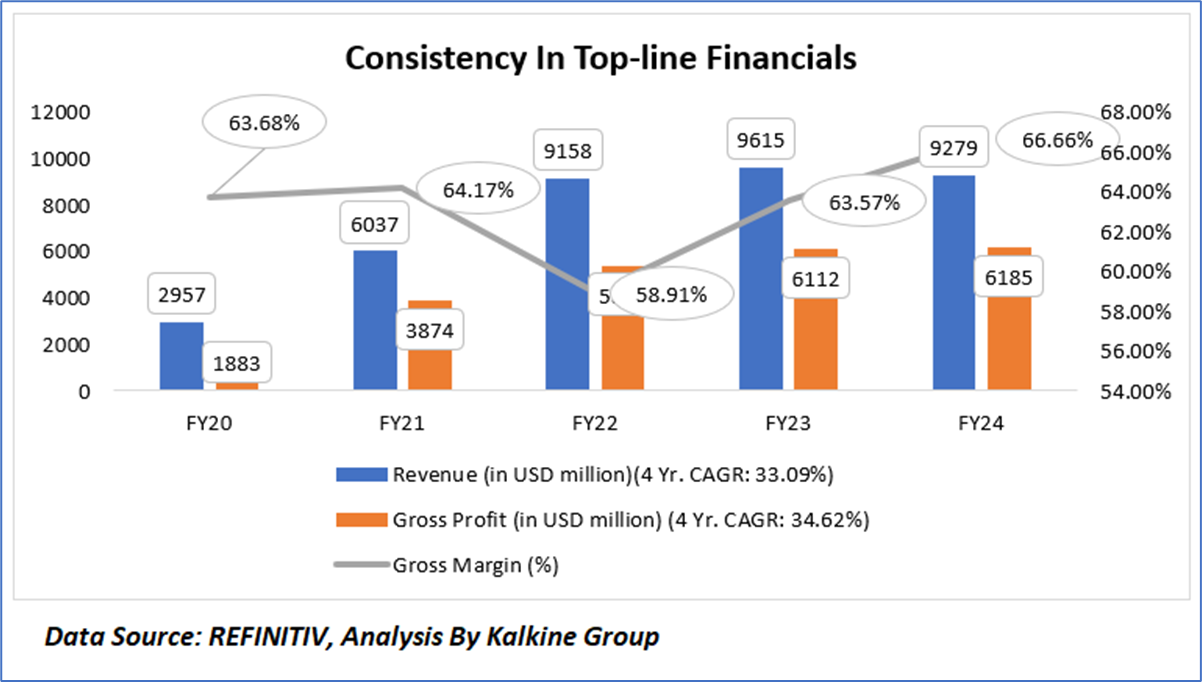
Over FY20–FY24, the Company demonstrated robust top-line and gross profit expansion, with revenue growing at a four-year CAGR of 33.09% and gross profit increasing at a slightly higher 34.62% CAGR, indicating favorable operating leverage over the period. Revenue scaled sharply from USD 2.96 billion in FY20 to USD 9.28 billion in FY24, peaking in FY23 before a modest normalization in FY24, suggesting a transition from hyper-growth to a more mature growth phase. Importantly, gross margin resilience remains a key positive, recovering from a cyclical compression in FY22 (58.91%) to a structurally stronger 66.66% in FY24, the highest level in the period, reflecting improved pricing, mix optimization, and cost efficiencies. Overall, the data indicate a business that has successfully scaled while preserving, and ultimately expanding, profitability at the gross level, strengthening the foundation for sustainable earnings generation.
Section 2: Business Updates, Financial and Operational Highlights
2.1 Recent Business Updates:

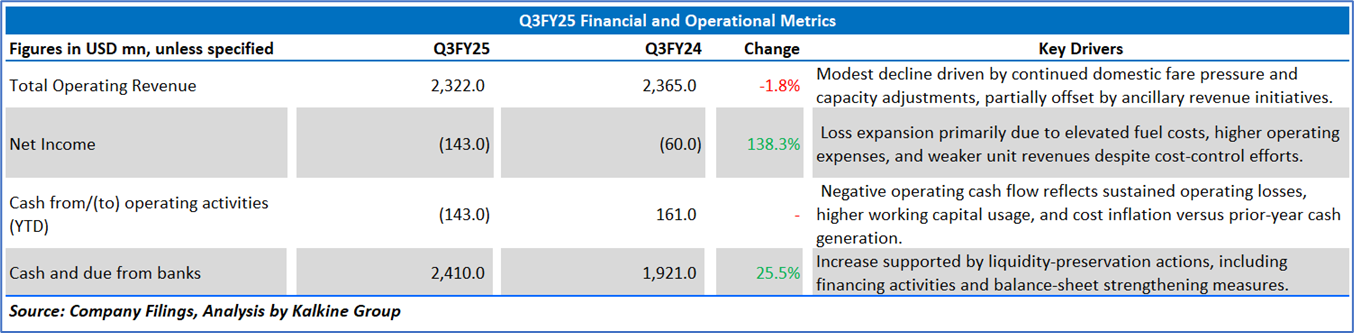
2.2 Q3FY25 Results Highlights (for the 03 months ending September 30, 2025): Below are some key financial highlights:
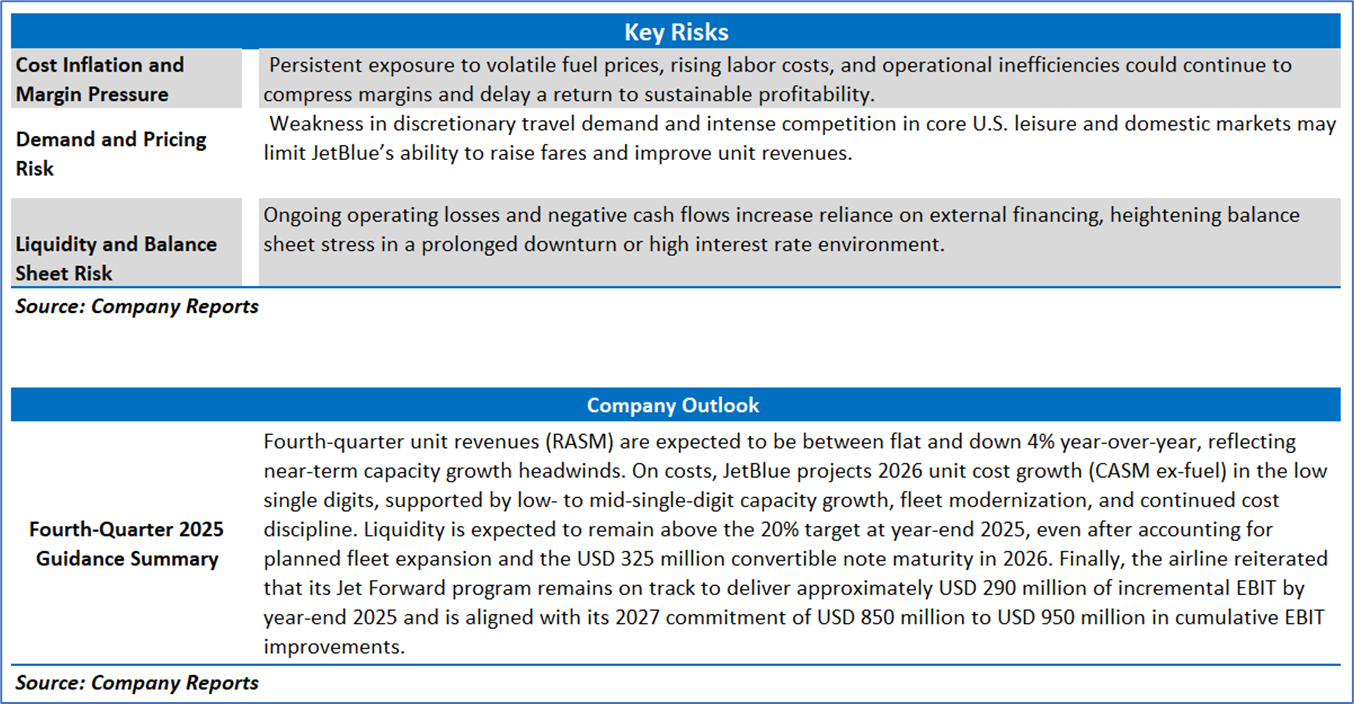
Section 3: Key Risks and Outlook:
Section 4: Stock Recommendation Summary
- Price Performance and Technical Summary
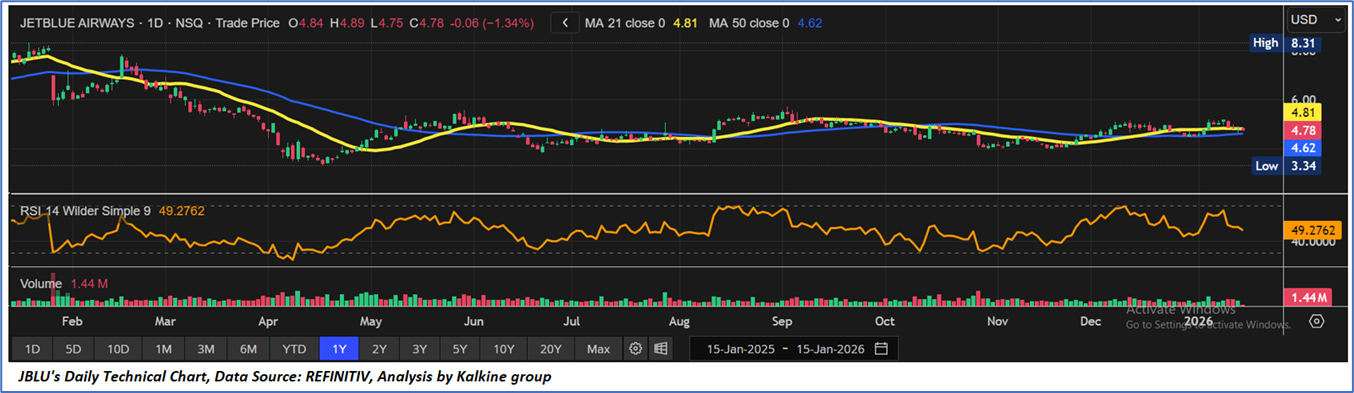
- Technical Trend and Price Structure: JBLU has been consolidating after a prolonged corrective phase, with price action stabilizing in the USD 4.6–4.9 range and holding above the prior swing low near USD 3.3–3.5. The formation of higher short-term lows over recent months suggests a gradual base-building process rather than renewed downside pressure. This stabilization at depressed levels indicates waning selling momentum and improving risk-reward dynamics for a recovery-driven move.
- Moving Averages and Momentum Signals: The stock is trading close to its 21-day (~USD 4.81) and 50-day (~USD 4.62) moving averages, with price attempting to stay above the medium-term average. This compression of moving averages typically precedes directional expansion. The RSI near 49 reflects neutral-to-improving momentum, implying that the stock is neither overbought nor oversold and retains scope for upside as buying interest gradually strengthens.
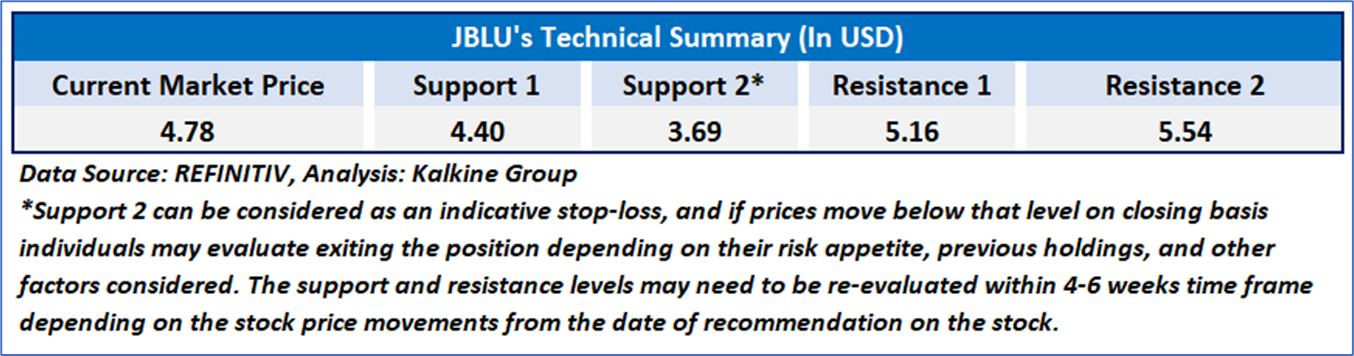
- Support, Resistance, and Upside Potential: Immediate support is established around USD 4.5–4.6, which aligns with the 50-day moving average and recent demand zones, providing a solid technical floor. On the upside, a sustained move above USD 4.9–5.0 could open the path toward USD 5.5–6.0, where prior congestion exists. Overall, the technical setup leans mildly bullish, with pullbacks appearing corrective as long as the stock holds above key moving-average support.
4.2 Fundamental Valuation
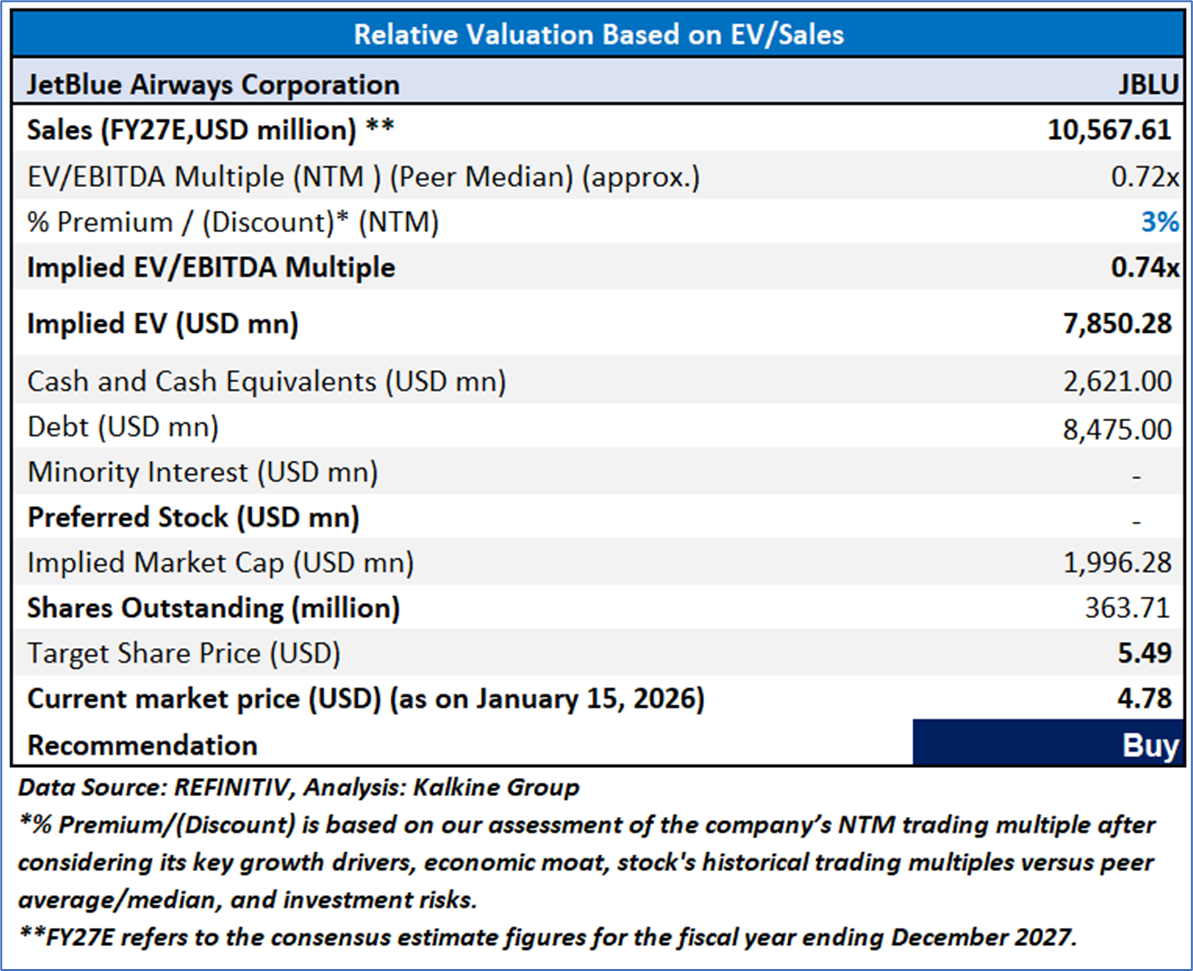
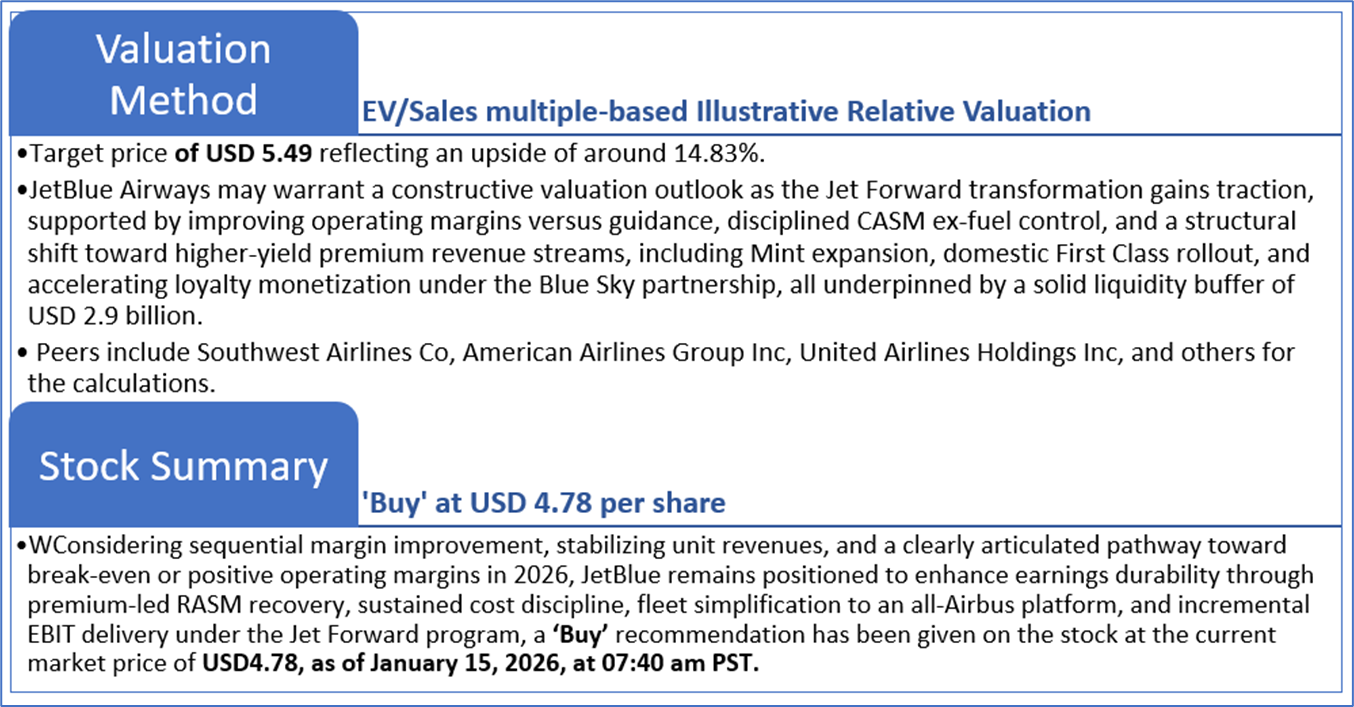
Valuation Methodology: EV/Sales Multiple Based Relative Valuation (Illustrative)
Markets are trading in a highly volatile zone currently due to certain macro-economic issues and geopolitical tensions prevailing. Therefore, it is prudent to follow a cautious approach while investing.
Note 1: Past performance is neither an indicator nor a guarantee of future performance.
Note 2: The reference date for all price data, currency, technical indicators, support, and resistance levels is January 15, 2026. The reference data in this report has been partly sourced from REFINITIV.
Note 3: Investment decisions should be made depending on an individual's appetite for upside potential, risks, holding duration, and any previous holdings. An 'Exit' from the stock can be considered if the Target Price mentioned as per the Valuation and or the technical levels provided has been achieved and is subject to the factors discussed above.
Note 4: Dividend Yield may vary as per the stock price movement.
Note 5: Kalkine reports are prepared based on the stock prices captured either from REFINITIV or Trading View. Typically, REFINITIV or Trading View may reflect stock prices with a delay which could be a lag of 25-30 minutes. There can be no assurance that future results or events will be consistent with the information provided in the report. The information is subject to change without any prior notice.
Technical Indicators Defined: -
Support: A level at which the stock prices tend to find support if they are falling, and a downtrend may take a pause backed by demand or buying interest. Support 1 refers to the nearby support level for the stock and if the price breaches the level, then Support 2 may act as the crucial support level for the stock.
Resistance: A level at which the stock prices tend to find resistance when they are rising, and an uptrend may take a pause due to profit booking or selling interest. Resistance 1 refers to the nearby resistance level for the stock and if the price surpasses the level, then Resistance 2 may act as the crucial resistance level for the stock.
Stop-loss: It is a level to protect further losses in case of unfavourable movement in the stock prices.
Past performance is not a reliable indicator of future performance.

 NZ
 UK
 US
 AU
 IND

 CA

 Please wait processing your request...