This report is an updated version of the report published on 13 April 2026 at 10:44 AM AEST.

Kalkine’s Global Tariff Report delivers objective, data-driven insights into key global sectors impacted by tariff fluctuations. It assesses how these changes influence equity valuations across affected industries, with a focus on trade-sensitive sectors that often attract increased investor attention during times of tariff-related uncertainty. The report also highlights defensive and countercyclical segments that tend to show resilience—or even outperformance—amid disruptions in global trade dynamics.
As illustrated in the table below, several key sectors in different countries are directly impacted by the recent tariff announcement from President Trump.


Key Highlights
Latest Key Developments (as of 13 April 2026)
Australia
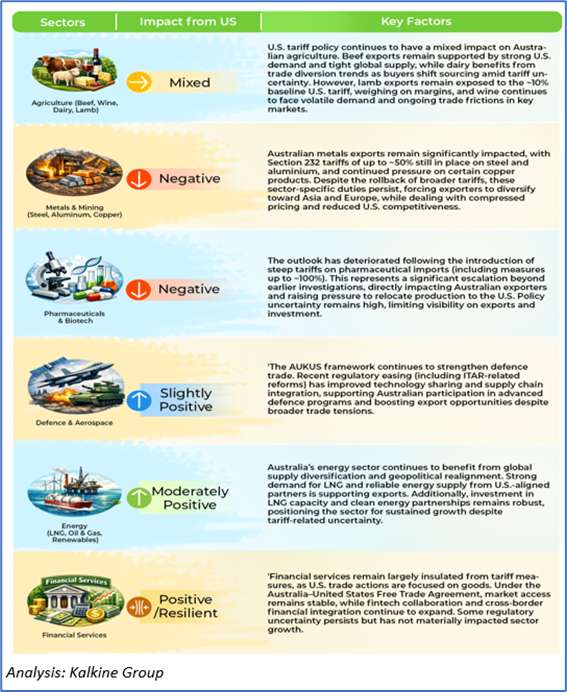
- Temporary 10% Tariff Remains; 15% Hike Still in Focus: Australia continues to face a ~10% U.S. tariff on most exports, introduced after earlier tariffs were struck down by the courts. However, there is ongoing uncertainty over a possible increase to ~15%, with policymakers indicating the current rate may be temporary.
- Sharp Escalation: 100% Tariff on Pharmaceuticals: A major recent development is the 100% tariff on Australian pharmaceutical exports, targeting a key export segment. This move is part of a broader push by the administration of Donald Trump to shift drug manufacturing back to the U.S.
- Sectoral Tariffs Remain High; New Probes Raise Risks: Australia continues to face elevated U.S. tariffs across key sectors, including ~50% on steel, aluminium, and copper, and ~25% on autos and select manufactured goods. In addition, new U.S. investigations into pharmaceuticals, machinery, and medical equipment are increasing the likelihood of further tariff measures, adding to uncertainty for Australian exporters.
Canada
- Following the U.S. Supreme Court ruling in Feb 2026, many of the earlier 25–35% tariffs on Canadian goods were struck down or diluted. They have largely been replaced by a temporary ~10% global tariff, with USMCA-compliant goods mostly exempt, reducing the overall tariff burden on Canada.
- The U.S. is actively pushing to renegotiate the United States–Mexico–Canada Agreement, with talks likely to extend beyond the July 2026 deadline. The administration has expressed dissatisfaction with trade flows (especially autos, steel, aluminium), raising the risk of stricter tariffs or even exit threats, which could significantly impact Canada.
- There is growing opposition within the U.S., with the House passing a resolution to roll back tariffs on Canada—highlighting bipartisan concern over economic impacts. However, the move is largely symbolic, and tariffs remain in place due to expected resistance from the administration of Donald Trump.
India
- Tariffs reset lower after 2025 escalation: Following intense trade tensions in 2025 (when tariffs briefly reached up to 50%), the U.S. reduced duties on Indian goods to ~18% under an interim trade framework signed in Feb 2026, improving export competitiveness.
- Supreme Court ruling reduces tariff burden further: The U.S. Supreme Court struck down several broad “reciprocal tariffs,” leading to significant relief—around 55% of Indian exports are now exempt from the earlier 18% duties, boosting trade flows.
- New 10% global tariff creates fresh uncertainty: Despite the rollback, the administration of Donald Trump introduced a ~10% temporary global tariff, applicable to India as well, with possible increase to 15% still under discussion, keeping policy uncertainty high.
China
- Tariffs remain elevated despite partial rollback: Following extreme escalation in 2025 (tariffs peaking above 100%), the U.S. and China agreed to temporary reductions (U.S. ~30%, China ~10%), but tensions persist. After the U.S. Supreme Court struck down broad global tariffs, a ~10% baseline tariff still applies, while China-specific tariffs under other laws remain in force.
- Shift Toward Tech and Strategic Rivalry: The tariff conflict has broadened beyond traditional goods into technology and critical supply chains, with increasing restrictions on semiconductors and AI-related exports, alongside China’s controls over rare earth minerals. Ongoing disputes in advanced manufacturing and green technologies further highlight this transition, signalling a clear shift from a conventional trade war to a deeper tech-driven and national security rivalry between the U.S. and China.
- Escalation Risks Ahead of U.S.–China Summit: Tensions remain elevated ahead of the planned meeting between Donald Trump and Xi Jinping, with fresh risks of tariff escalation. The U.S. has recently threatened 50% tariffs on countries supplying weapons to Iran, a move widely seen as indirectly targeting China and risking renewed trade friction. At the same time, China has initiated trade probes into U.S. tariff and technology policies, signalling potential countermeasures if tensions escalate.
European Union
- 15% tariff framework anchors EU–U.S. trade: The U.S. has set a ~15% tariff on most EU exports under a broader trade framework agreement, providing some structure to transatlantic trade. In return, the European Union has committed to reducing or eliminating tariffs on many U.S. goods, though concerns remain that the deal is uneven.
- Sectoral Tariffs Continue to Weigh on EU Industries: Despite the broader trade framework, key sectors within the European Union continue to face elevated tariffs, particularly ~50% duties on steel and aluminium, along with additional levies on certain industrial goods. These targeted measures are placing sustained pressure on EU manufacturers and exporters, limiting the overall benefits of the agreement and keeping trade tensions with the U.S. elevated.

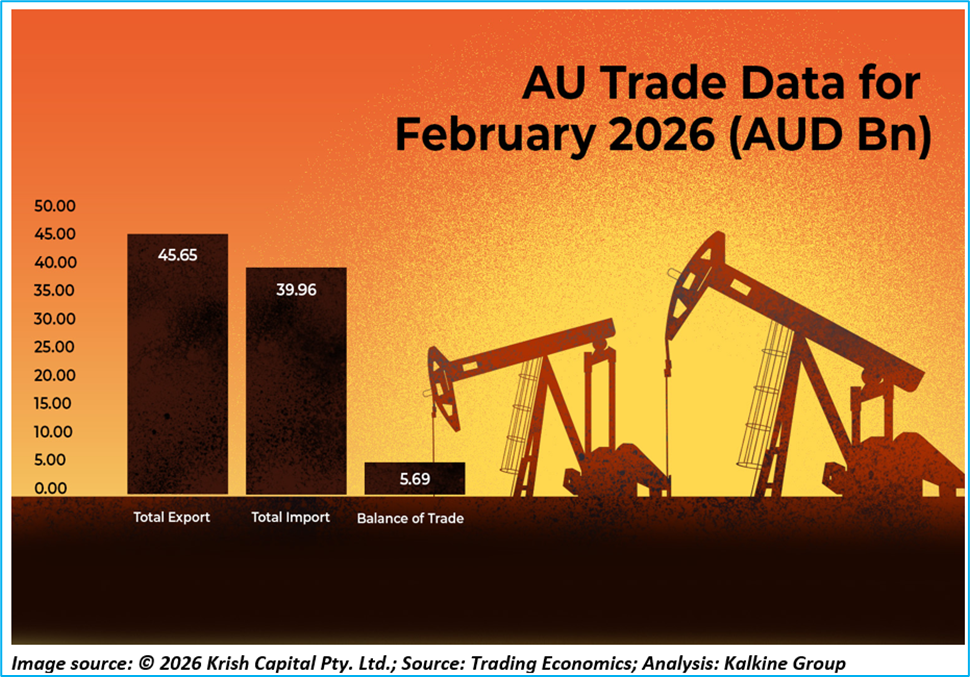
Australia’s latest external sector data reflects a mixed but broadly stable position. The trade balance improved to AUD 5.7bn in Feb 2026, supported by stronger exports (AUD 45.6bn) and a moderation in imports (AUD 40.0bn). However, the current account remains in deficit at AUD 21.1bn (-2.9% of GDP), indicating ongoing external funding needs. Terms of trade have edged higher to 116, suggesting relatively firm commodity prices, while capital flows moderated sharply to AUD 8.0bn from previous highs, pointing to softer financial inflows. Meanwhile, external debt remains elevated at AUD 2.75tn, and FDI has improved to AUD 81bn, reflecting continued investor interest. On the real economy side, tourist arrivals declined month-on-month, while crude oil production saw a slight dip, indicating some softness in select sectors despite overall trade resilience.


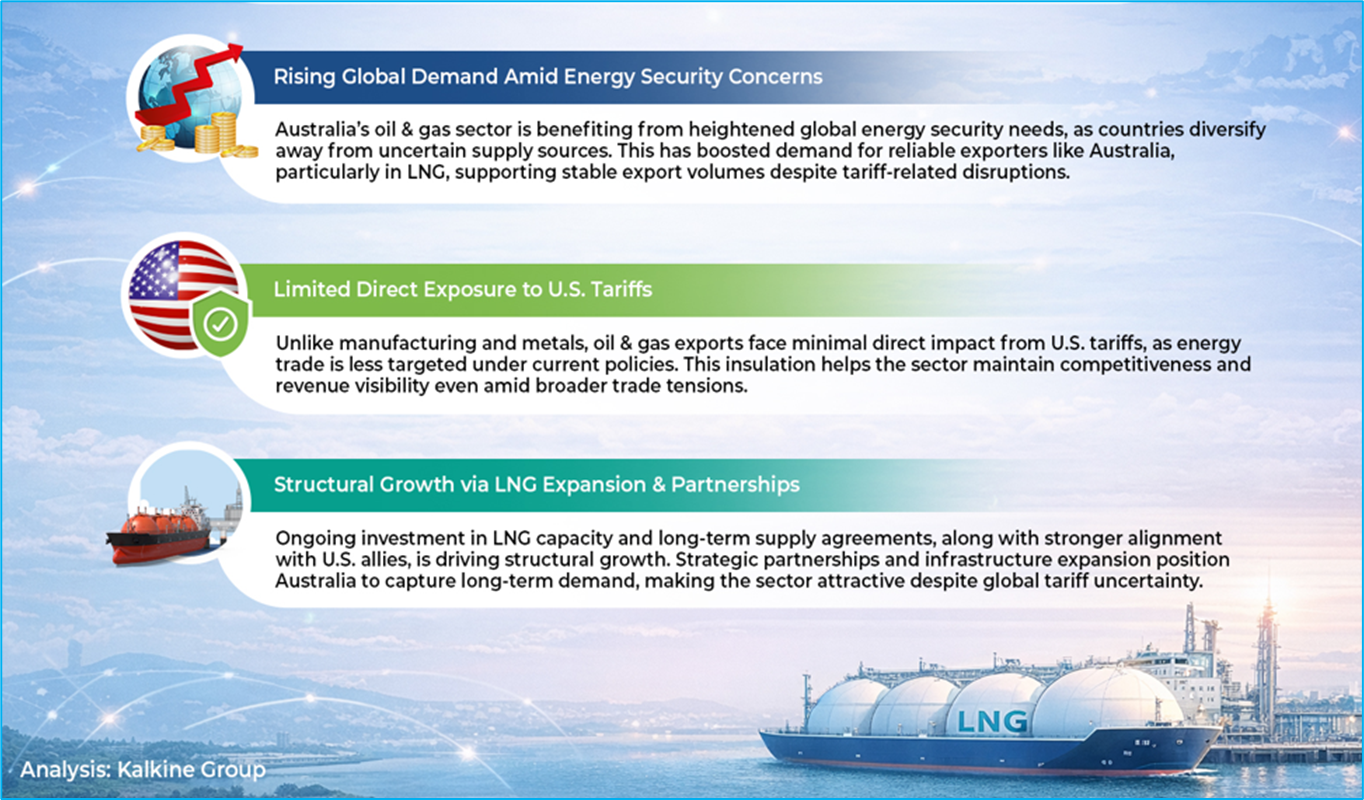
Amid elevated Market Volatility and Tariff pressures, Karoon Energy Ltd (ASX: KAR) stands out as a defensive pick within the Oil & Gas sector, supported by rigorous fundamental and technical research.
Section 1: Company Overview and Fundamentals Insights
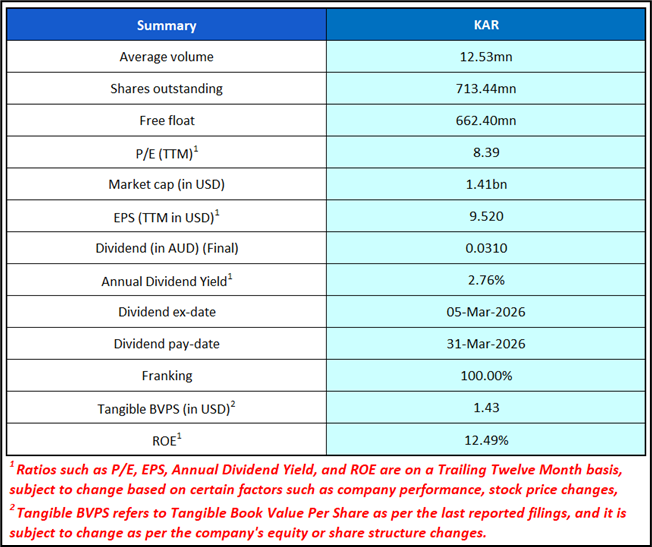
Company Overview: Karoon Energy Ltd (ASX: KAR) is an oil and gas exploration and production company with operations across Australia, the United States, and Brazil, focusing on the development and production of energy assets in key offshore and onshore basins. Kalkine’s Global Tariff Report covers the Investment Highlights, Management Insights, Key Financial Metrics, Risks, and Technical Analysis along with the Valuation, Target Price, and Recommendation on the stock.
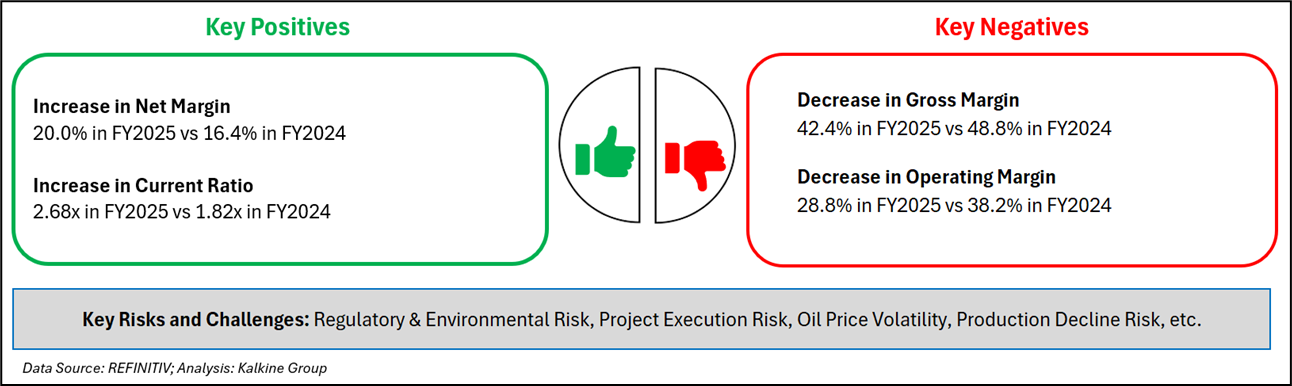
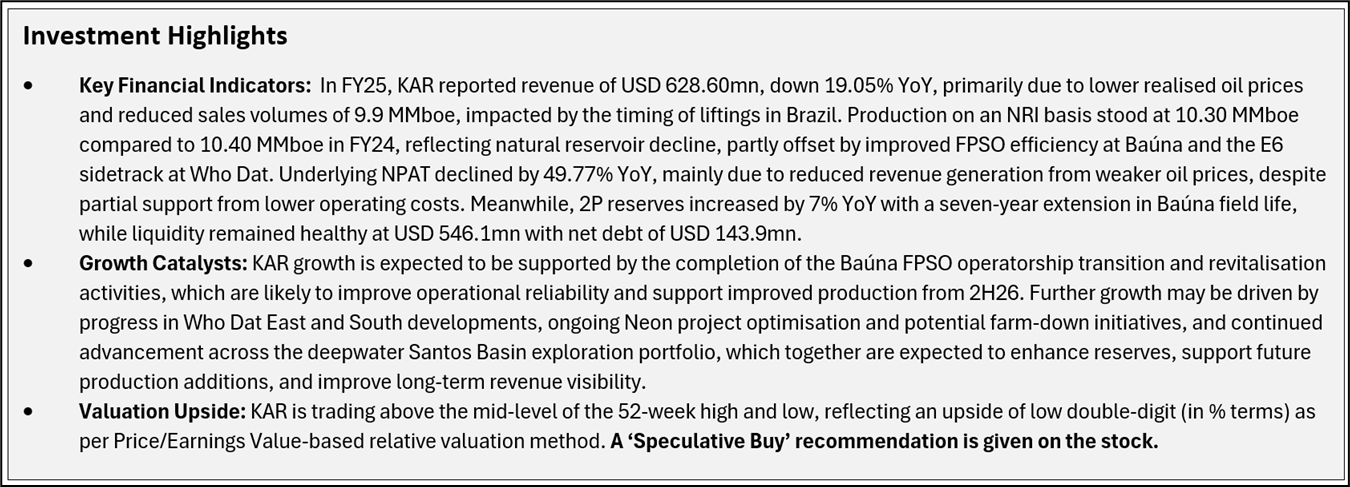
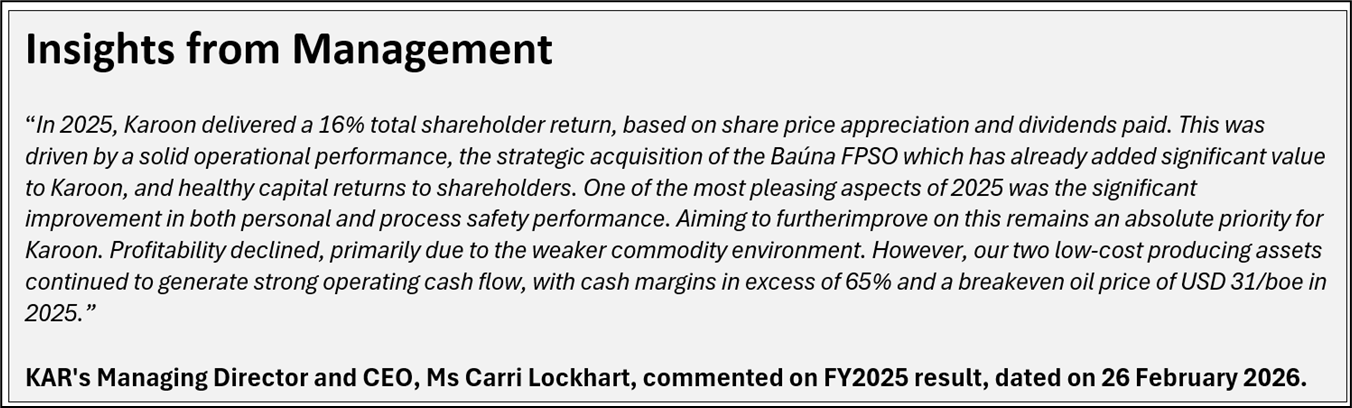
1.2 The Key Positives, Negatives, Investment Highlights, and Risks
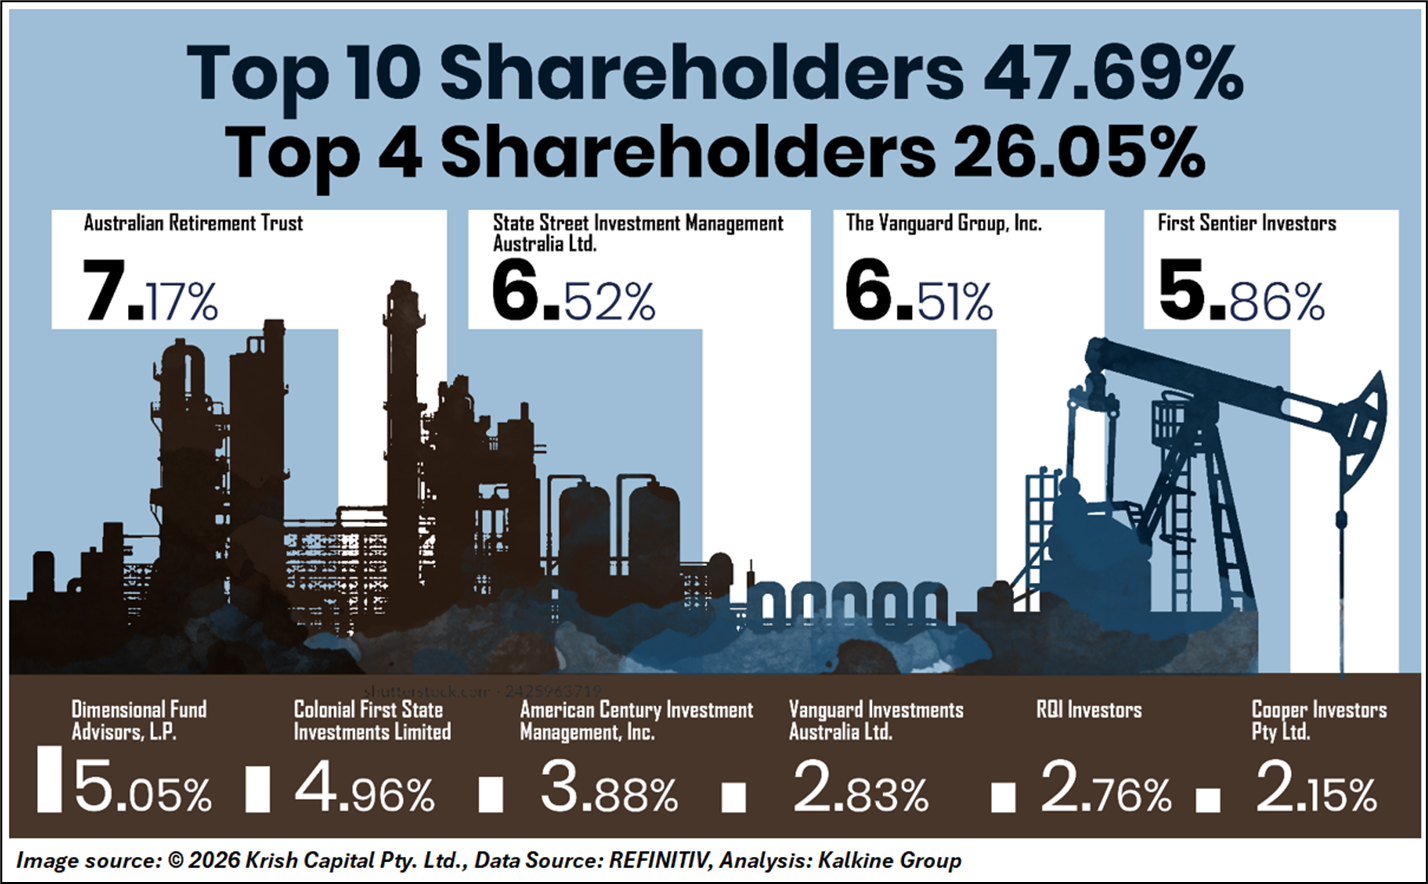
1.3 Top 10 Shareholders:
The top 10 shareholders together form ~47.69% of the total shareholding. Australian Retirement Trust, and State Street Investment Management Australia Ltd. hold maximum stakes of 7.17% and 6.52%, respectively.
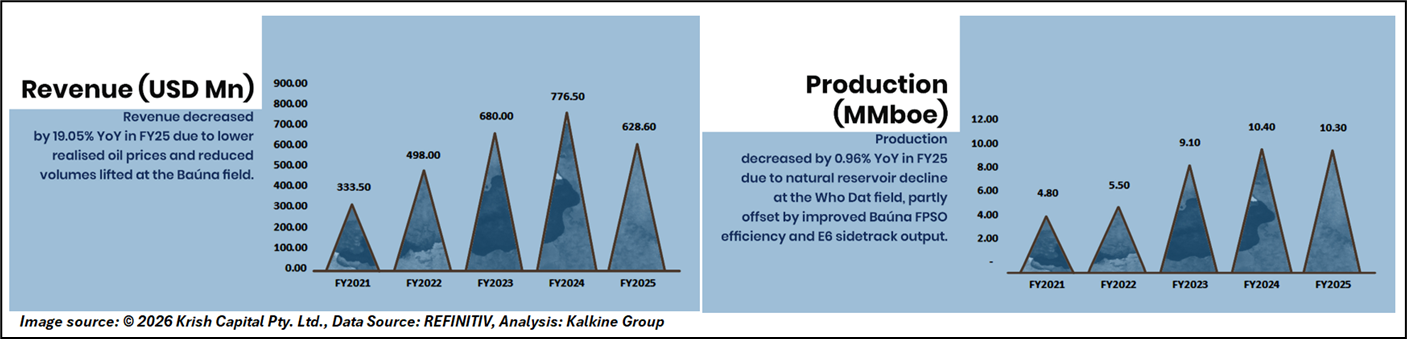
1.4 Key Metrics: KAR’s quick ratio improved to 2.47x in FY2025, up from 1.82x in FY2024. Below is captured other metrics:
Section 2: Business Updates, Financial and Operational Highlights
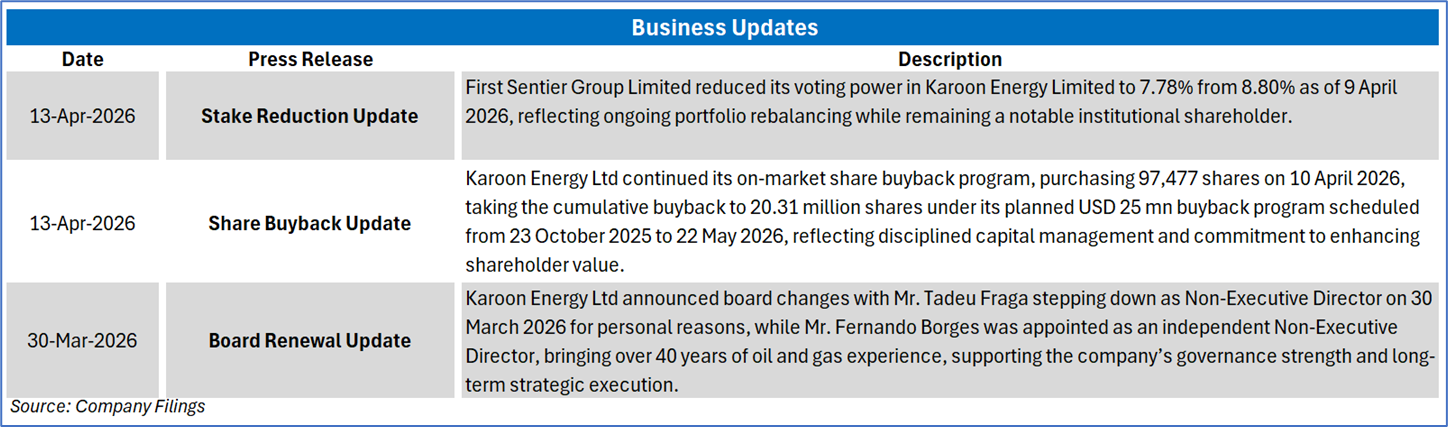
2.1 Recent Business Updates:
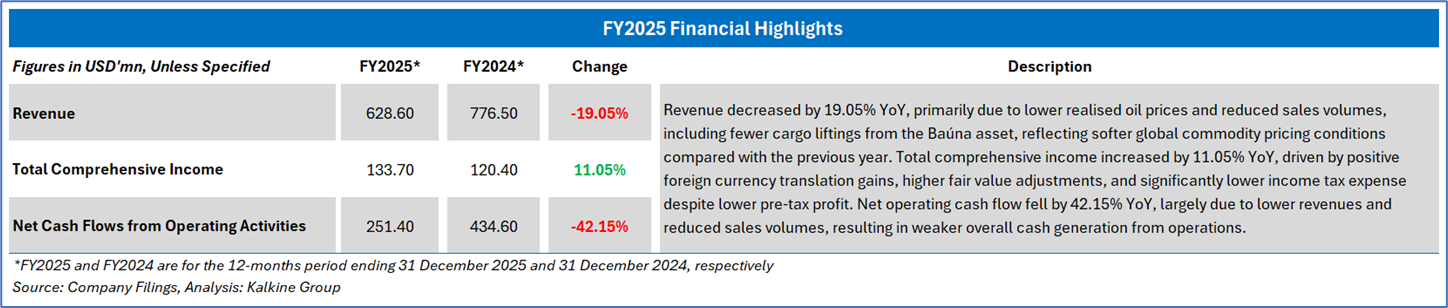
2.2 FY2025 Results Highlights (for the 12 months ended 31 December 2025): Below mentioned are some key financial highlights:
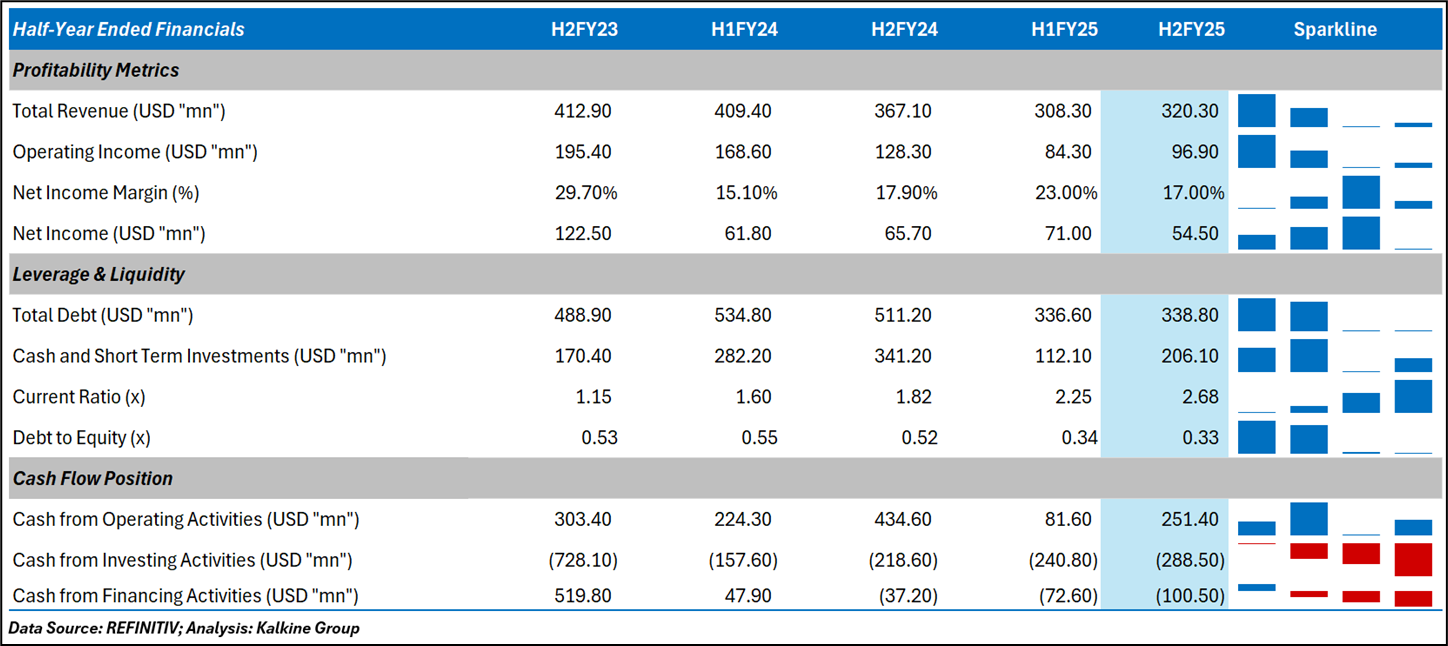
2.3 Historical Financial Trend
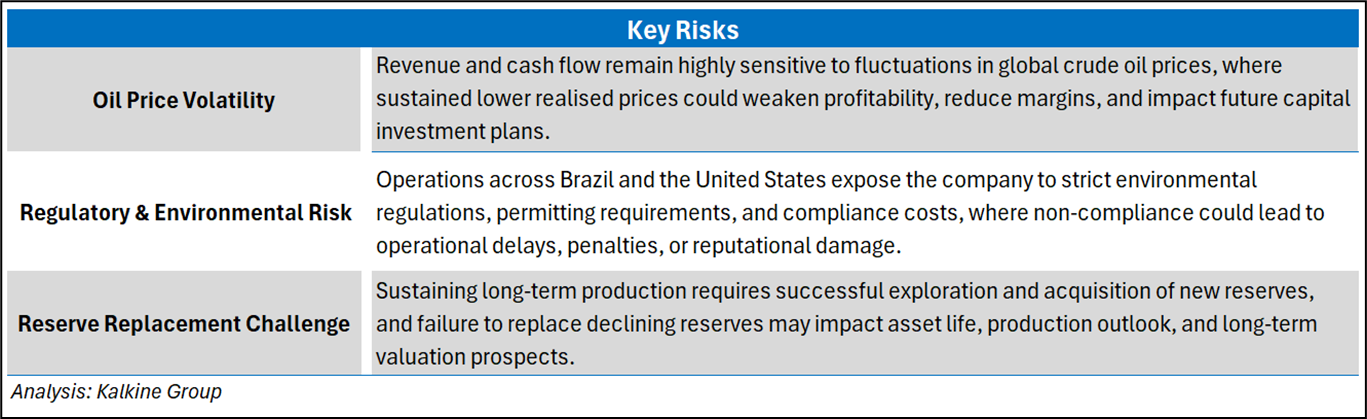
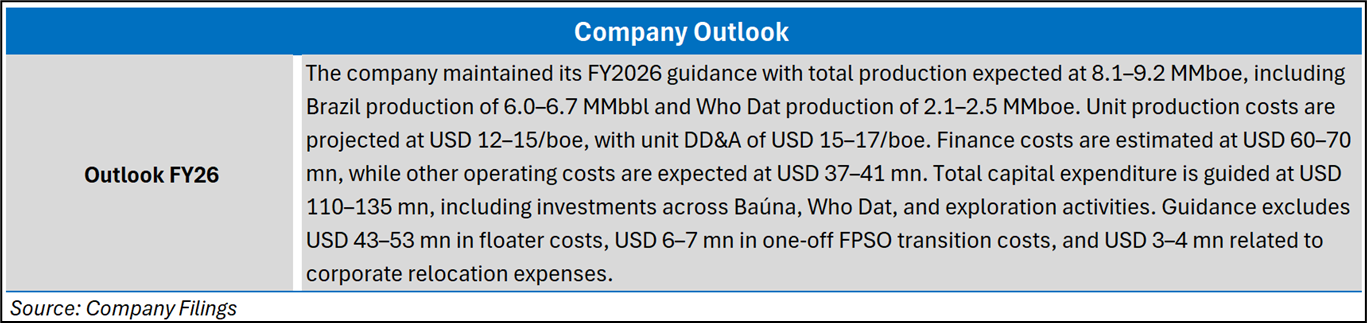
Section 3: Key Risks and Outlook:
Section 4: Stock Recommendation Summary
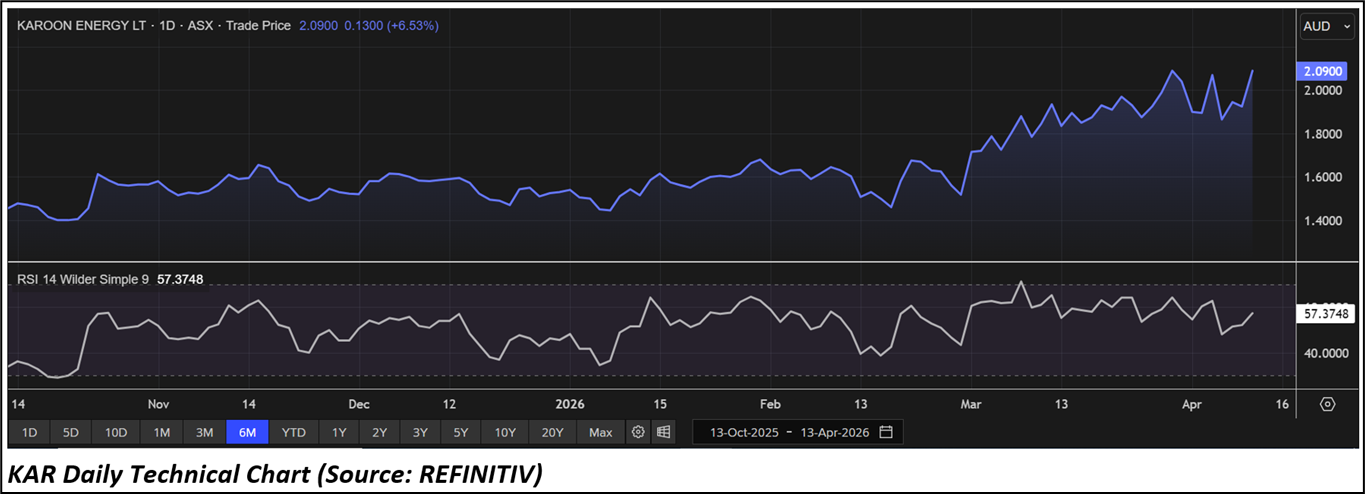
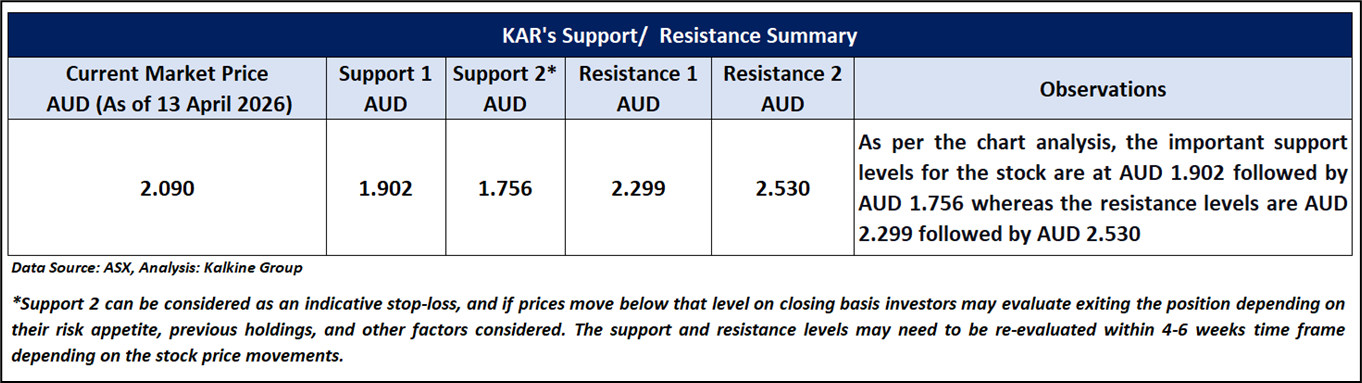
4.1 Price Performance and Technical Summary
The stock has increased by ~13.59% in the last one month, and over the past six months, stock has increased by ~40.27%. The stock has a 52-week low and 52-week high of AUD 1.205 and AUD 2.200, respectively. The stock is currently trading below the midpoint of its 52-week trading range. KAR was last covered in a report dated ’09 March 2026’.
4.2 Fundamental Valuation and Stock Recommendation
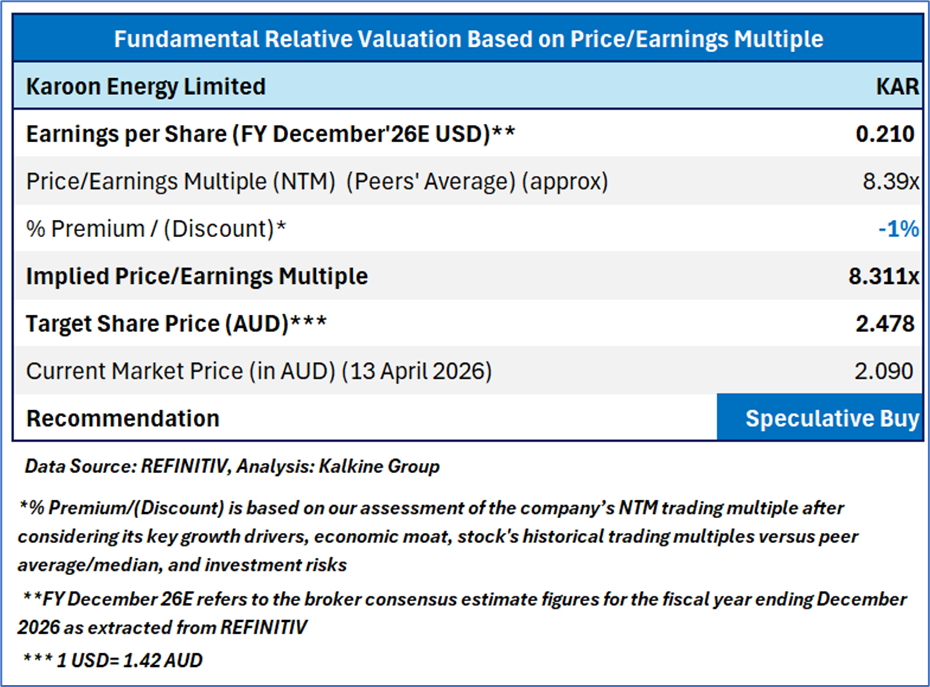
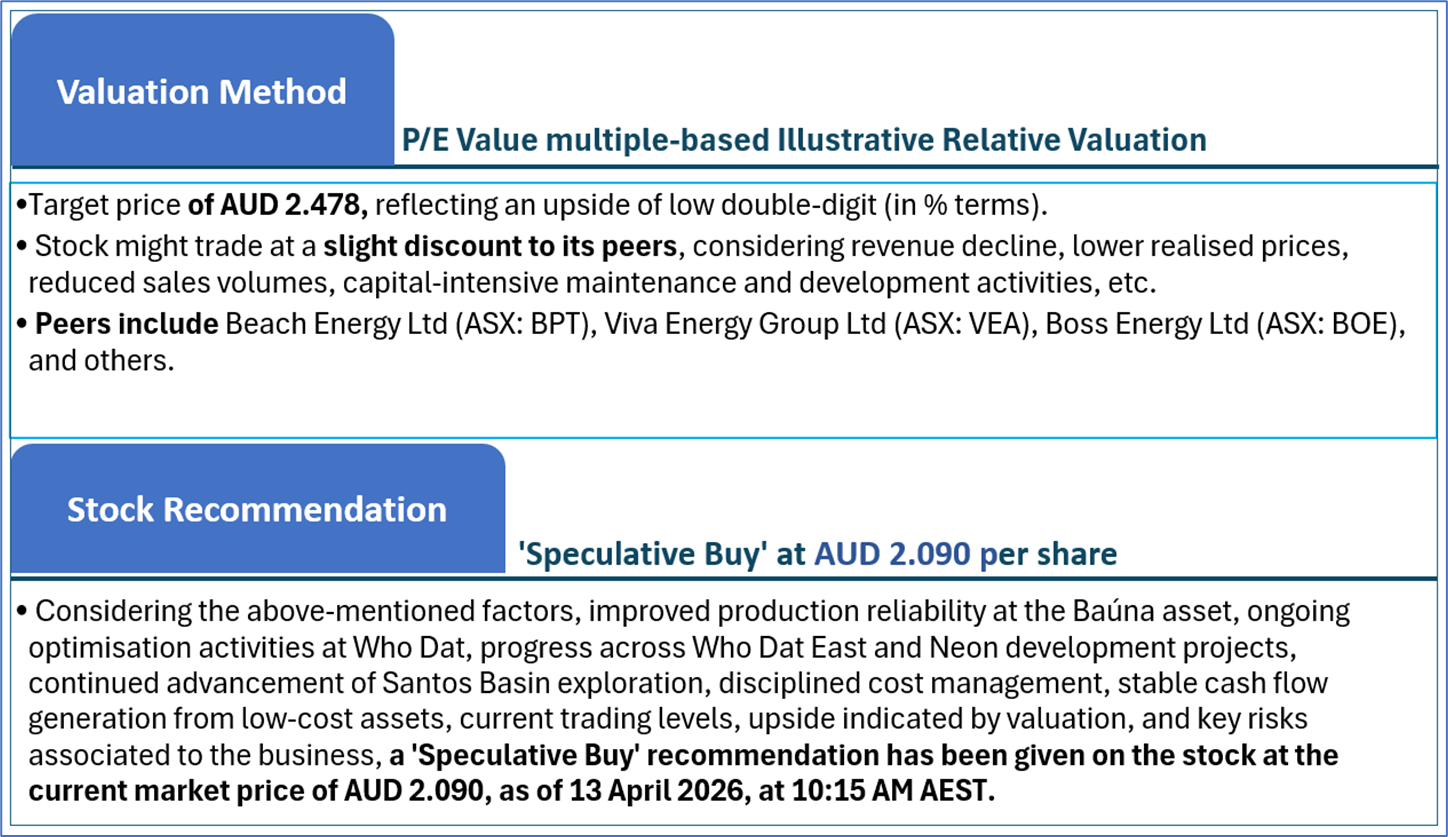
Markets are trading in a highly volatile zone currently due to certain macro-economic issues and geopolitical tensions prevailing. Therefore, it is prudent to follow a cautious approach while investing.
Note 1: Past performance is neither an indicator nor a guarantee of future performance.
Note 2: The reference date for all price data, currency, technical indicators, support, and resistance levels is 13 April 2026. The reference data in this report has been partly sourced from REFINITIV.
Note 3: Investment decisions should be made depending on an individual's appetite for upside potential, risks, holding duration, and any previous holdings. An 'Exit' from the stock can be considered if the Target Price mentioned as per the Valuation and or the technical levels provided has been achieved and is subject to the factors discussed above.
Note 4: Kalkine reports are prepared based on the stock prices captured either from REFINITIV or Trading View. Typically, REFINITIV or Trading View may reflect stock prices with a delay which could be a lag of 25-30 minutes. There can be no assurance that future results or events will be consistent with the information provided in the report. The information is subject to change without any prior notice.
Note 5: Dividend Yield may vary as per the stock price movement.
Technical Indicators Defined: -
Support: A level at which the stock prices tend to find support if they are falling, and a downtrend may take a pause backed by demand or buying interest. Support 1 refers to the nearby support level for the stock and if the price breaches the level, then Support 2 may act as the crucial support level for the stock.
Resistance: A level at which the stock prices tend to find resistance when they are rising, and an uptrend may take a pause due to profit booking or selling interest. Resistance 1 refers to the nearby resistance level for the stock and if the price surpasses the level, then Resistance 2 may act as the crucial resistance level for the stock.
Stop-loss: It is a level to protect further losses in case of unfavourable movement in the stock prices.
Past performance is not a reliable indicator of future performance.

 NZ
 UK
 US
 AU
 IND

 CA

 Please wait processing your request...