This report is an updated version of report published on 15 April 2026 as on 11:01 AM IST

The ‘India Equity Opportunities Report’ is a forward-looking, conviction-based research product that identifies and evaluates investment options within the Indian equity market.
Anchored in a robust global and domestic macro framework, the report blends structural growth tailwinds with company-level fundamentals, valuation discipline, and technical signals to support confident, data-driven decision-making.

The Engineering, Procurement and Construction (EPC) and infrastructure sector plays a significant role in supporting India’s economic growth, urbanization, and industrial expansion. The sector is closely linked to government capital expenditure on transportation, energy, urban infrastructure, water management, and defense, making it a key contributor to long-term capital formation.
India’s infrastructure spending has increased steadily, supported by large-scale public investment programs. The Government of India allocated capital expenditure of INR 7.4 trillion in FY2022, which increased to INR 9.5 trillion in FY2023, INR 10.5 trillion in FY2024, and INR 11.2 trillion in FY2025, with further growth expected in the coming years. Continued investments in highways, railways, metro networks, renewable energy, and industrial corridors are supporting demand for EPC services.
The industry is characterized by large project sizes, long execution cycles, and strong order book visibility. Companies typically operate across diversified segments such as infrastructure, hydrocarbons, heavy engineering, defense, and power equipment manufacturing.
(Source: Ministry of Finance, Government of India (Union Budget Documents); Economic Survey of India)
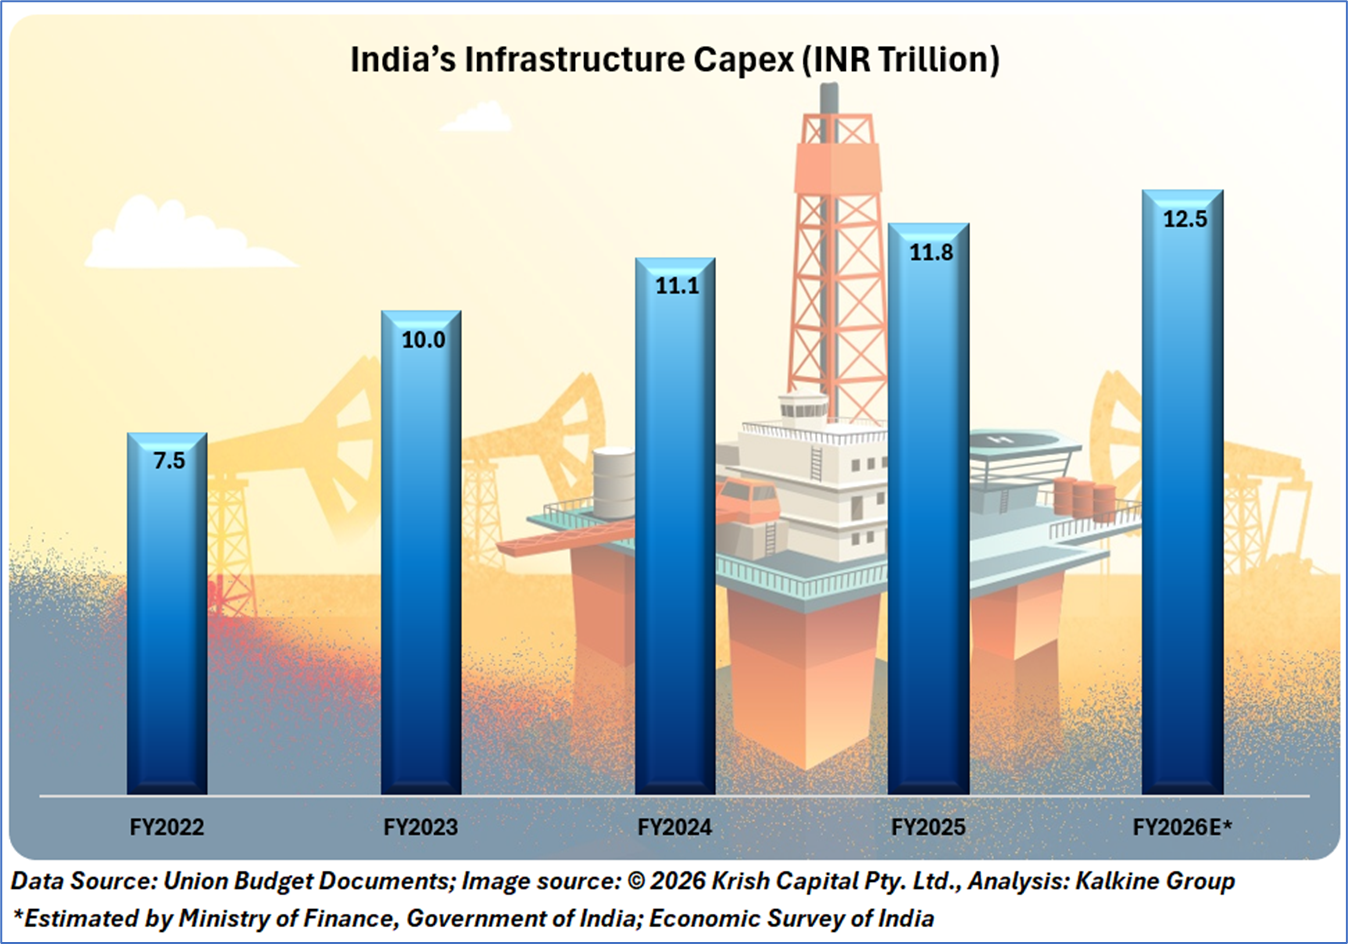

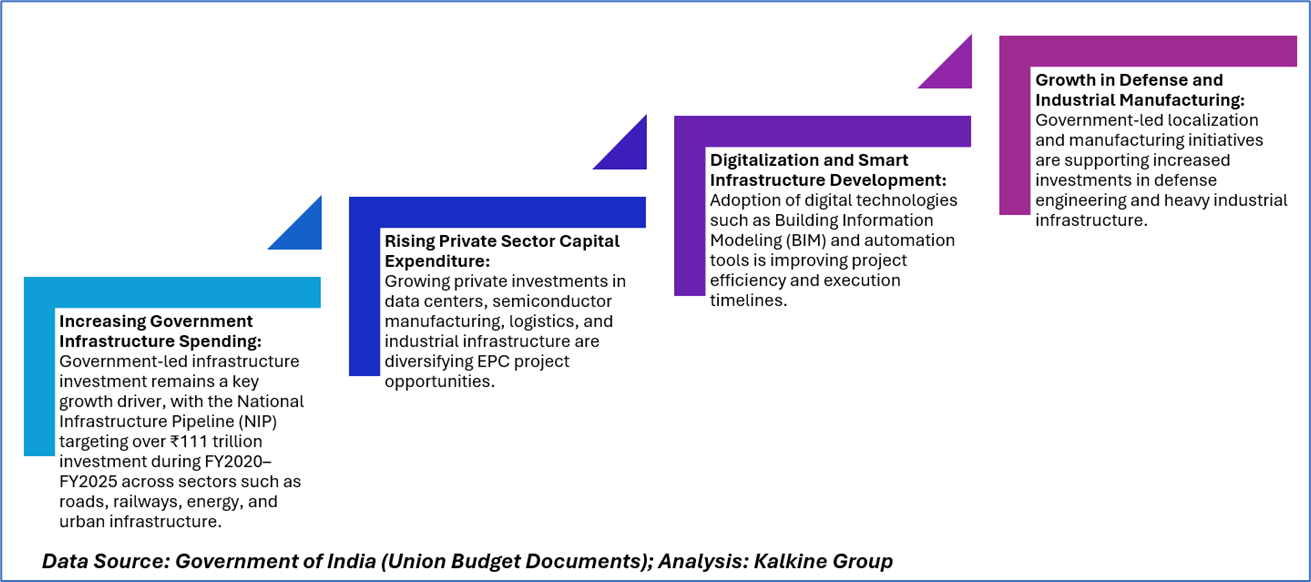

The outlook for India’s EPC and infrastructure sector remains supported by sustained government investment and expanding infrastructure demand. The government continues to prioritize capital expenditure-led growth, with infrastructure development forming a central pillar of economic expansion.
Continued investments in transportation networks, renewable energy, logistics infrastructure, and industrial manufacturing are expected to support steady order inflows over the medium term. Additionally, increasing private sector participation and global demand for infrastructure modernization are likely to create new growth opportunities.
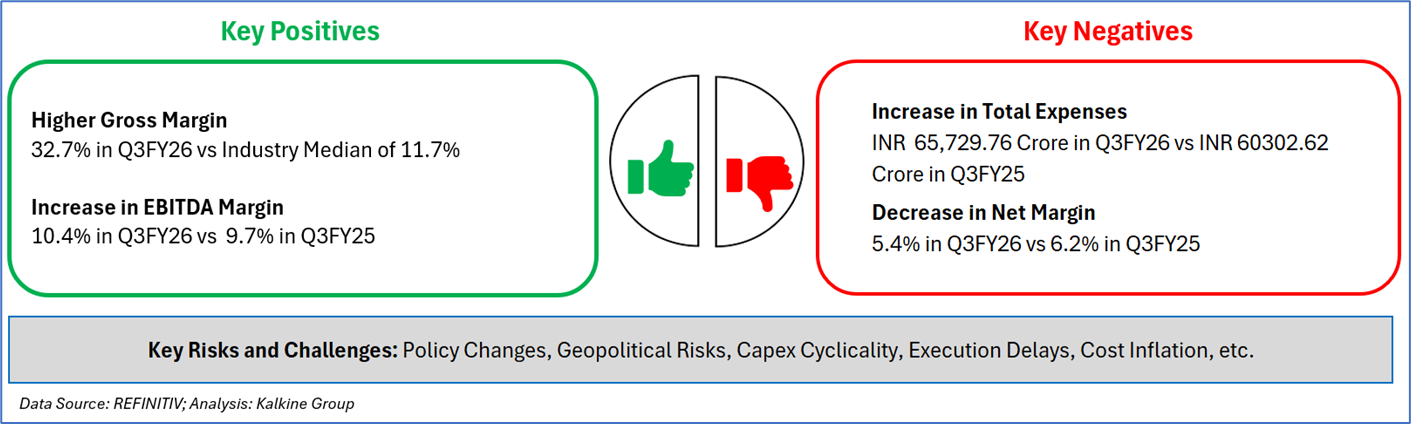
However, the sector remains exposed to risks such as raw material price volatility, project execution delays, regulatory approvals, and geopolitical uncertainties.
Overall, the Indian EPC and infrastructure sector is expected to maintain steady growth momentum, supported by strong project pipelines, rising investments, and evolving infrastructure requirements.
Based on the above data, one NSE-listed India Equity Opportunities stock has been identified to showcase the momentum.
Section 1: Company Overview and Fundamentals Insights
Company Overview: Larsen and Toubro Limited (NSE:LT) is a multinational engineering and construction conglomerate specializing in EPC projects and advanced manufacturing. Its diversified segments include Infrastructure, Energy, Hi-Tech Manufacturing, IT and Technology Services, Financial Services, and Development Projects, delivering solutions across oil and gas, clean energy, digital platforms, data centers, and infrastructure. Kalkine’s India Equity Opportunities Report covers the Investment Highlights, Management Commentary, Key Financial Metrics, Risks, and Technical Analysis along with the Valuation, Target Price, and Recommendation on the stock.
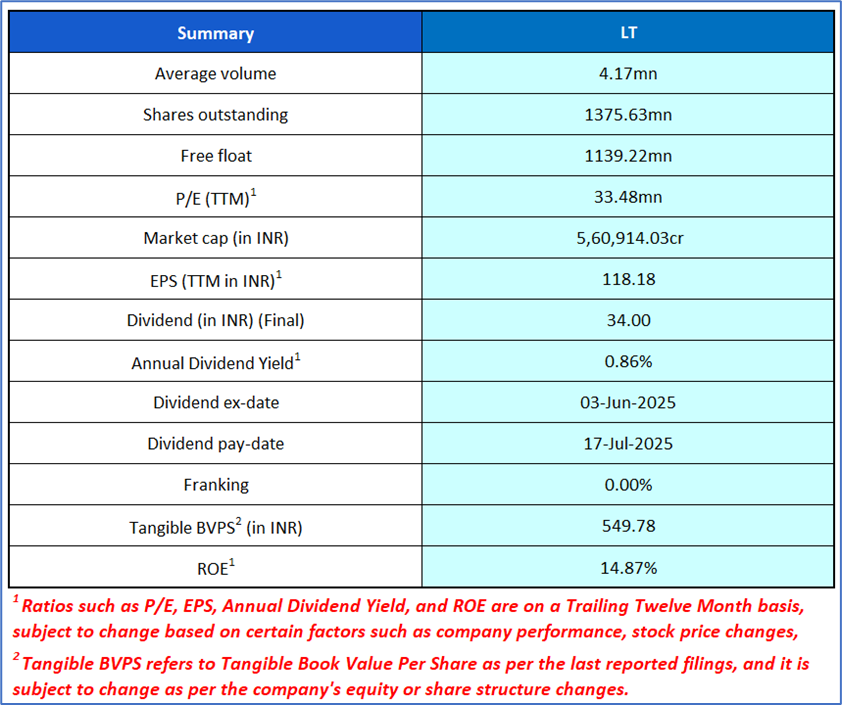
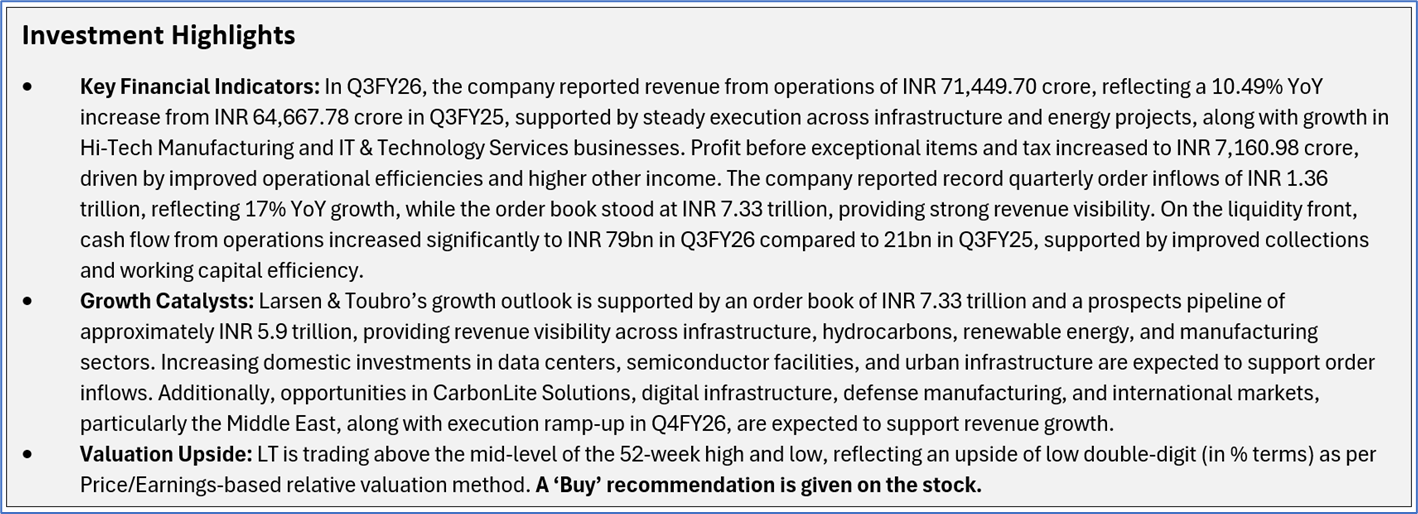
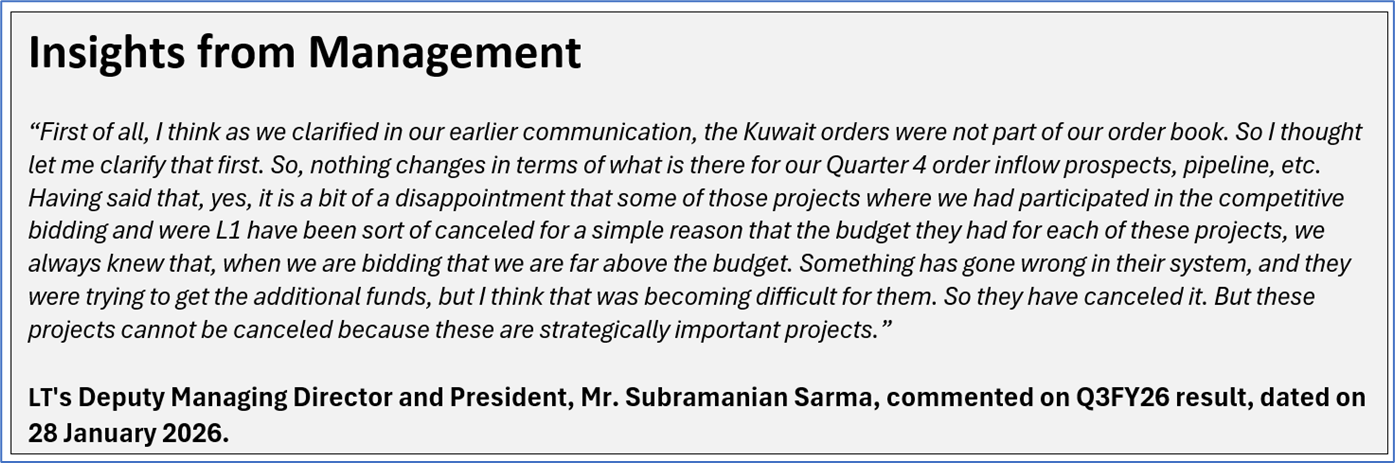
1.2 The Key Positives, Negatives, Investment Highlights, and Risks
1.3 Top 10 Shareholders:
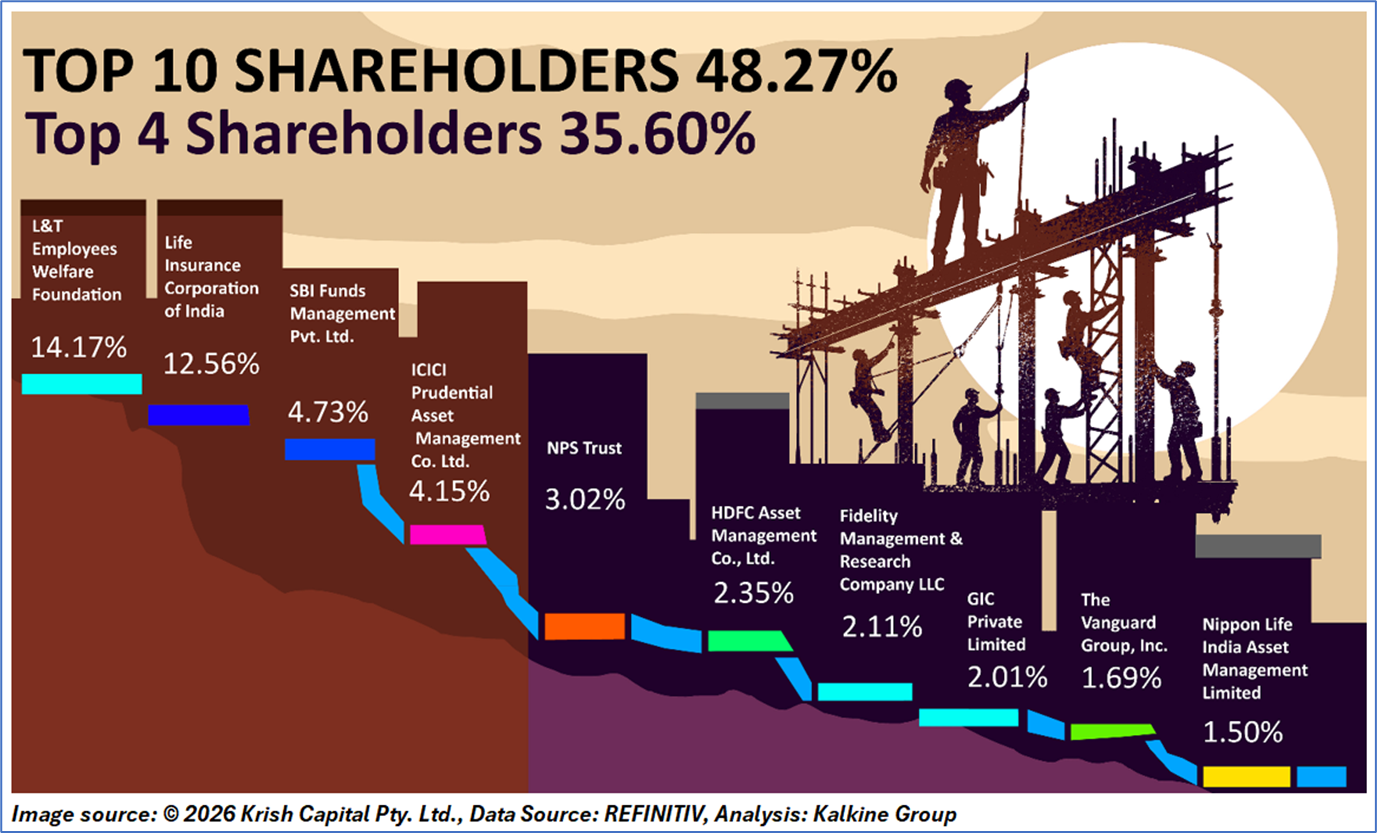
The top 10 shareholders together form ~48.27% of the total shareholding. L&T Employees Welfare Foundation and Life Insurance Corporation of India hold maximum stakes of 14.17% and 12.56%, respectively.
1.4 Key Metrics: LT’s operating margin increased to 7.0% in Q3FY26 compared to industry median of 4.0%. Below is captured other metrics:
Section 2: Business Updates, Financial and Operational Highlights
2.1 Recent Business Updates:
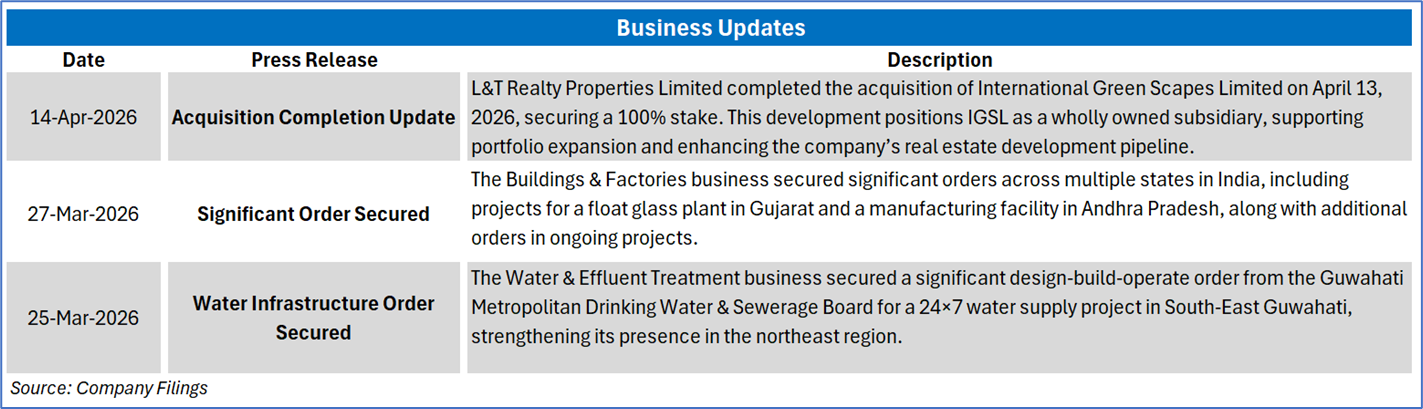
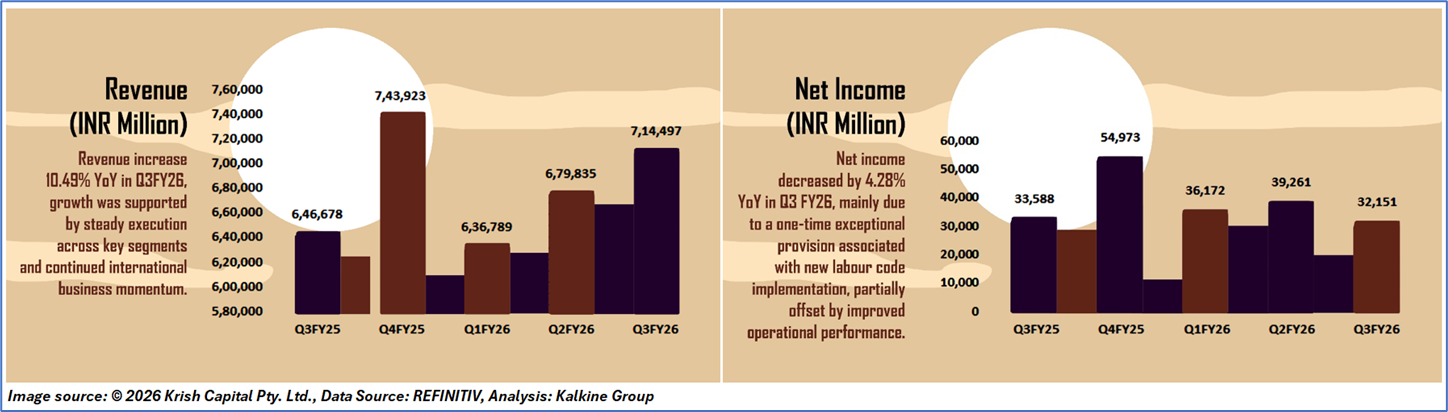
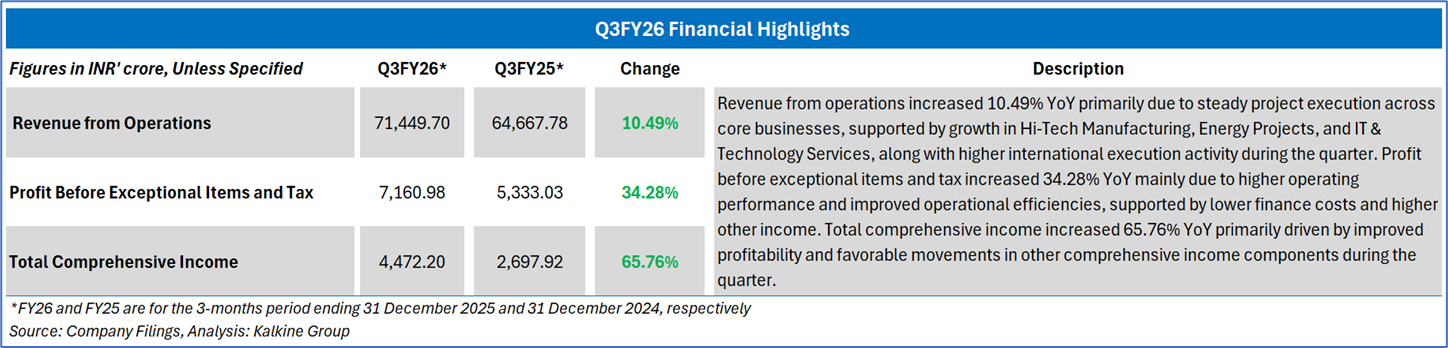
2.2 Q3FY26 Results Highlights (for the 03 months ended 31 December 2025): Below mentioned are some key financial highlights:
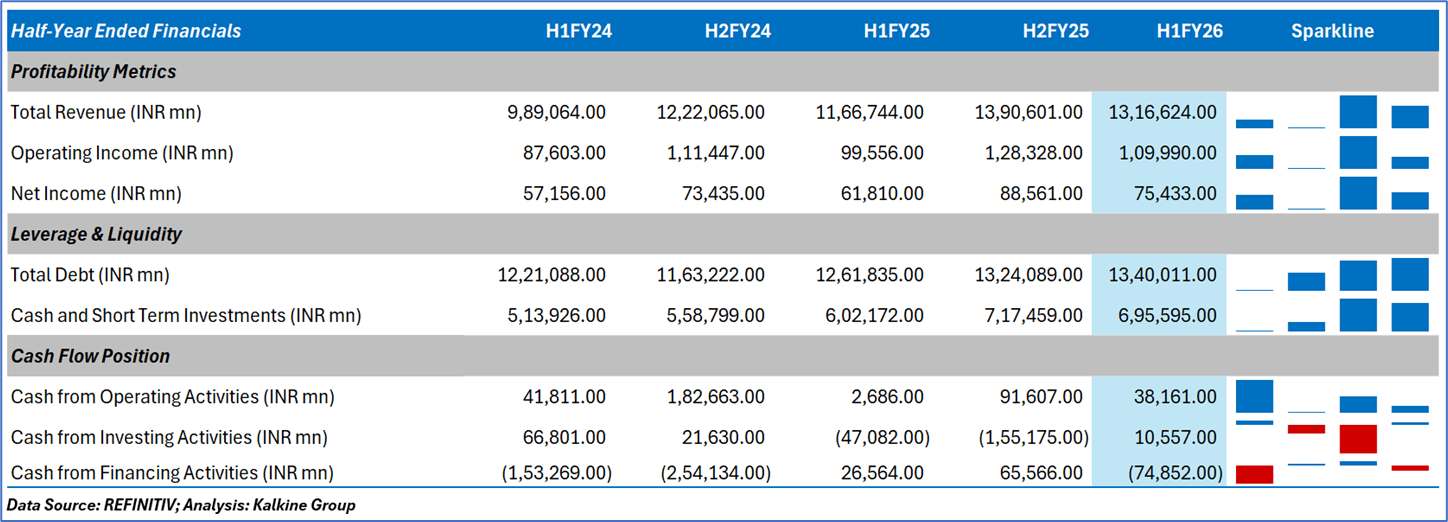
2.3 Historical Financial Trend
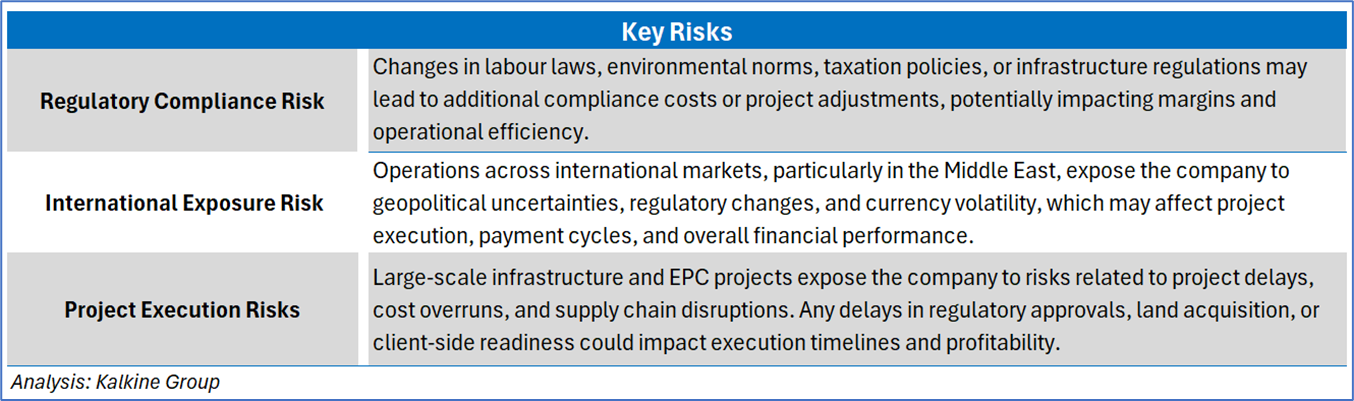
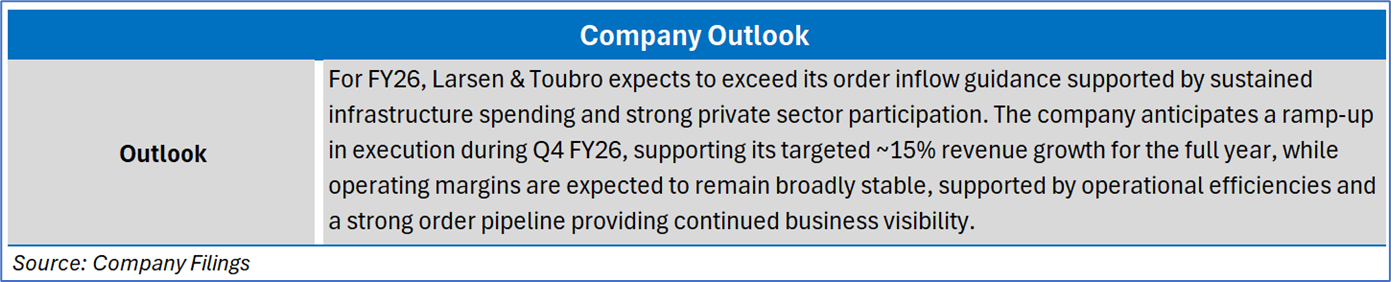
Section 3: Key Risks and Outlook:
Section 4: Stock Recommendation Summary
4.1 Price Performance and Technical Summary
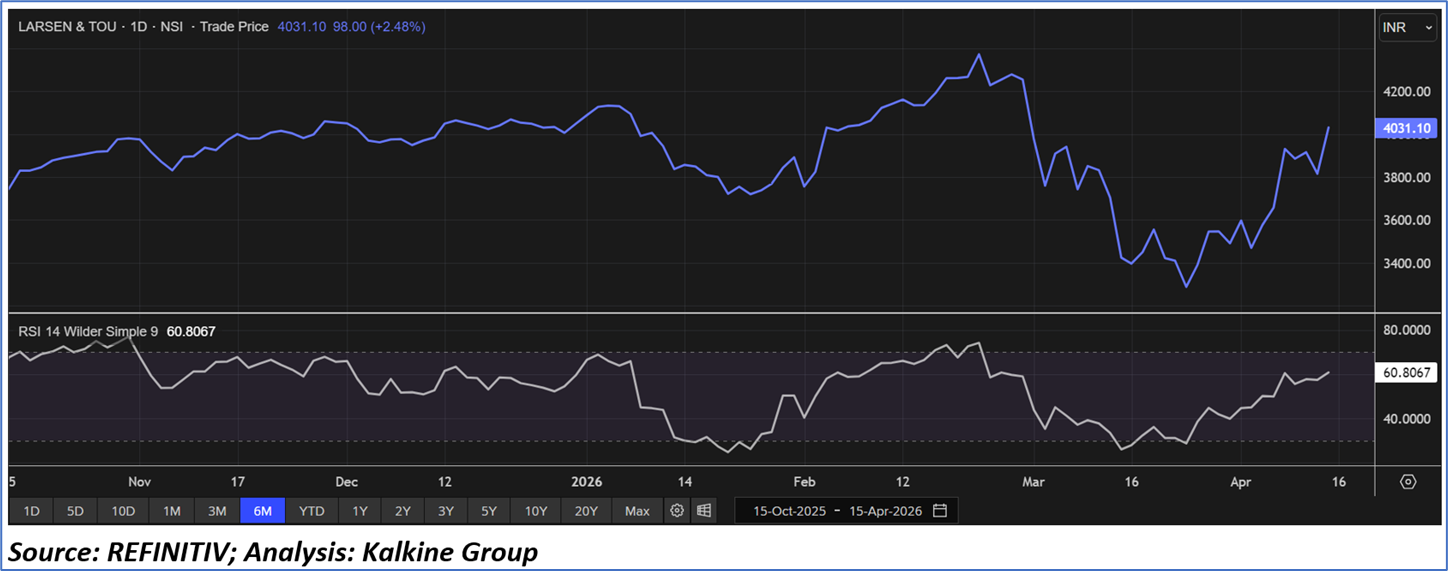
The stock has increased by ~5.65% in the last three months, whereas over the past six months, stock has increased by ~6.67%. The stock has a 52-week low and 52-week high of INR 3,162.40 and INR 4,440.00, respectively. The stock is currently trading above the midpoint of its 52-week trading range.
4.2 Fundamental Valuation and Stock Recommendation
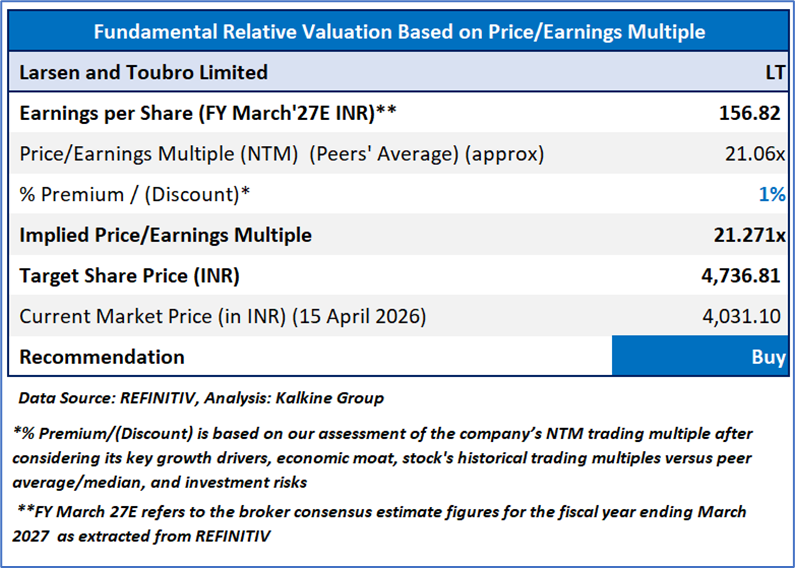
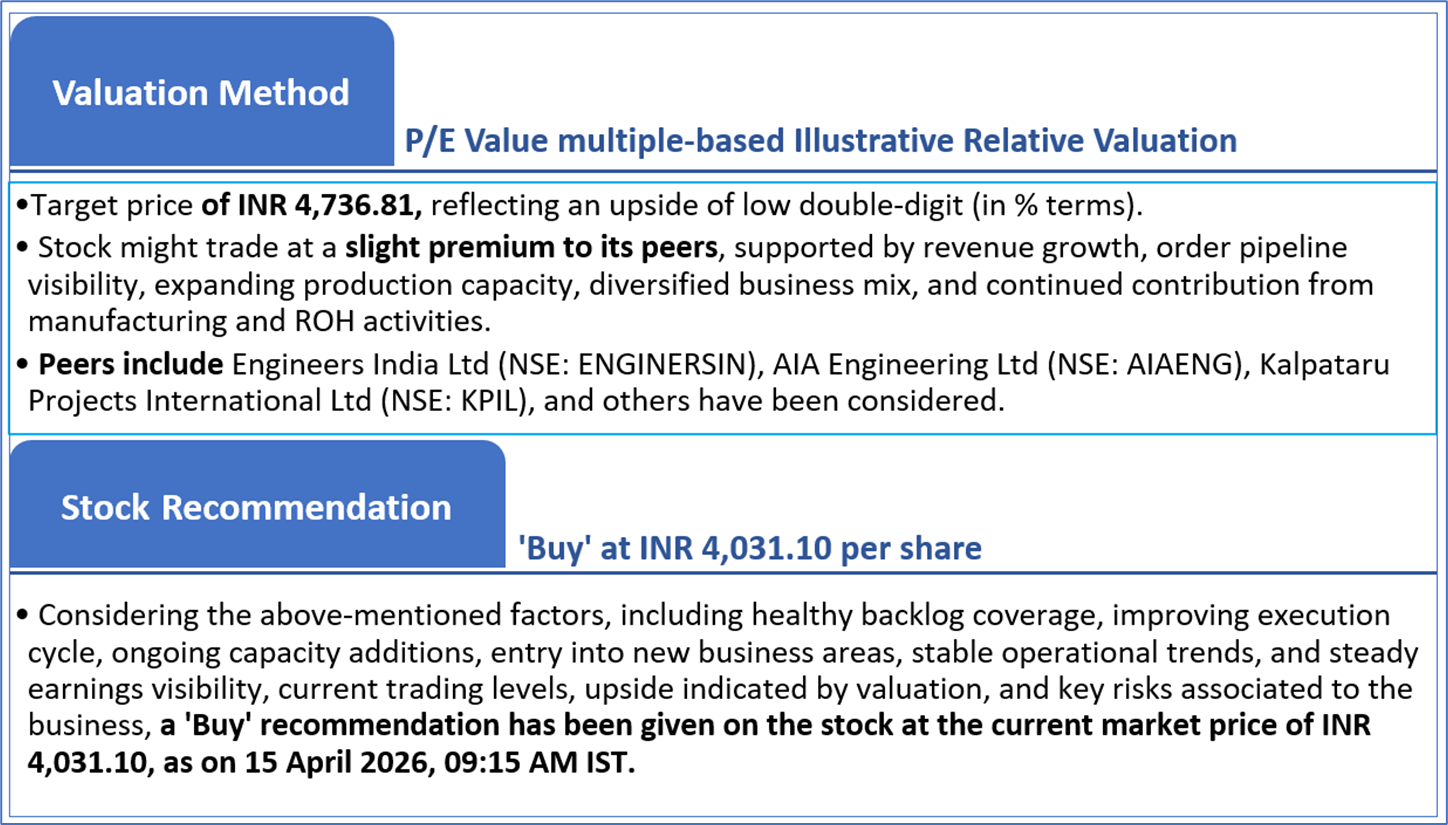
Markets are trading in a highly volatile zone currently due to certain macro-economic issues and geopolitical tensions prevailing. Therefore, it is prudent to follow a cautious approach while investing.
Note 1: Past performance is neither an indicator nor a guarantee of future performance.
Note 2: The reference date for all price data, currency, technical indicators, support, and resistance levels is 15 April 2026. The reference data in this report has been partly sourced from REFINITIV.
Note 3: Investment decisions should be made depending on an individual's appetite for upside potential, risks, holding duration, and any previous holdings. An 'Exit' from the stock can be considered if the Target Price mentioned as per the Valuation and or the technical levels provided have been achieved and is subject to the factors discussed above.
Note 4: Dividend Yield may vary as per the stock price movement.
Note 5: Kalkine reports are prepared based on the stock prices captured either from REFINITIV or Trading View. Typically, REFINITIV or Trading View may reflect stock prices with a delay which could be a lag of 25-30 minutes. There can be no assurance that future results or events will be consistent with the information provided in the report. The information is subject to change without any prior notice.
Technical Indicators Defined: -
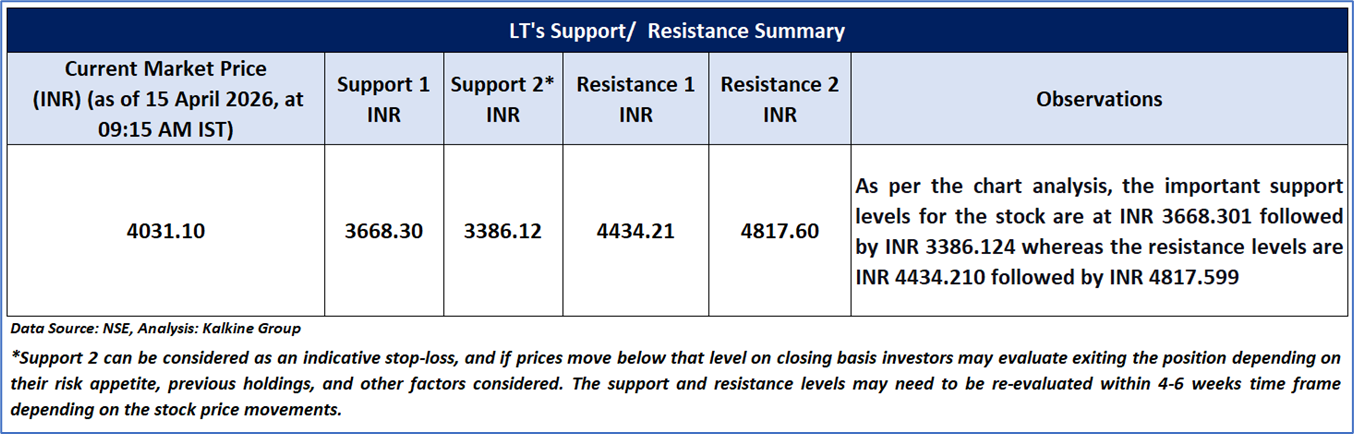
Support: A level at which the stock prices tend to find support if they are falling, and a downtrend may take a pause backed by demand or buying interest. Support 1 refers to the nearby support level for the stock and if the price breaches the level, then Support 2 may act as the crucial support level for the stock.
Resistance: A level at which the stock prices tend to find resistance when they are rising, and an uptrend may take a pause due to profit booking or selling interest. Resistance 1 refers to the nearby resistance level for the stock and if the price surpasses the level, then Resistance 2 may act as the crucial resistance level for the stock.
Stop-loss: It is a level to protect further losses in case of unfavourable movement in the stock prices.
Past performance is not a reliable indicator of future performance.

 NZ
 UK
 US
 AU
 IND

 CA

 Please wait processing your request...