Section 1: Company Overview and Fundamentals
1.1 Company Overview:
Lockheed Martin Corporation (NYSE: LMT) operates as a global aerospace and defense enterprise, specializing in the research, design, development, production, integration, and sustainment of advanced technology systems, products, and services. The company conducts its operations through four primary segments: Aeronautics, Missiles and Fire Control (MFC), Rotary and Mission Systems (RMS), and Space.
Kalkine’s Diversified Opportunities Report covers the Company Overview, Key positives & negatives, Investment summary, Key investment metrics, Top 10 shareholding, Business updates and insights into company recent financial results, Key Risks & Outlook, Price performance and technical summary, Target Price, and Recommendation on the stock.
Stock Performance:
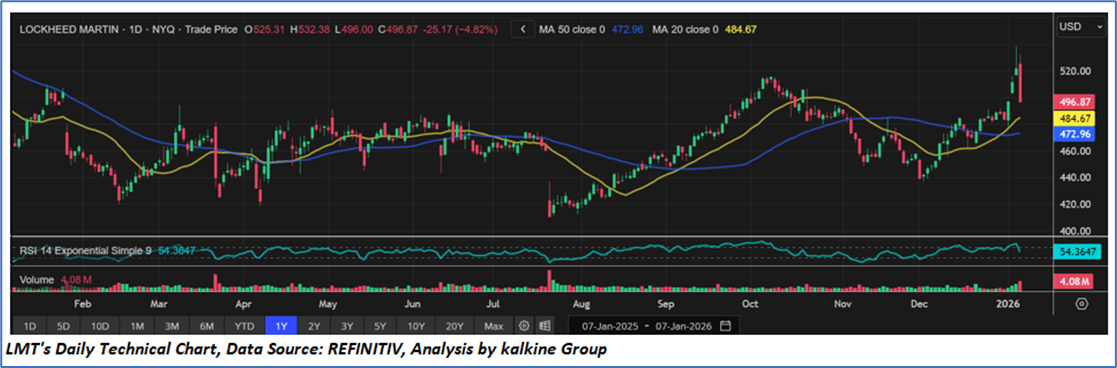
- The stock recorded a strong upside breakout above the USD 520 level, followed by a sharp pullback, highlighting profit-taking near resistance.
- Despite the correction, price continues to trade above the 20-day (USD 485) and 50-day (USD 473) moving averages, indicating the primary trend remains constructive.
- Momentum has moderated, with RSI in the mid-50s, suggesting a neutral-to-positive setup after cooling from overbought conditions.
- Volatility remains elevated, reflecting heightened short-term uncertainty after the recent surge.
- Holding above the 20–50 day moving average zone would support further upside, while a sustained break below this area could signal a deeper consolidation phase.
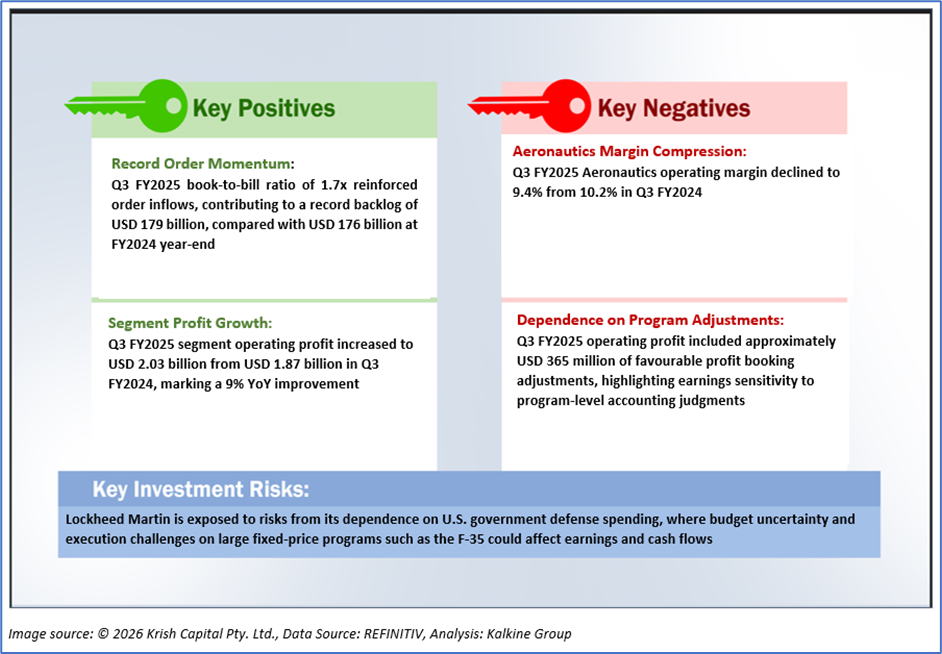
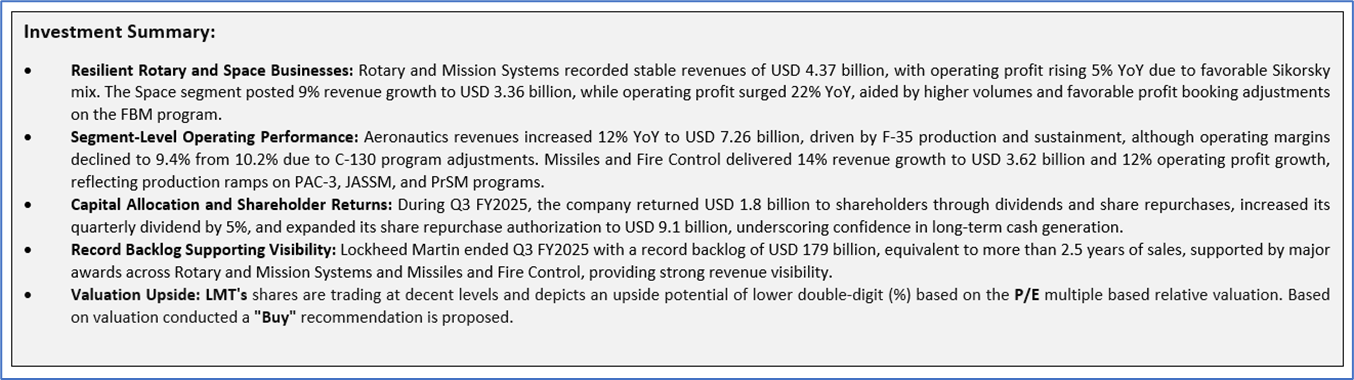
1.2 The Key Positives, Negatives, and Investment summary
1.3 Top 10 shareholders:
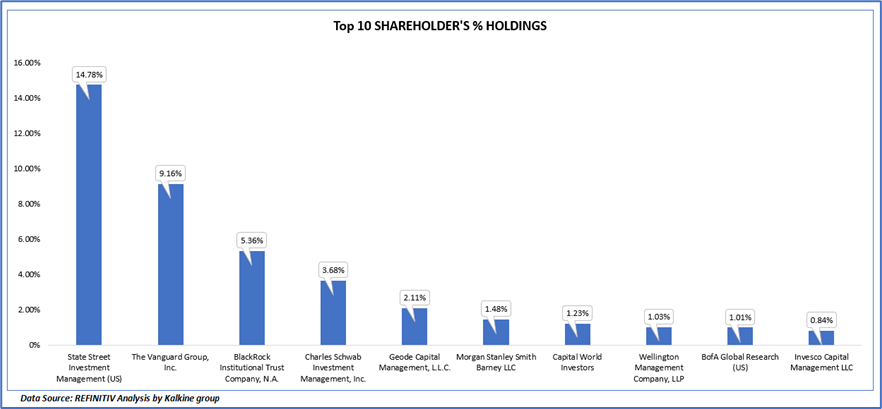
The top 10 shareholders together form ~ 40.69% of the total shareholding, signifying concentrated shareholding. State Street Investment Management (US) and The Vanguard Group, Inc are the biggest shareholders, holding the maximum stake in the company at 14.78% and 9.16%, respectively.
1.4 Key Metrics:
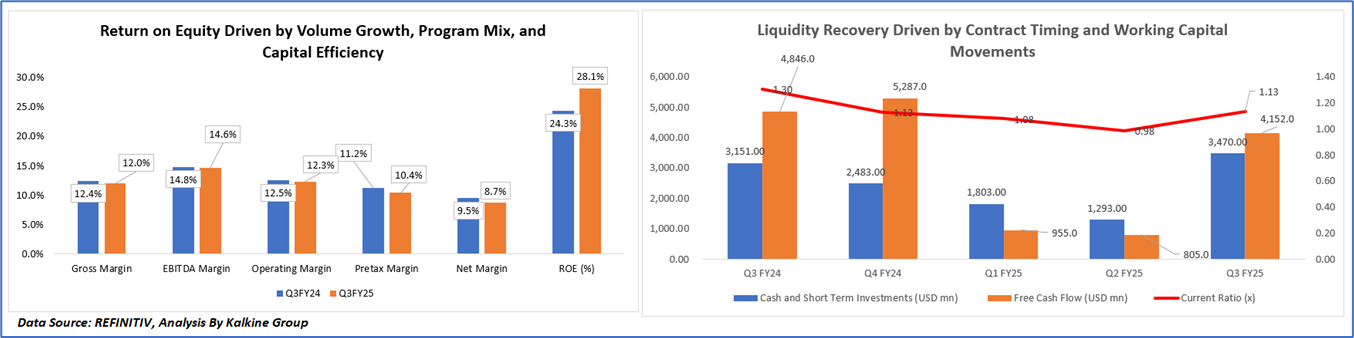
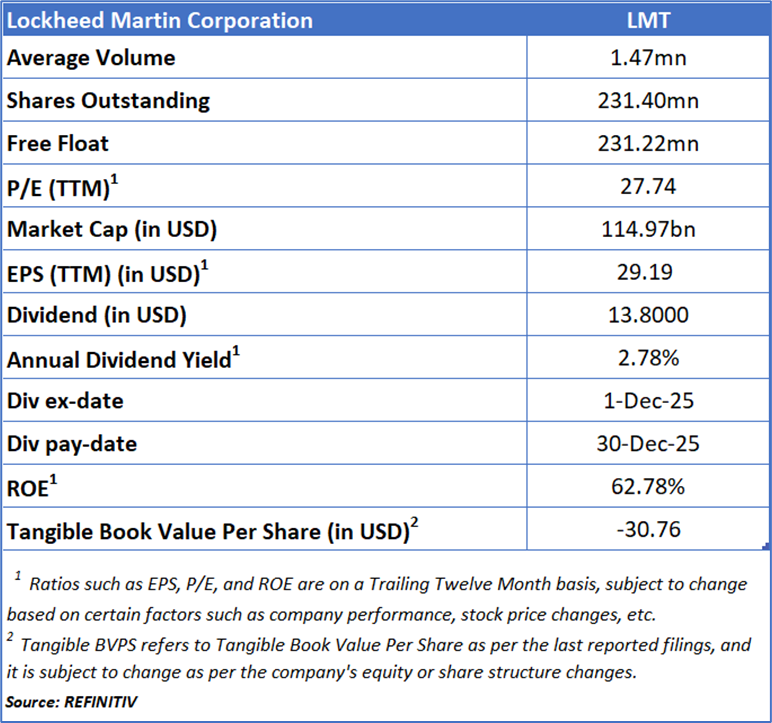
The improvement across most profitability and return metrics in the chart is primarily driven by higher volumes, favorable program mix, and stronger execution in key segments during Q3 FY25, partially offset by program-specific margin pressures. Gross and EBITDA margins expanded due to increased deliveries and production ramp-ups in Missiles and Fire Control and Space, where higher throughput and favorable profit booking adjustments supported operating leverage. Operating margin improved modestly, reflecting higher segment operating profit, although gains were tempered by margin compression in Aeronautics arising from unfavorable adjustments on C-130 programs. The decline in pretax margin was largely attributable to higher interest expense and an increased effective tax burden, which constrained operating gains. Net margin improved as stronger operating performance and scale benefits outweighed tax and financing headwinds. The sharp rise in ROE to 28.1% in Q3 FY25 from 24.3% in Q3 FY24 was driven by stable earnings combined with a reduced equity base, reflecting sustained share repurchases and disciplined capital deployment, consistent with management’s shareholder return strategy.
Considering LMT’s liquidity structure, the observed volatility in the chart is primarily attributable to working capital dynamics, contract execution milestones, and capital allocation decisions rather than any deterioration in underlying financial strength. From Q3 FY24 to Q2 FY25, cash balances and free cash flow declined due to elevated shareholder returns, higher capital expenditures, and working capital absorption from production ramp-ups across key programs, including the F-35, which also pressured liquidity and reduced the current ratio to 0.98x in Q2 FY25. The subsequent rebound in Q3 FY25 was supported by strong operating cash inflows following F-35 Lots 18–19 contract definitization, improved customer advances, and lower tax payments, lifting free cash flow to USD 3.3 billion, restoring cash balances, and improving the current ratio to 1.13x.
Section 2: Business Updates and Corporate Business Highlights
2.1 Recent Business Updates
2.2 Insights of Q3FY25:
Section 3: Key Risks & Outlook

Section 4: Stock Recommendation Summary:
4.1 Price Performance and Technical Summary:
Stock Performance:
- The stock recorded a strong upside breakout above the USD 520 level, followed by a sharp pullback, highlighting profit-taking near resistance.
- Despite the correction, price continues to trade above the 20-day (USD 485) and 50-day (USD 473) moving averages, indicating the primary trend remains constructive.
- Momentum has moderated, with RSI in the mid-50s, suggesting a neutral-to-positive setup after cooling from overbought conditions.
- Volatility remains elevated, reflecting heightened short-term uncertainty after the recent surge.
- Holding above the 20–50 day moving average zone would support further upside, while a sustained break below this area could signal a deeper consolidation phase.
4.2 Fundamental Valuation
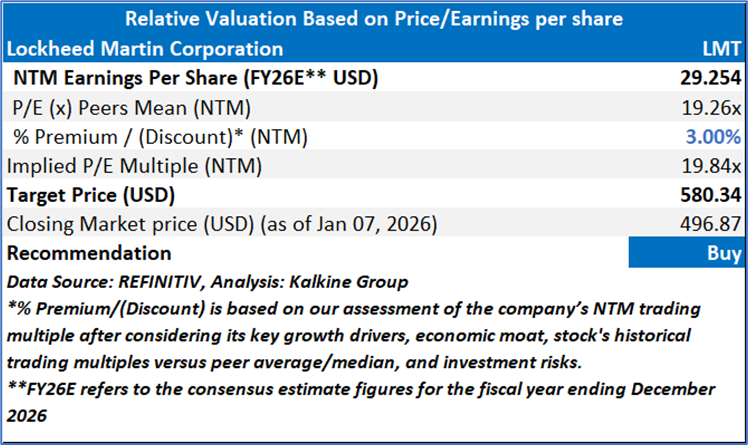
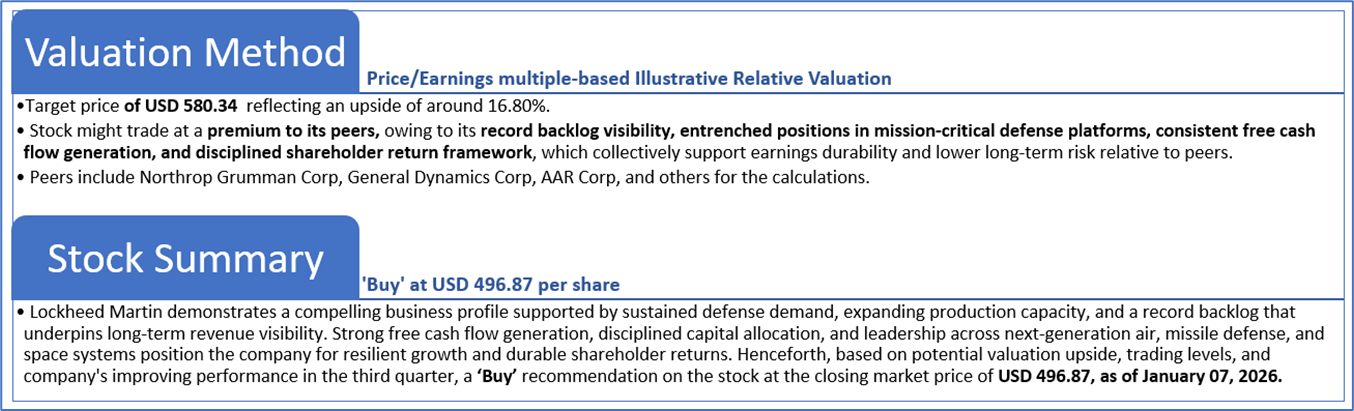
Valuation Methodology: Price/Earnings Multiple Based Relative Valuation
Markets are trading in a highly volatile zone currently due to certain macroeconomic issues and geopolitical tensions prevailing. Therefore, it is prudent to follow a cautious approach while investing.
Note 1: Past performance is not a reliable indicator of future performance.
Note 2: The reference date for all price data, currency, technical indicators, support, and resistance levels is January 07, 2026. The reference data in this report has been partly sourced from REFINITIV.
Note 3: Investment decisions should be made depending on an individual's appetite for upside potential, risks, holding duration, and any previous holdings. An 'Exit' from the stock can be considered if the Target Price mentioned as per the Valuation and or the technical levels provided has been achieved and is subject to the factors discussed above.
Note 4: The report publishing date is as per the Pacific Time Zone.
Technical Indicators Defined: -
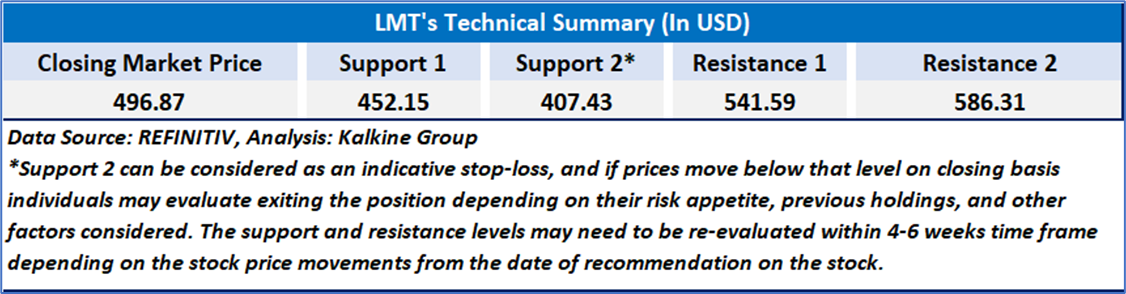
Support: A level at which the stock prices tend to find support if they are falling, and a downtrend may take a pause backed by demand or buying interest. Support 1 refers to the nearby support level for the stock and if the price breaches the level, then Support 2 may act as the crucial support level for the stock.
Resistance: A level at which the stock prices tend to find resistance when they are rising, and an uptrend may take a pause due to profit booking or selling interest. Resistance 1 refers to the nearby resistance level for the stock and if the price surpasses the level, then Resistance 2 may act as the crucial resistance level for the stock.
Stop-loss: It is a level to protect against further losses in case of unfavorable movement in the stock prices.
Past performance is not a reliable indicator of future performance.

 NZ
 UK
 US
 AU
 IND

 CA

 Please wait processing your request...