Section 1: Company Overview, Shariah Compliance Standards and Fundamentals
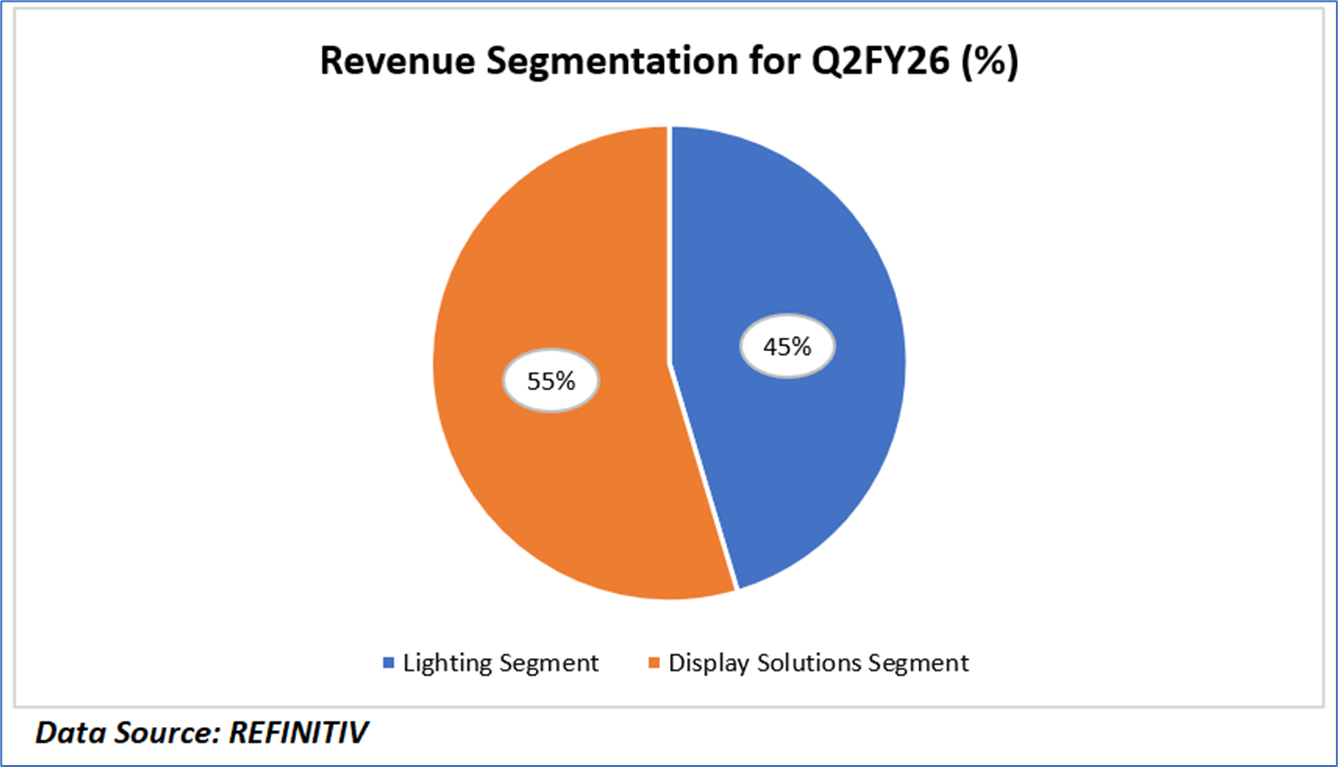
Section 1.1: LSI Industries Inc. (NASDAQ: LYTS) is a producer of non-residential lighting and retail display solutions. The Company operates through two segments: Lighting and Display Solutions. The Lighting Segment manufactures, markets, and sells outdoor and indoor lighting fixtures and control solutions in the vertical markets: refueling and convenience store, parking lot and garage, quick-service restaurant, retail, grocery and pharmacy, automotive dealership, sports court and field, and warehouse.
Kalkine’s ‘The Shariah Compliance Report’ covers the Investment Highlights, Shariah-compliance standards, Key Financial Metrics, Risks, and Technical Analysis along with the Valuation, Target Price, and Recommendation on the stock.

Section 1.2: What are the Key Metrics for Shariah Compliance to be Considered?
The Shariah Compliance Report aims to identify equities that align with Shariah and ethical principles, providing valuable insights on financial metrics, business activities and compliance with Islamic finance norms.
Key Shariah Screening Criteria and Thresholds
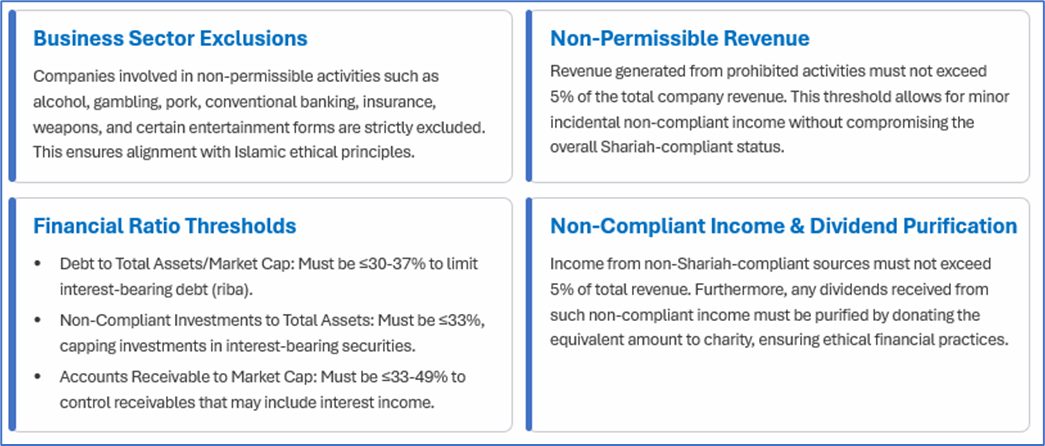
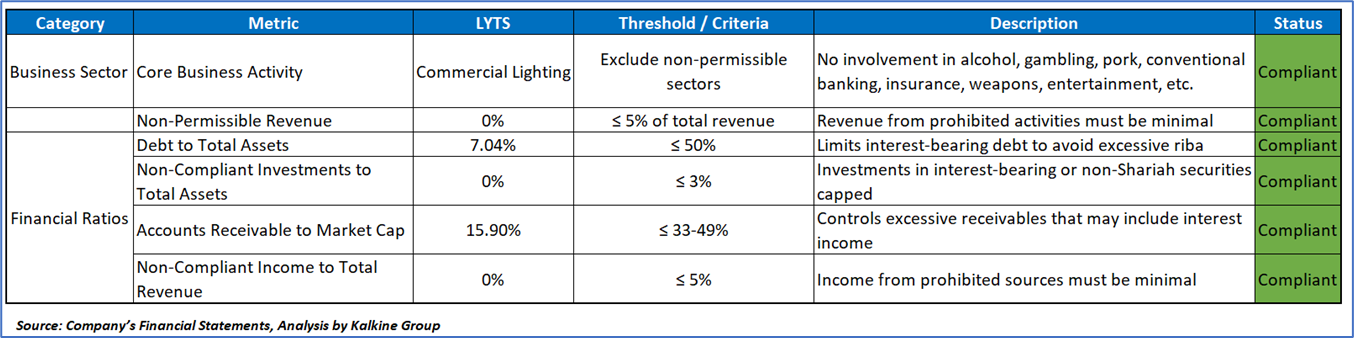
Shariah Metrics for LSI Industries Inc (NASDAQ: LYTS):
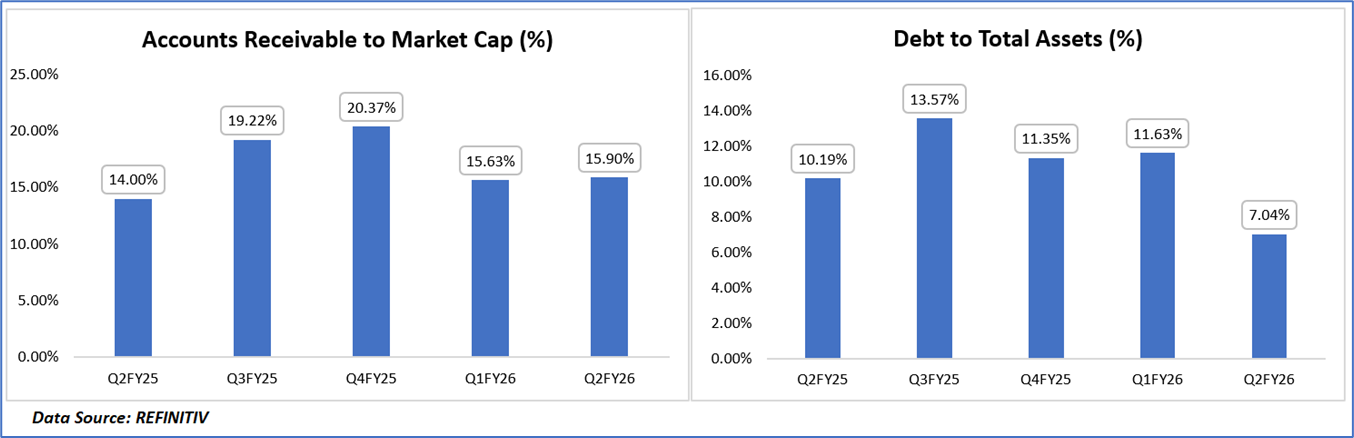
Revenue Segmentation of LYTS in Q2FY26 & Historical Compliance of Financial Ratios:
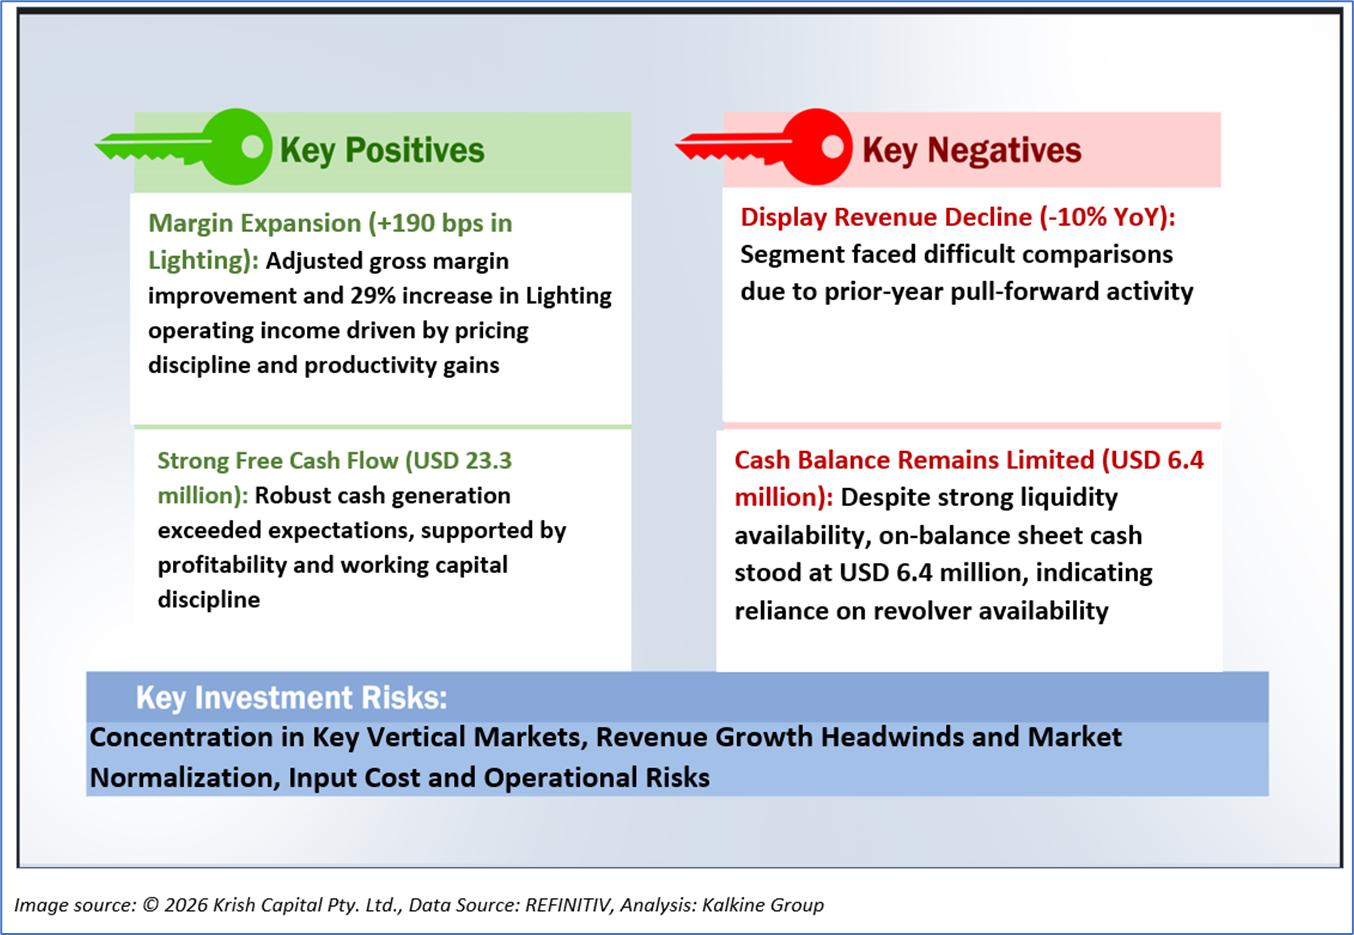
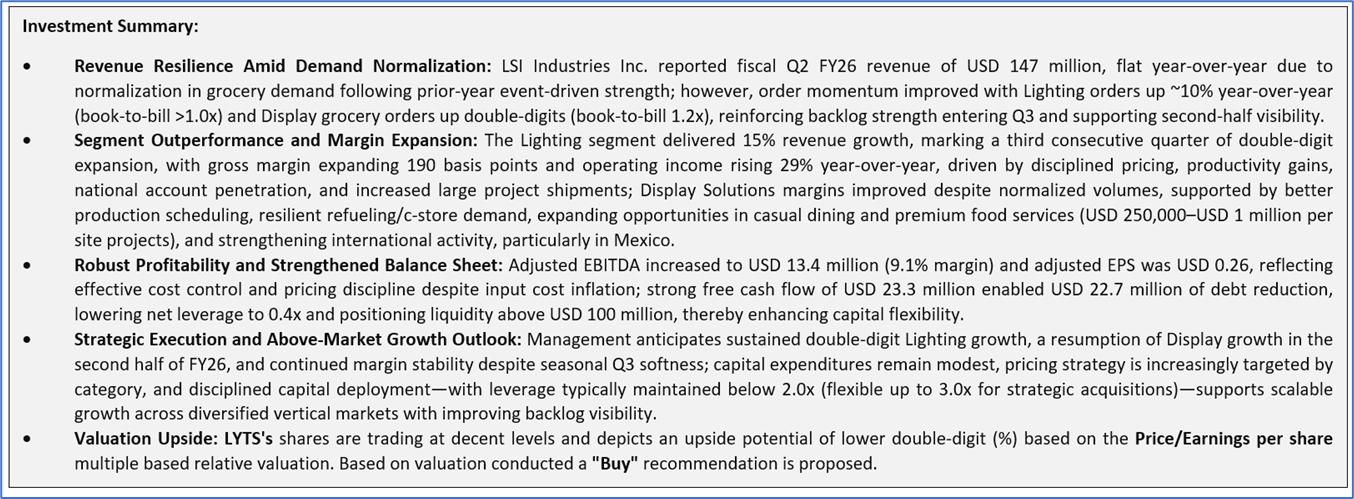
1.3 The Key Positives, Negatives, and Investment summary
1.4 Top 10 shareholders:
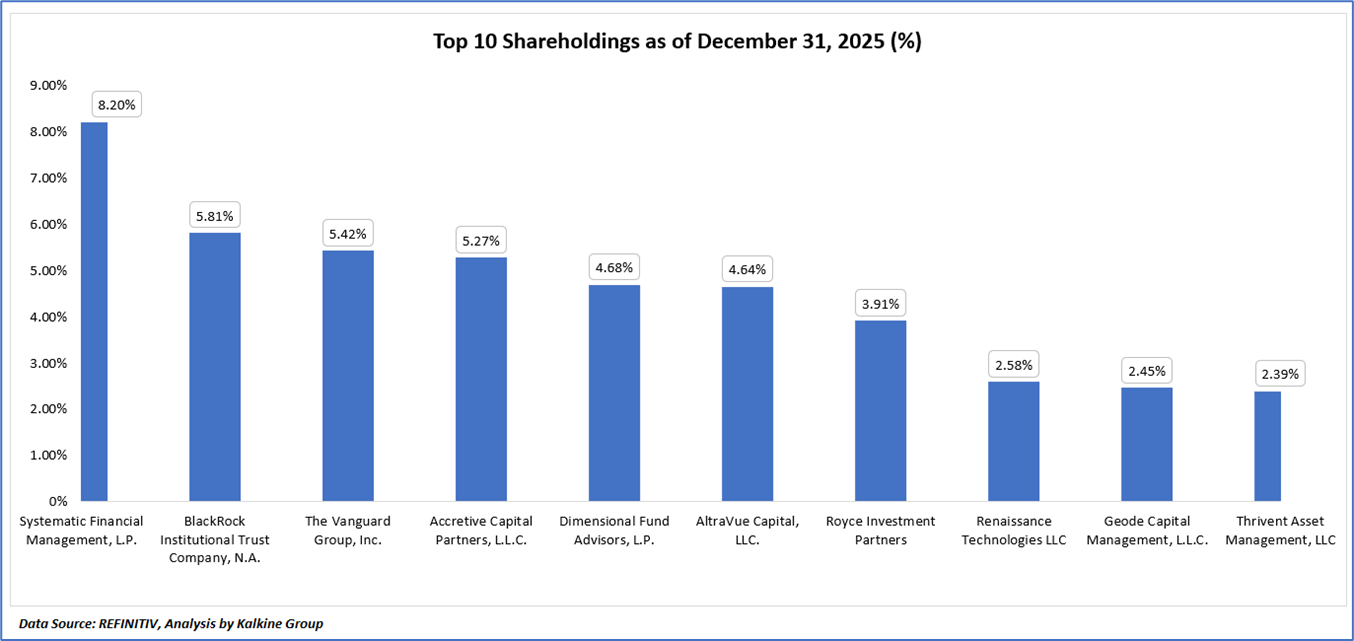
The top 10 shareholders together form ~45.36% of the total shareholding, signifying concentrated shareholding. Systematic Financial Management, L.P., and BlackRock Institutional Trust Company, N.A. are the biggest shareholders, holding the maximum stake in the company at ~8.20% and ~5.81%, respectively.
1.4 Key Metrics:
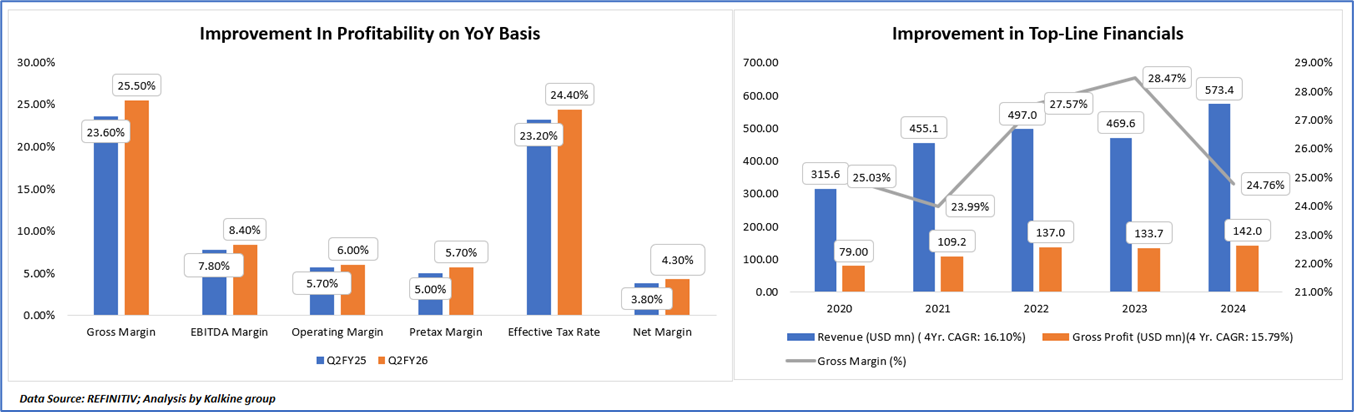
Revenue Growth Trajectory and Scale Expansion: LSI Industries Inc. delivered strong top-line expansion over FY2020–FY2024, with revenue increasing from USD 315.6 million to USD 573.4 million, reflecting a 4-year CAGR of 16.10%. Growth accelerated meaningfully in FY21 and FY24, though FY23 saw a temporary contraction (-5.5% YoY), highlighting cyclical exposure. Overall, the company has structurally expanded revenue scale, but year-to-year volatility indicates sensitivity to vertical demand cycles and project timing.
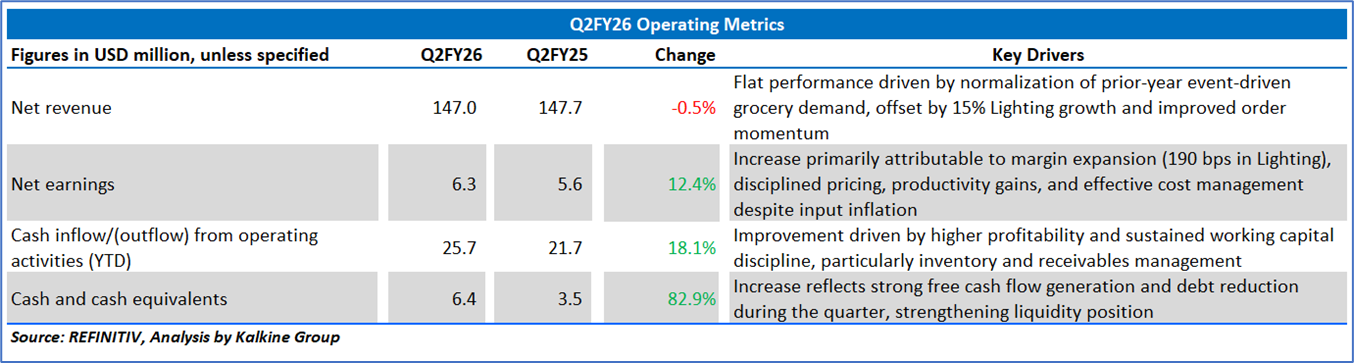
Gross Profit and Margin Volatility: Gross profit increased from USD 79.0 million (FY20) to USD 142.0 million (FY24), broadly tracking revenue growth with a 15.79% CAGR. However, gross margins fluctuated between 23.99% and 28.47%, peaking in FY23 before compressing to 24.76% in FY24 (-371 bps YoY), suggesting mix normalization and cost pressures. Notably, Q2FY26 gross margin improved to 25.50% versus 23.60% in Q2FY25, indicating early signs of operational recovery and pricing discipline despite prior full-year margin softness.
Profitability Improvement in Q2FY26: Quarterly profitability metrics demonstrate sequential strengthening: EBITDA margin improved to 8.40% (vs 7.80%), operating margin to 6.00% (vs 5.70%), pretax margin to 5.70% (vs 5.00%), and net margin to 4.30% (vs 3.80%), despite a higher effective tax rate (24.40%). While net margins remain structurally modest, Q2FY26 reflects improving operating leverage, cost control, and margin stabilization following FY24 volatility, supporting near-term earnings resilience.
Section 2: Business Updates and Financial Highlights
2.1 Recent Updates:
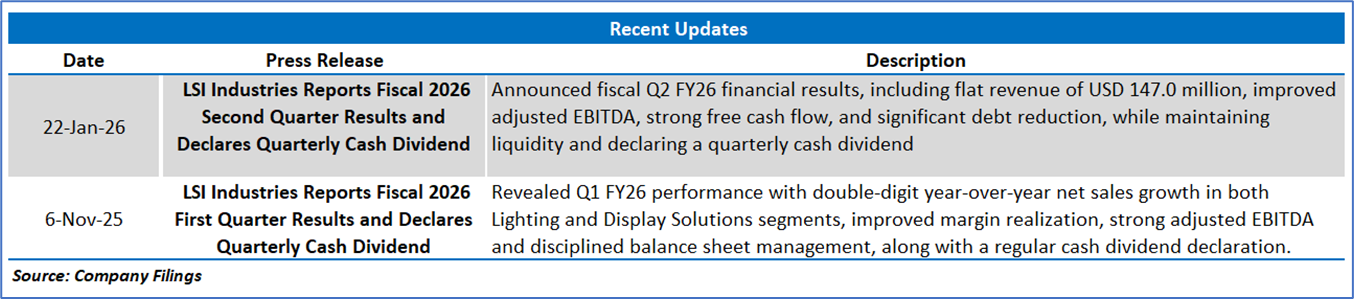
The below picture gives an overview of the recent updates:
2.2 Insights of Q2FY26:
Section 3: Key Risks and Outlook:
Section 4: Stock Recommendation Summary:
4.1 Technical Summary:
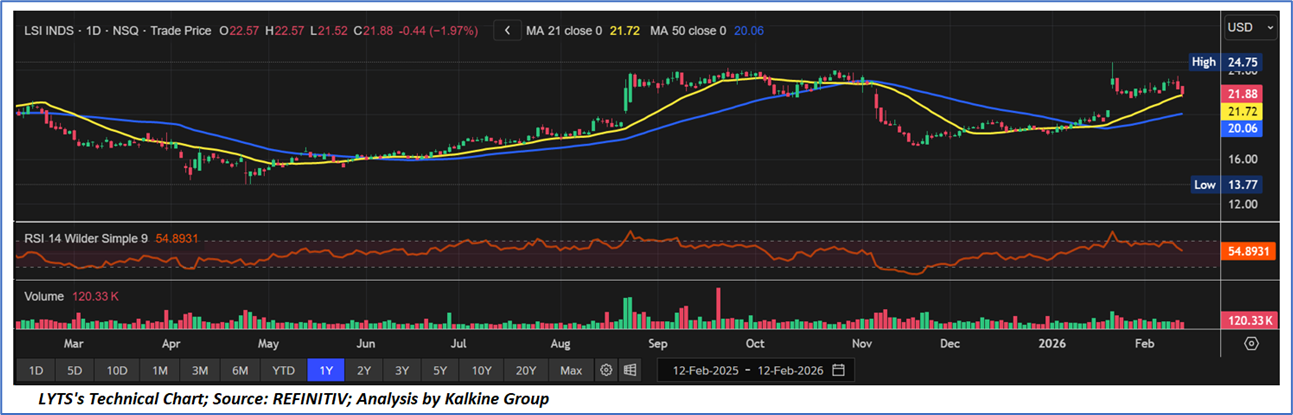
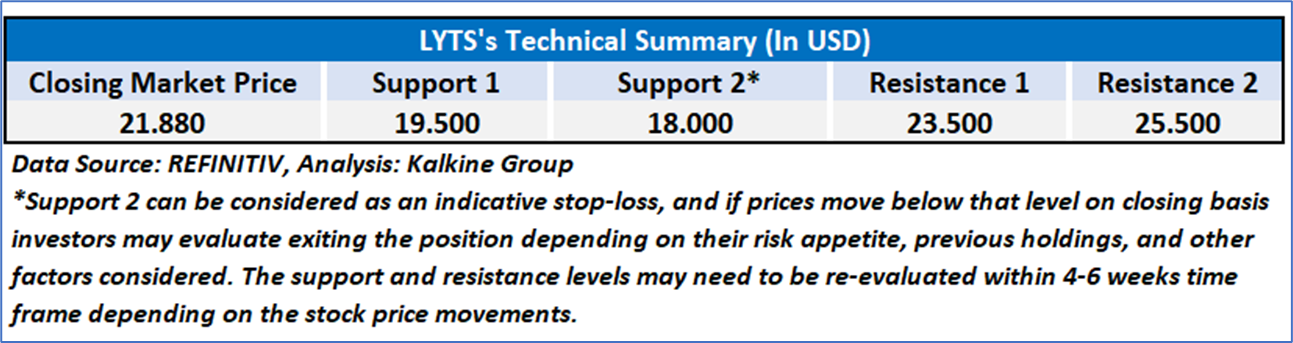
Trend Structure and Moving Averages: LSI Industries Inc. is trading at USD 21.88, positioned above both its 21-day moving average (USD 21.72) and 50-day moving average (USD 20.06), indicating short-term bullish alignment. The upward slope of the shorter moving average relative to the longer average reflects positive momentum following the November pullback. The stock remains below the recent 52-week high of USD 24.75, while the broader price structure shows higher lows since December, suggesting constructive consolidation within an intermediate uptrend.
Momentum and RSI Positioning: The RSI (14-day) stands at ~54.9, placing the stock in neutral-to-mildly bullish territory. This indicates neither overbought (>70) nor oversold (<30) conditions, leaving room for further upside if buying pressure strengthens. The RSI recovery from sub-40 levels in late November confirms improving momentum, though the current flattening suggests consolidation rather than breakout acceleration.
Volume and Key Technical Levels: Recent volume (~120K shares) appears moderate relative to prior spikes seen during September and November volatility, indicating the current move lacks aggressive accumulation but remains stable. Immediate support is observed near the USD 21.70–20.00 range (confluence of 21-DMA and 50-DMA), while resistance lies at USD 24.75 (recent high). A sustained breakout above this level could signal continuation toward higher price discovery, whereas a breakdown below the 50-DMA may expose downside toward the mid-USD 16–18 range seen in prior corrections.
4.2 Fundamental Valuation
Valuation Methodology: Price/Earnings Per Share Multiple Based Relative Valuation
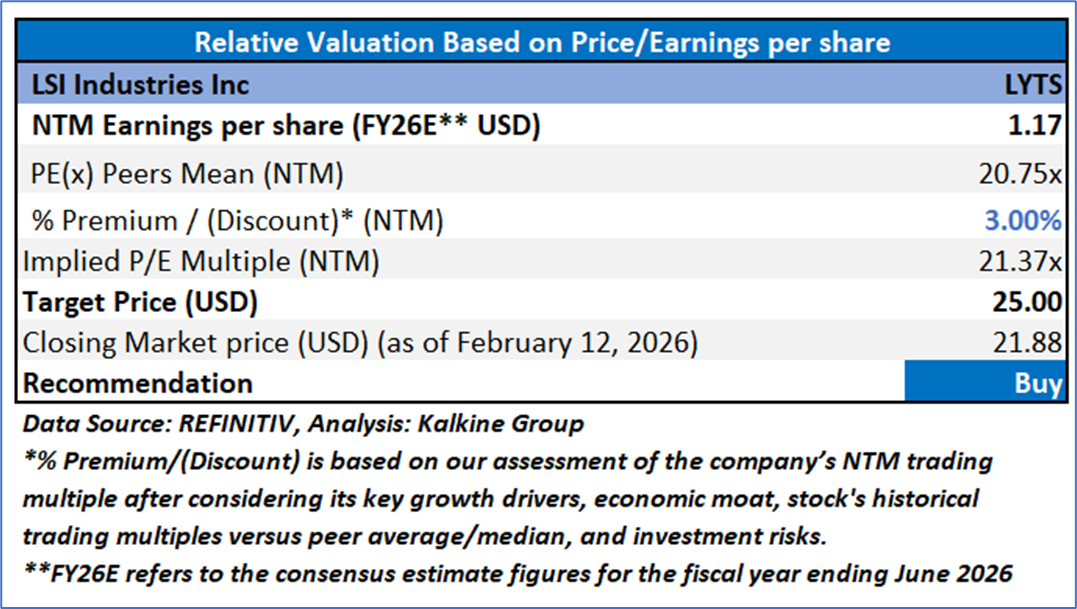
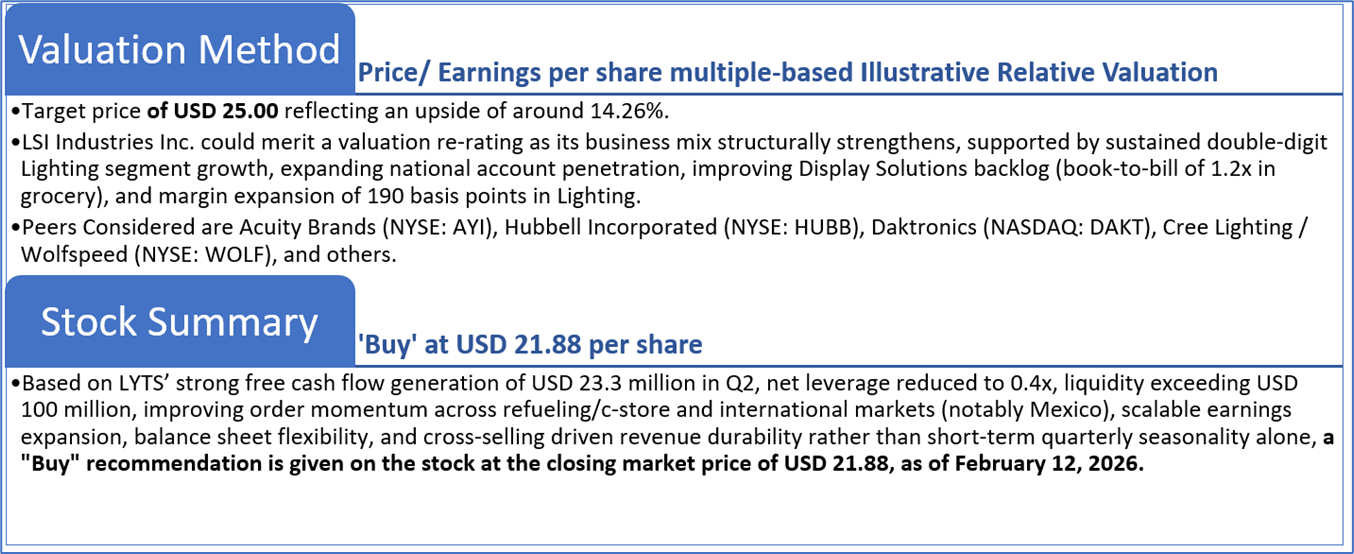
Markets are trading in a highly volatile zone currently due to certain macroeconomic issues and geopolitical tensions prevailing. Therefore, it is prudent to follow a cautious approach while investing.
Note 1: Past performance is not a reliable indicator of future performance.
Note 2: The reference date for all price data, currency, technical indicators, support, and resistance levels is February 12, 2026. The reference data in this report has been partly sourced from REFINITIV.
Note 3: Investment decisions should be made depending on an individual's appetite for upside potential, risks, holding duration, and any previous holdings. An 'Exit' from the stock can be considered if the Target Price mentioned as per the Valuation and or the technical levels provided have been achieved and is subject to the factors discussed above.
Note 4: The report publishing date is as per the Pacific Time Zone.
Technical Indicators Defined: -
Support: A level at which the stock prices tend to find support if they are falling, and a downtrend may take a pause backed by demand or buying interest. Support 1 refers to the nearby support level for the stock and if the price breaches the level, then Support 2 may act as the crucial support level for the stock.
Resistance: A level at which the stock prices tend to find resistance when they are rising, and an uptrend may take a pause due to profit booking or selling interest. Resistance 1 refers to the nearby resistance level for the stock and if the price surpasses the level, then Resistance 2 may act as the crucial resistance level for the stock.
Stop-loss: It is a level to protect against further losses in case of unfavorable movement in the stock prices.
Past performance is not a reliable indicator of future performance.

 NZ
 UK
 US
 AU
 IND

 CA

 Please wait processing your request...