Section1: Commodity Update:
Gold climbed toward $3,330 per ounce recently, marking its fourth consecutive daily gain and reaching its highest level in nearly two weeks. The rally was driven by growing demand for safe-haven assets amid mounting concerns over the U.S. fiscal outlook. Investor sentiment soured following the release of a proposed federal budget that could further expand the already substantial deficit, alongside Moody’s recent downgrade of the U.S. credit rating due to escalating debt and the Federal Reserve’s cautious economic stance. Heightened geopolitical tensions also boosted gold’s appeal, with ongoing conflict in the Middle East and former President Trump appearing to step back from efforts to mediate the Russia-Ukraine war. Additionally, Chinese customs data revealed that gold imports surged to an 11-month high of 127.5 metric tonnes in April—up 73% from March—fueled by strong domestic demand and increased import quotas issued by the central bank amid heightened U.S.-China trade friction.
Data Source: Trading Economics
Section2: Company Overview and Fundamental Insights:
2.1 Company Overview:
Mandalay Resources Corporation (TSX: MND) is a Canadian-based natural resource Corporation with producing assets in Australia and Sweden, and care and maintenance and development projects in Chile and Canada. The Company focuses on growing its production and reducing costs at its gold-antimony operation in Australia, and its gold mine in Sweden, to generate near-term sustainable positive cash flow.
Kalkine’s Resource Report covers the Investment Highlights, Key Financial Metrics, Risks, Technical Analysis along with the Valuation, Target Price, and Recommendation on the stock.
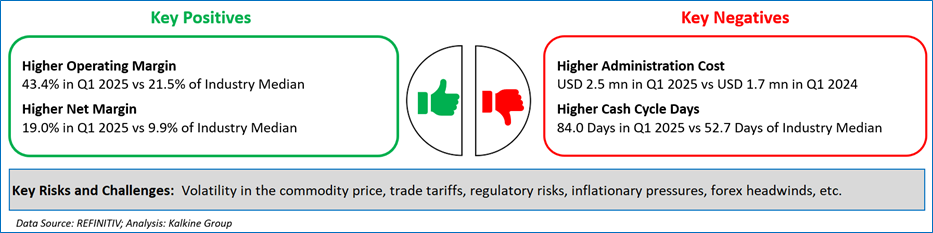
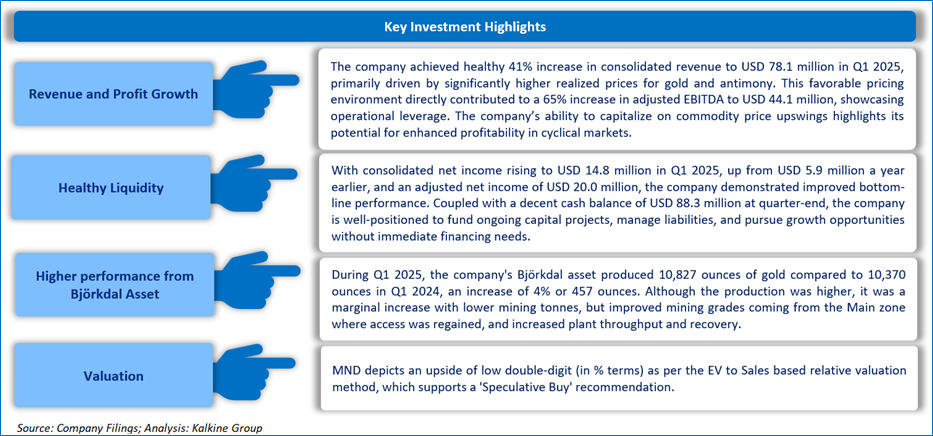
2.2 The Key Positives, Negatives, Investment Highlights and Risks
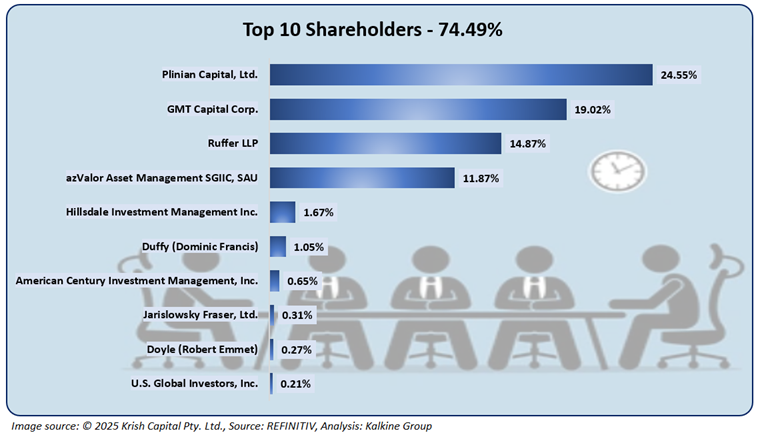
2.3 Top 10 Shareholders:
The top ten shareholders own around 74.49% of the total holdings. Plinian Capital, Ltd. and GMT Capital Corp. have maximum ownership in the company of around 24.55% and 19.02%, respectively.
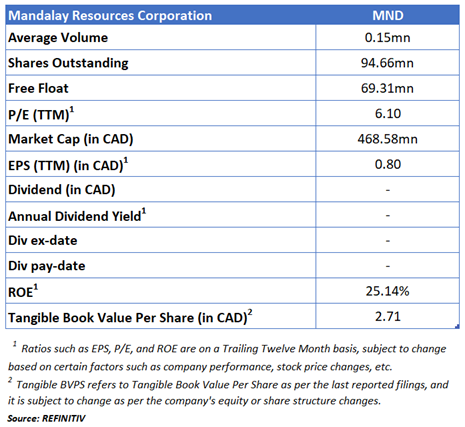
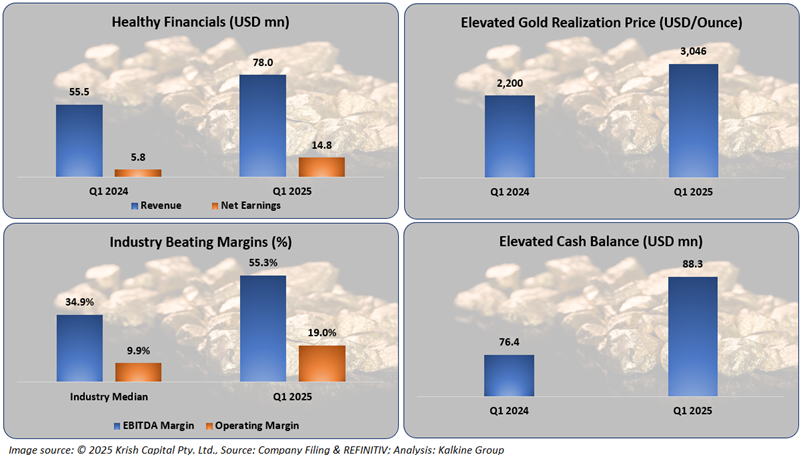
2.4 Key Metrics:
The company has consistently recorded decent financial results, which demonstrates its proven business model. The improvement in financial data was solely due to an increase in the realization price. Furthermore, the company generated industry beating margins and elevated cash balance.
Section 3: Business Updates and Financial Highlights
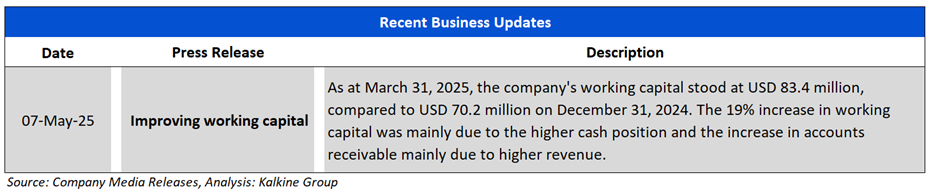
3.1 Recent Updates: The picture below gives an overview of the company’s recent activity where it reported improvement in its working capital.
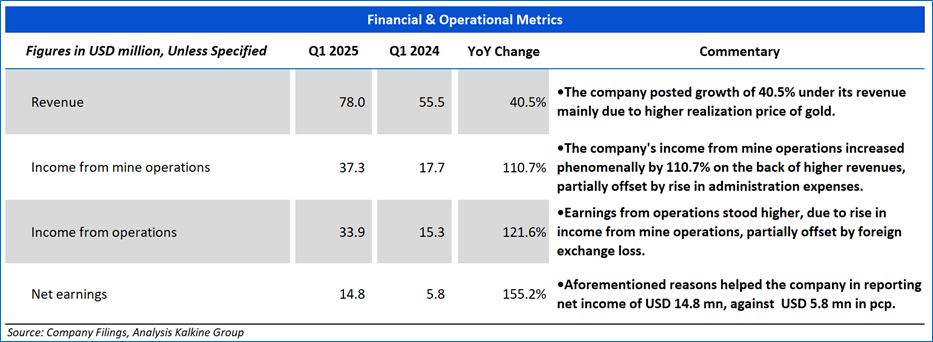
3.2 Insights into Q1 2025 Financial Performance:
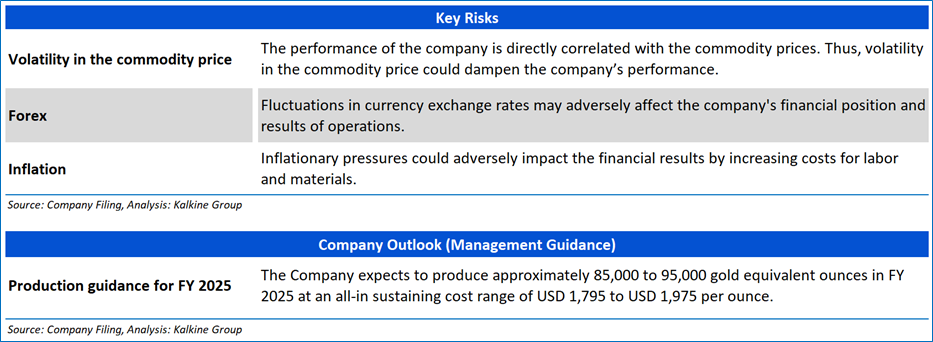
Section 4: Key Risks and Company Outlook
Section 5: Stock Recommendation Summary:
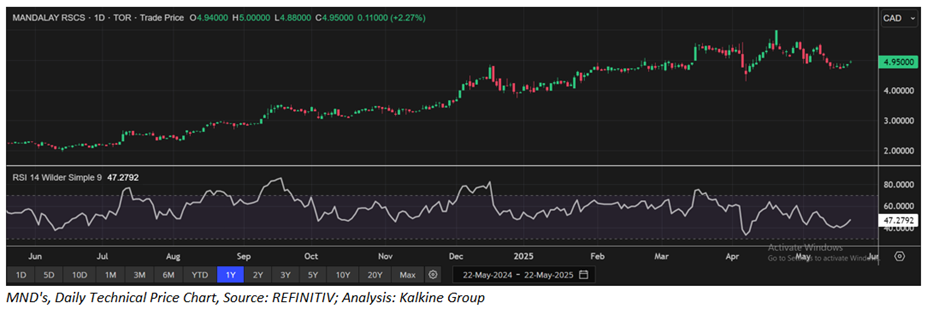
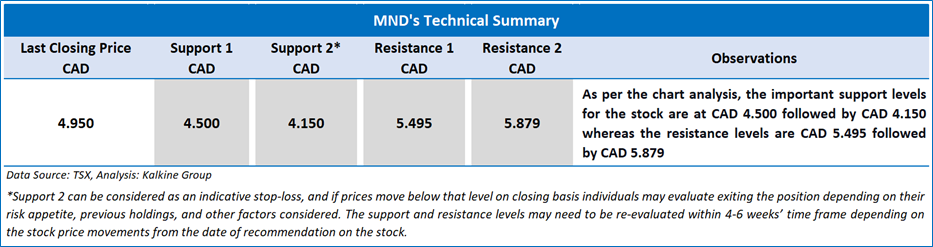
5.1 Price Performance and Technical Summary:

The stock has witnessed an upside of ~2.91% and a downside of ~7.99% over the last 1 week and 1 month respectively. Moreover, the stock is trading above the average 52-week high price of CAD 5.99 and 52-week low price of CAD 1.96, providing an opportunity to ride the trend.
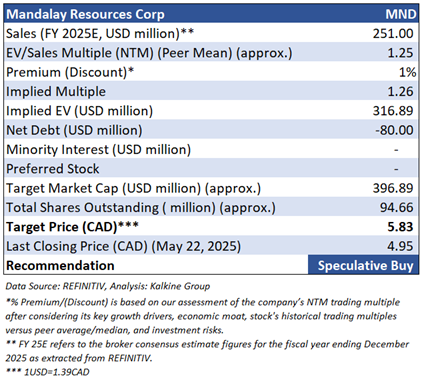
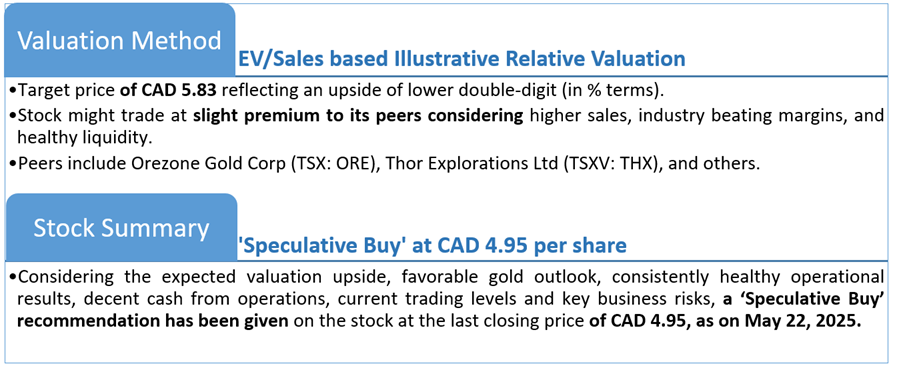
5.2 Fundamental Valuation
Valuation Methodology: EV to Sales Multiple Based Relative Valuation (Illustrative)
Markets are trading in a highly volatile zone currently due to certain macroeconomic issues and geopolitical tensions prevailing. Therefore, it is prudent to follow a cautious approach while investing.
Note 1: Past performance is not a reliable indicator of future performance.
Note 2: The reference date for all price data, currency, technical indicators, support, and resistance levels is May 22, 2025. The reference data in this report has been partly sourced from REFINITIV.
Note 3: Investment decisions should be made depending on an individual's appetite for upside potential, risks, holding duration, and any previous holdings. An 'Exit' from the stock can be considered if the Target Price mentioned as per the Valuation and or the technical levels provided has been achieved and is subject to the factors discussed above.
Note 4: Dividend Yield may vary as per the stock price movement.
Note 5: Kalkine reports are prepared based on the stock prices captured either from REFINITIV or Trading View. Typically, REFINITIV or Trading View may reflect stock prices with a delay which could be a lag of 25-30 minutes. There can be no assurance that future results or events will be consistent with the information provided in the report. The information is subject to change without any prior notice.
Technical Indicators Defined: -
Support: A level at which the stock prices tend to find support if they are falling, and a downtrend may take a pause backed by demand or buying interest. Support 1 refers to the nearby support level for the stock and if the price breaches the level, then Support 2 may act as the crucial support level for the stock.
Resistance: A level at which the stock prices tend to find resistance when they are rising, and an uptrend may take a pause due to profit booking or selling interest. Resistance 1 refers to the nearby resistance level for the stock and if the price surpasses the level, then Resistance 2 may act as the crucial resistance level for the stock.
Stop-loss: It is a level to protect further losses in case of unfavourable movement in the stock prices.
Past performance is not a reliable indicator of future performance.

 Please wait processing your request...