Section 1: Introduction
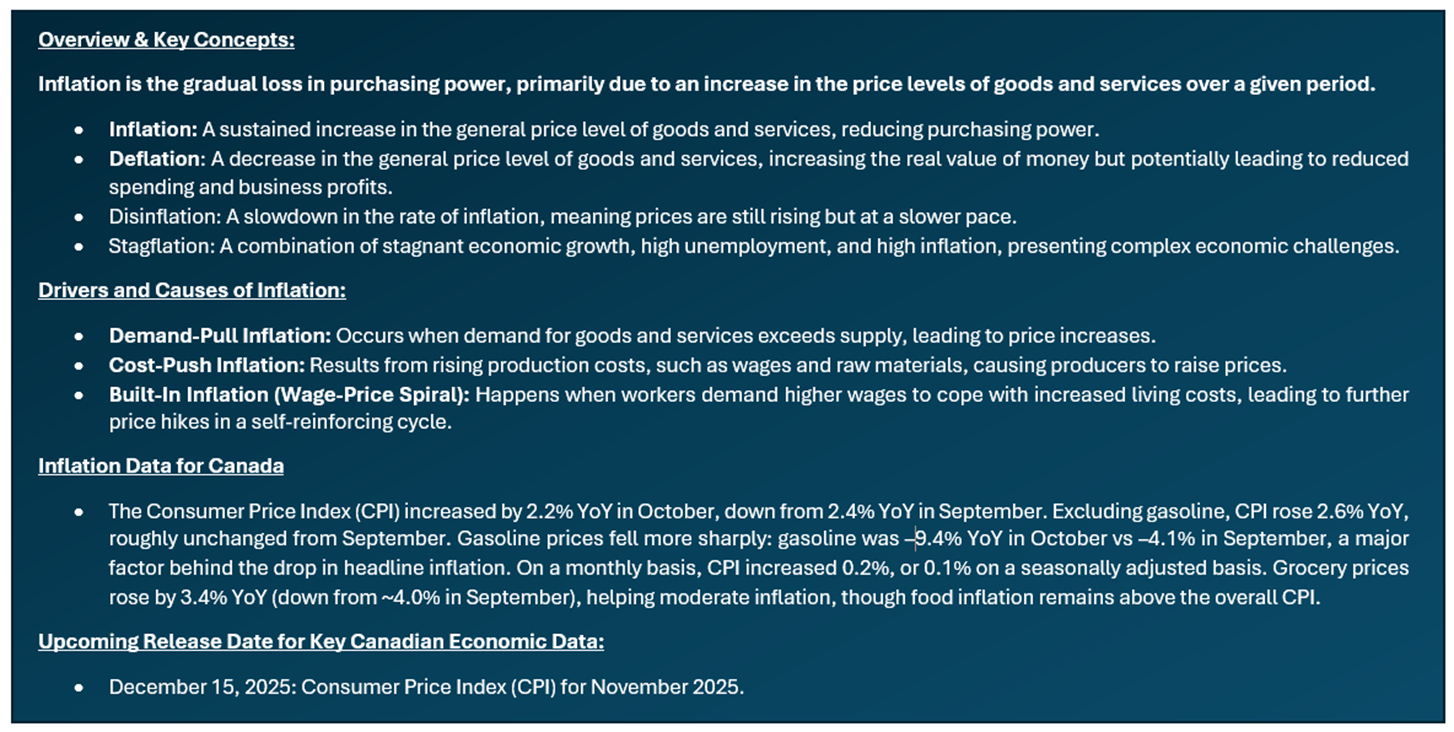
Inflation Report Coverage:
- Inflation report highlights how inflation impacts sectors differently, favoring value and defensive sectors like Energy, Materials, Consumer Staples, Healthcare, Utilities, select Financials, and REITs with inflation-indexed leases, while rate-sensitive sectors like Consumer Discretionary and high-growth Tech typically underperform.
- The report focuses on companies with proven business models, steady financials, high free cash flow, and solid ROE that can pass on costs to customers and protect margins. The aim is to identify stocks that can outperform inflation via capital gains and dividends, supporting diversified sectoral exposure.
Stocks Covered:
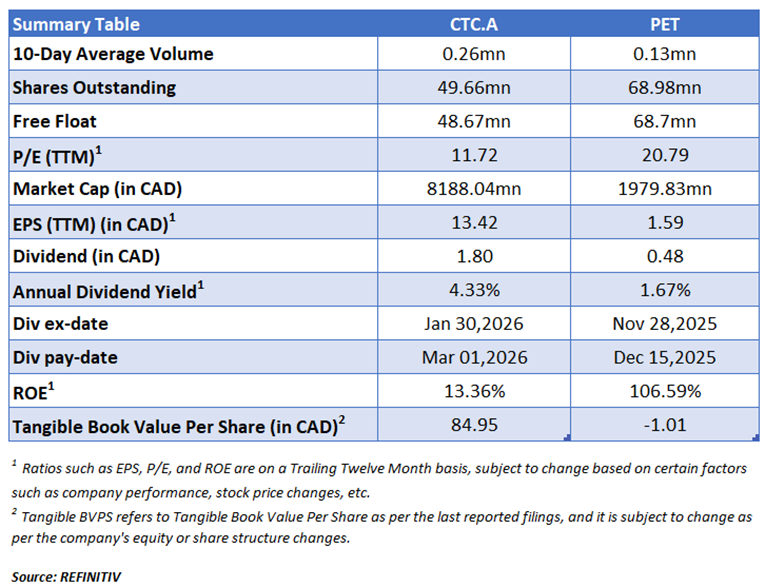
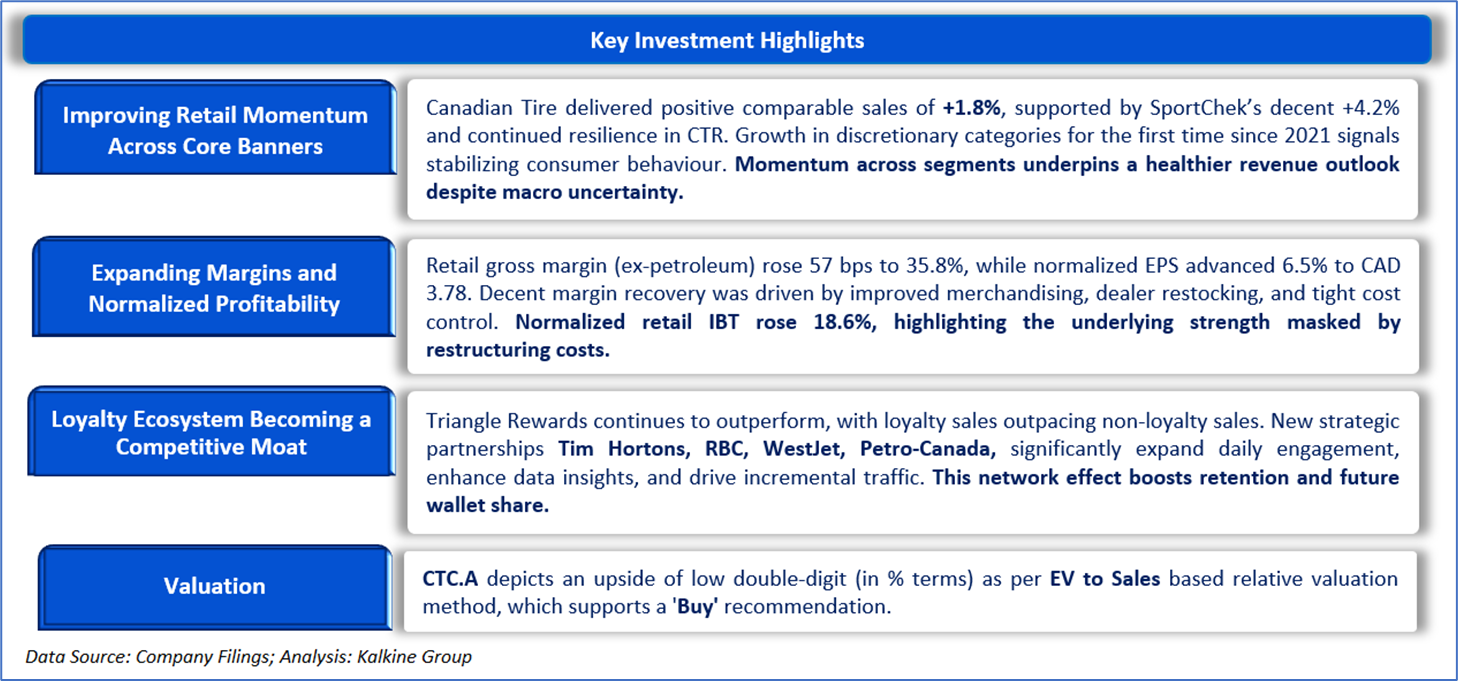
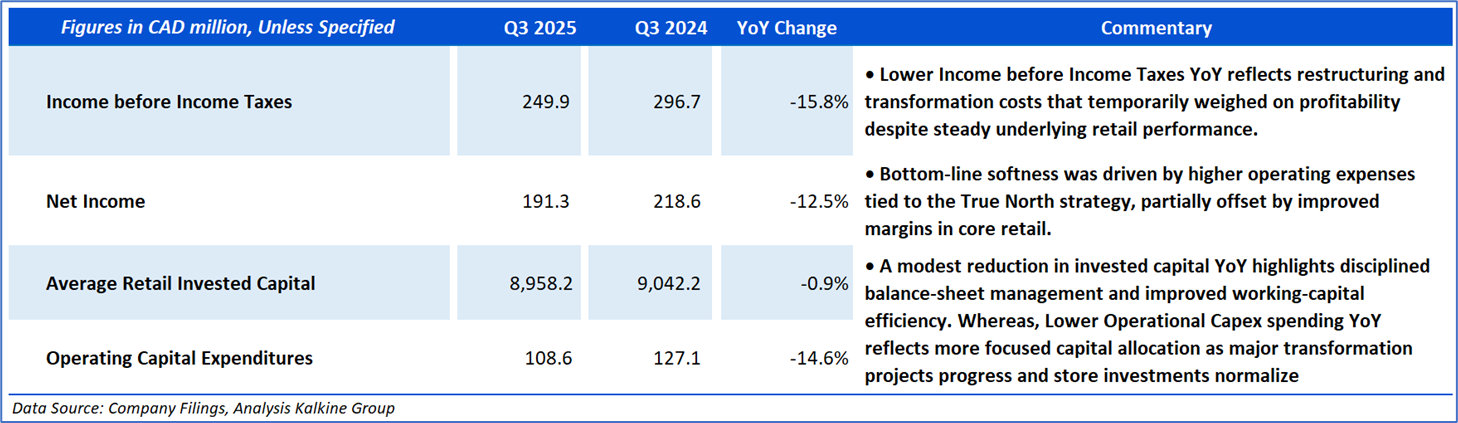
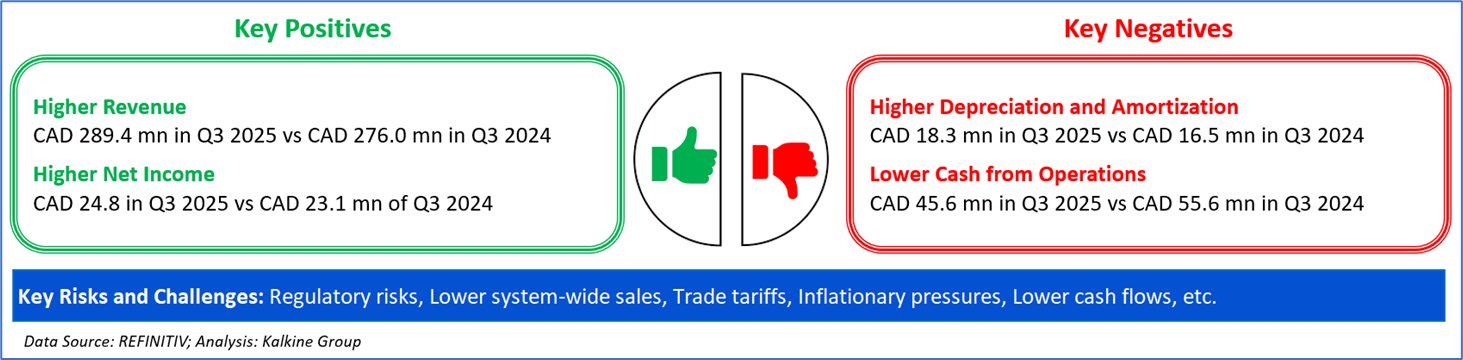
- Canadian Tire Corporation (TSX: CTC.A) reported decent Q3 2025 results, with consolidated revenue up 3.0% to CAD 4.11 bn and normalized EPS rising 6.5% to CAD 3.78, supported by healthier retail margins, expanding loyalty-driven sales, and continued progress under the Company’s True North efficiency and transformation strategy.
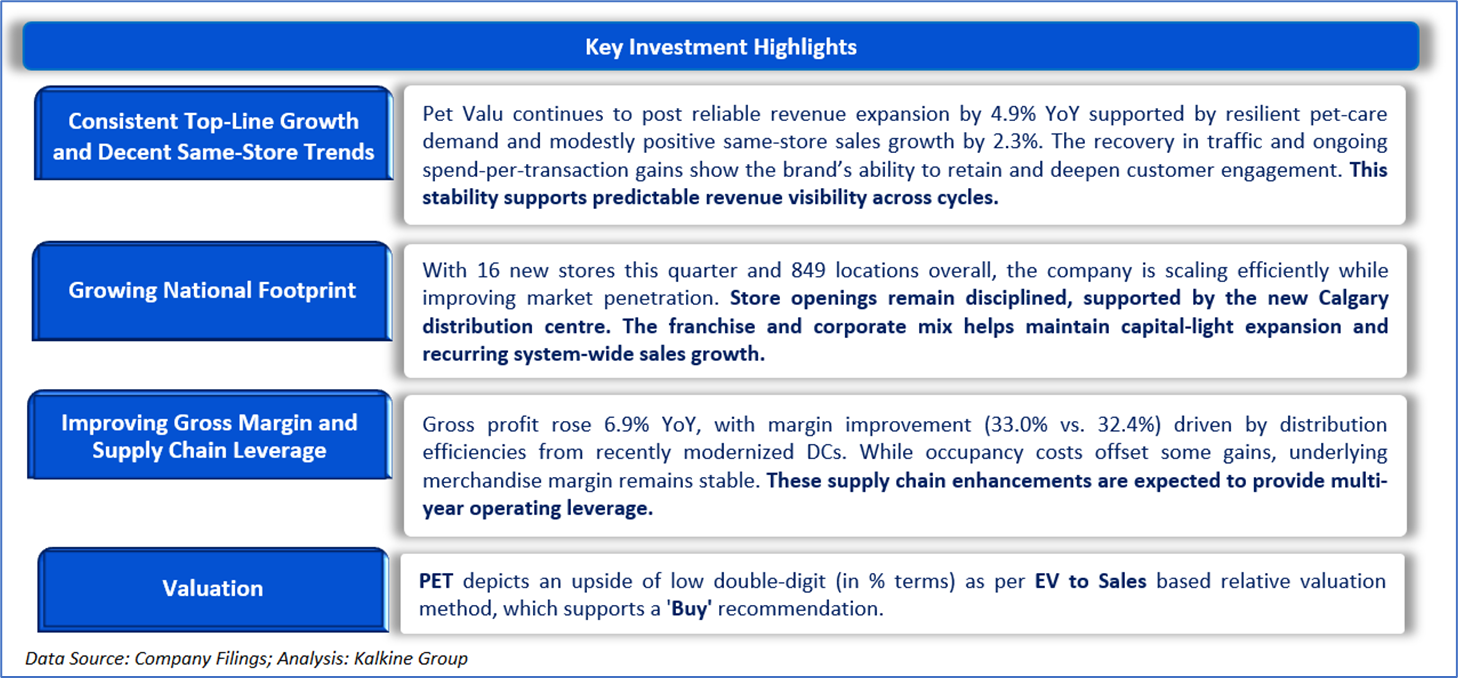
- Pet Valu Holdings Ltd. (TSX: PET) delivered steady Q3 2025 results, posting nearly CAD 290 mn in revenue and 2.3% same-store sales growth, with solid margin resilience and expanding store footprint despite higher operating costs.
Section 2: Company Overview
Canadian Tire Corporation, Limited, (TSX: CTC.A) is a group of companies that includes a Retail segment, a Financial Services division and CT REIT. Our retail business is led by Canadian Tire, which was founded in 1922 and provides Canadians with products for life in Canada across its Living, Playing, Fixing, Automotive and Seasonal & Gardening divisions. Party City, PartSource and Gas+ are key parts of the Canadian Tire network.
Kalkine’s Inflation Report covers the Investment Highlights, Key Financial Metrics, Risks, Technical Analysis along with the Valuation, Target Price, and Recommendation on the stock.

Section3: Financial Highlights

Section 4: Key Metrics
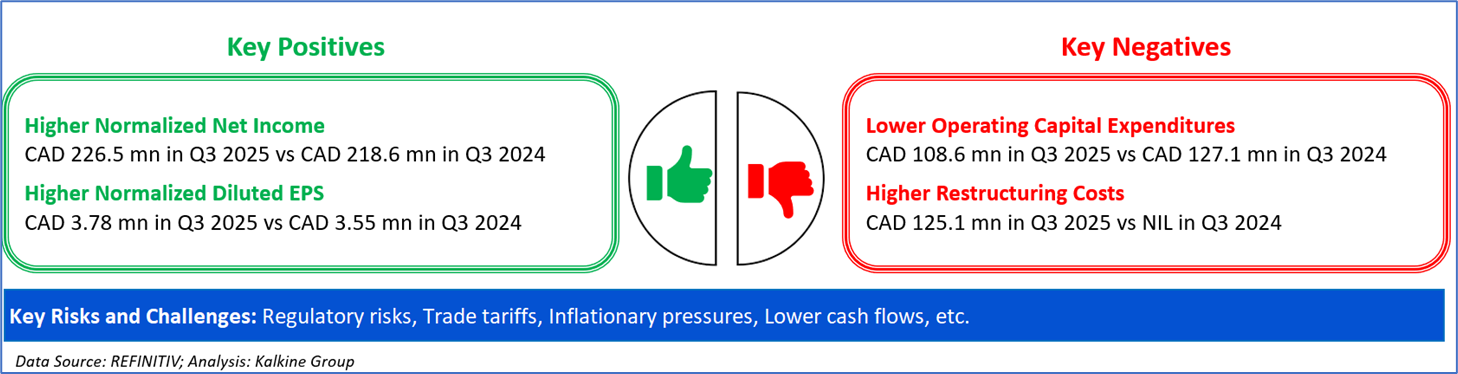
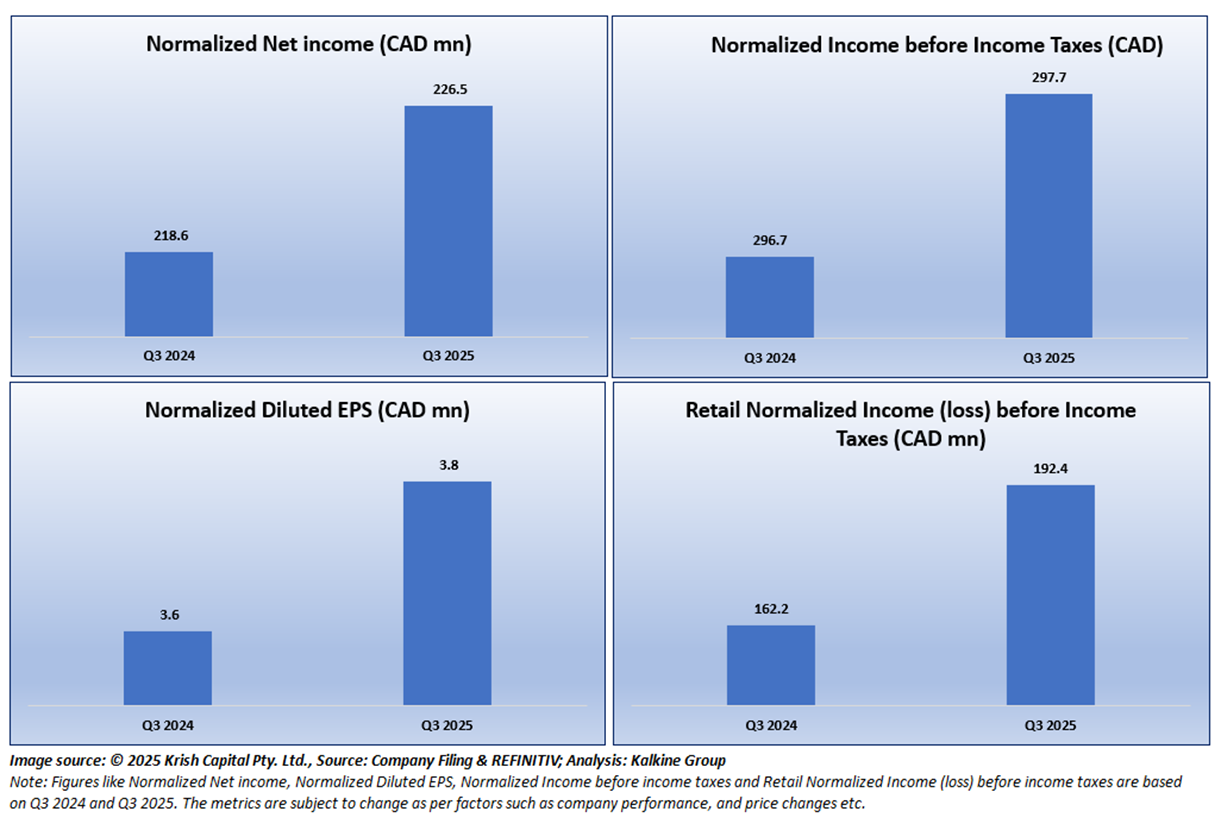
Below chart depicts the change in Normalized Net income, Normalized Diluted EPS, Normalized Income before income taxes and Retail Normalized Income (loss) before income taxes are based on Q3 2024 and Q3 2025.
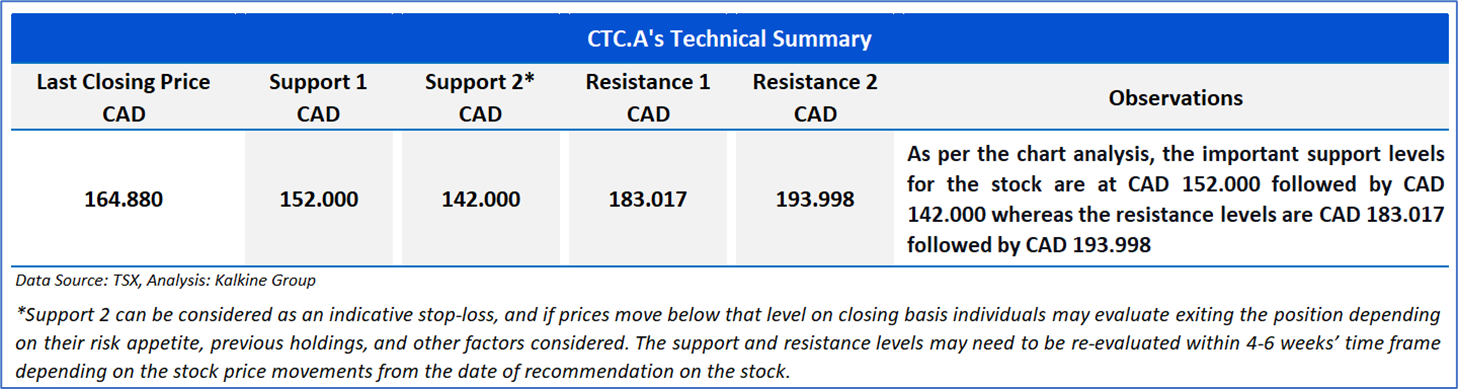
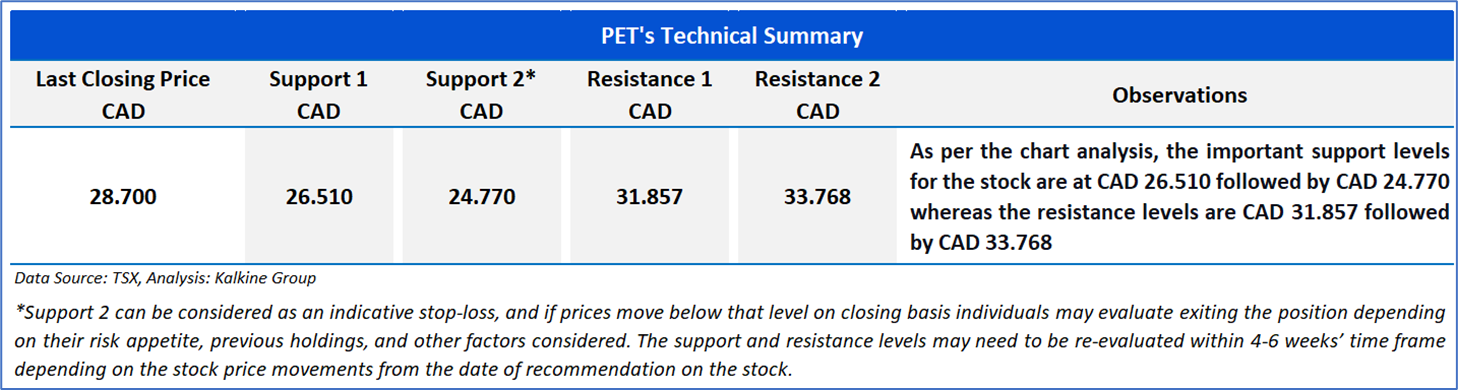
Section 5: Stock Recommendation Summary

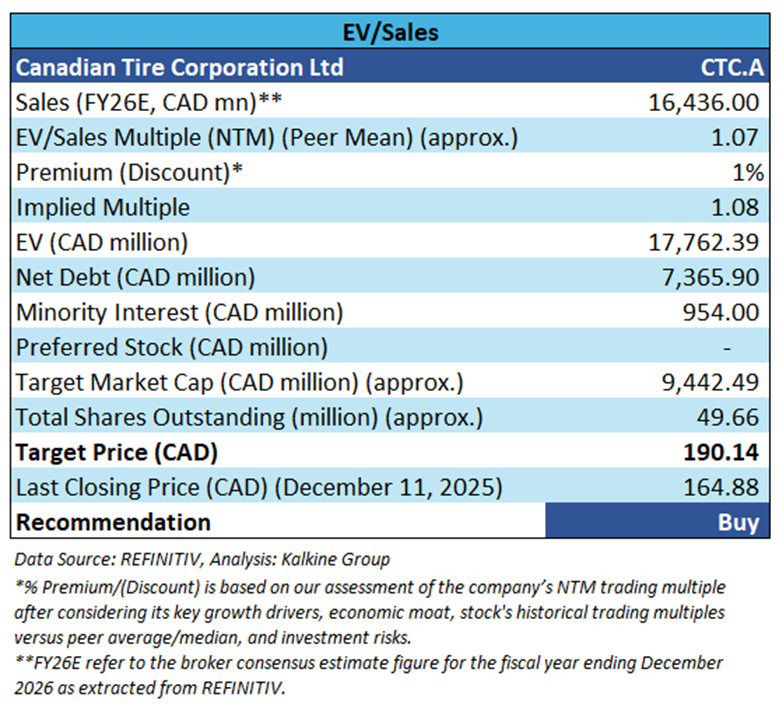
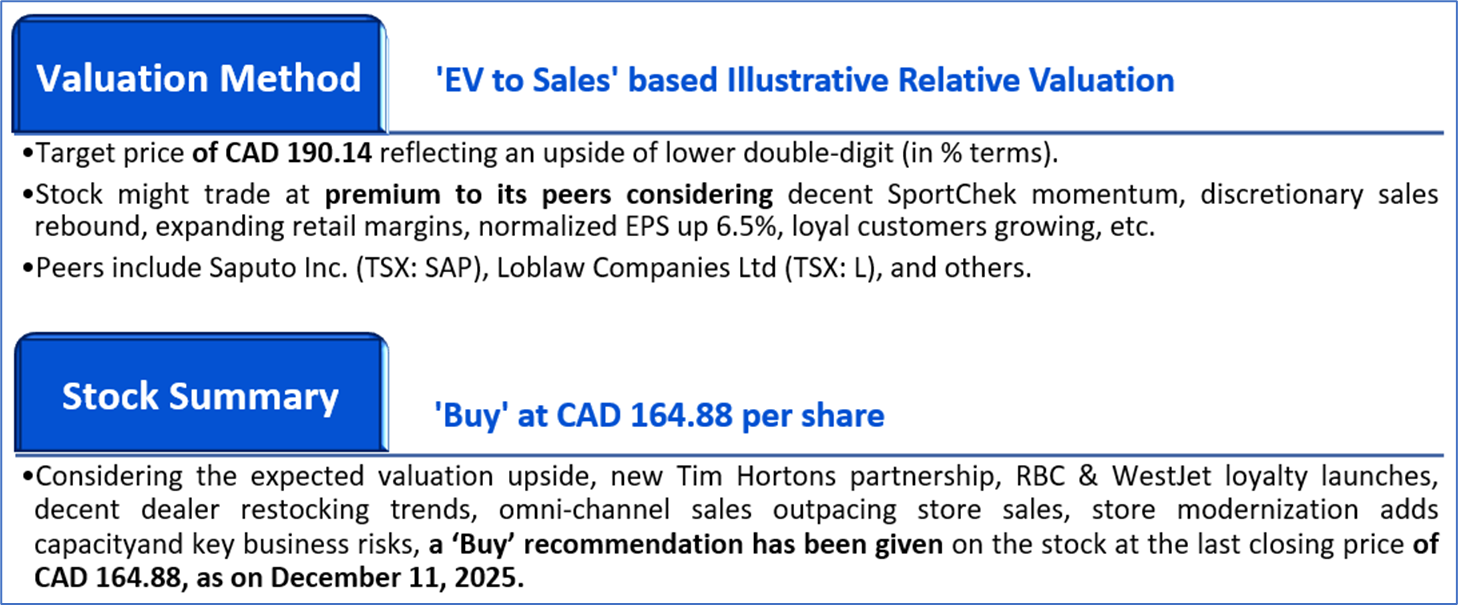
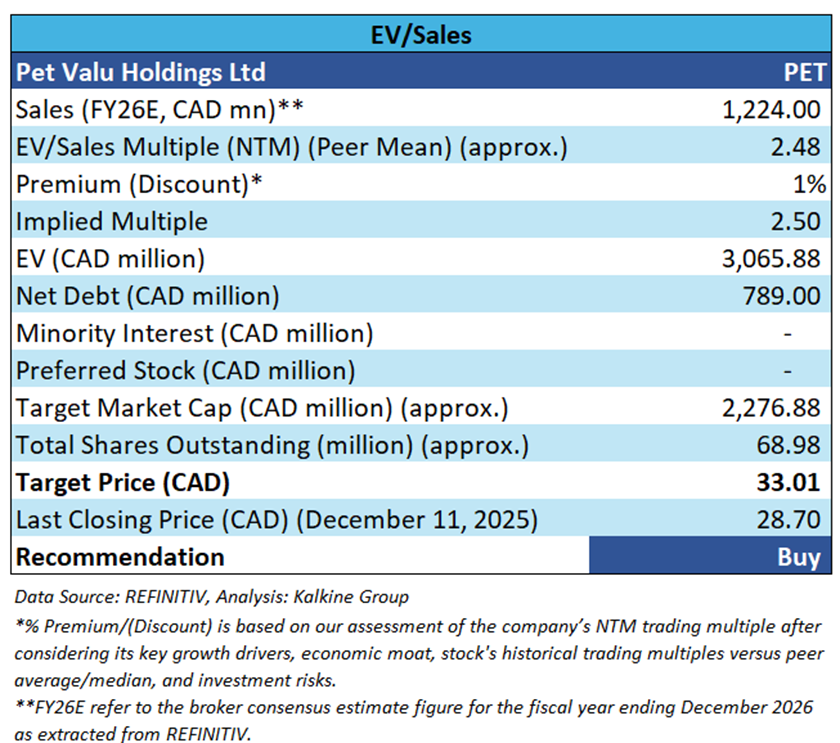
Valuation Methodology: EV to Sales Multiple Based Relative Valuation (Illustrative):


The stock has witnessed a downside of ~3.74% and ~8.37% over the last 1 week and 6 months respectively. Moreover, it is trading below the average 52-week high price of CAD 194.39 and 52-week low price of CAD 139.50, providing an opportunity to accumulate the stock

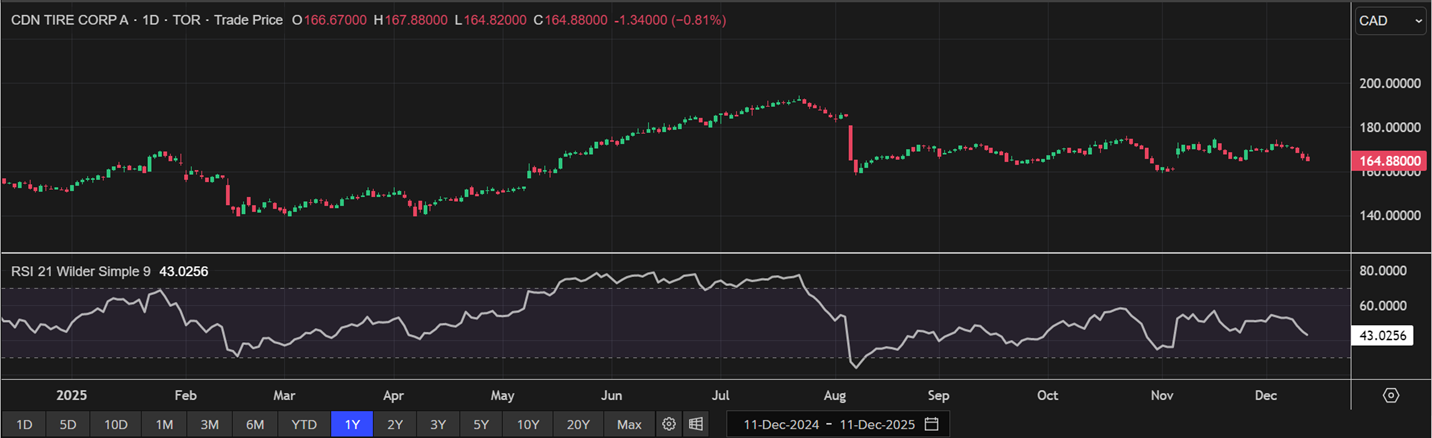
One-Year Technical Price Chart (as of December 11, 2025). Source: REFINITIV, Analysis: Kalkine Group

Section 2: Company Overview
Pet Valu Holdings Ltd (TSX: PET) is engaged in providing pet-related products through its stores. Its products include Dry Food, Wet Food, Frozen raw food, Jerky Treats, and Training treats among others. The services offered by the company include Dog Wash, Adoption, Grooming, and Frozen Raw.
Kalkine’s Inflation Report covers the Investment Highlights, Key Financial Metrics, Risks, Technical Analysis along with the Valuation, Target Price, and Recommendation on the stock.

Section3: Financial Highlights

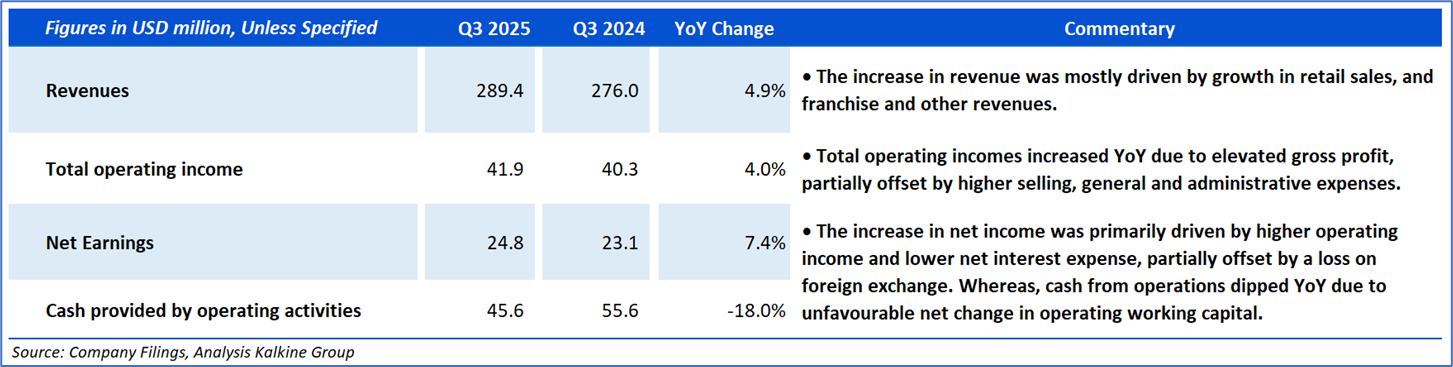
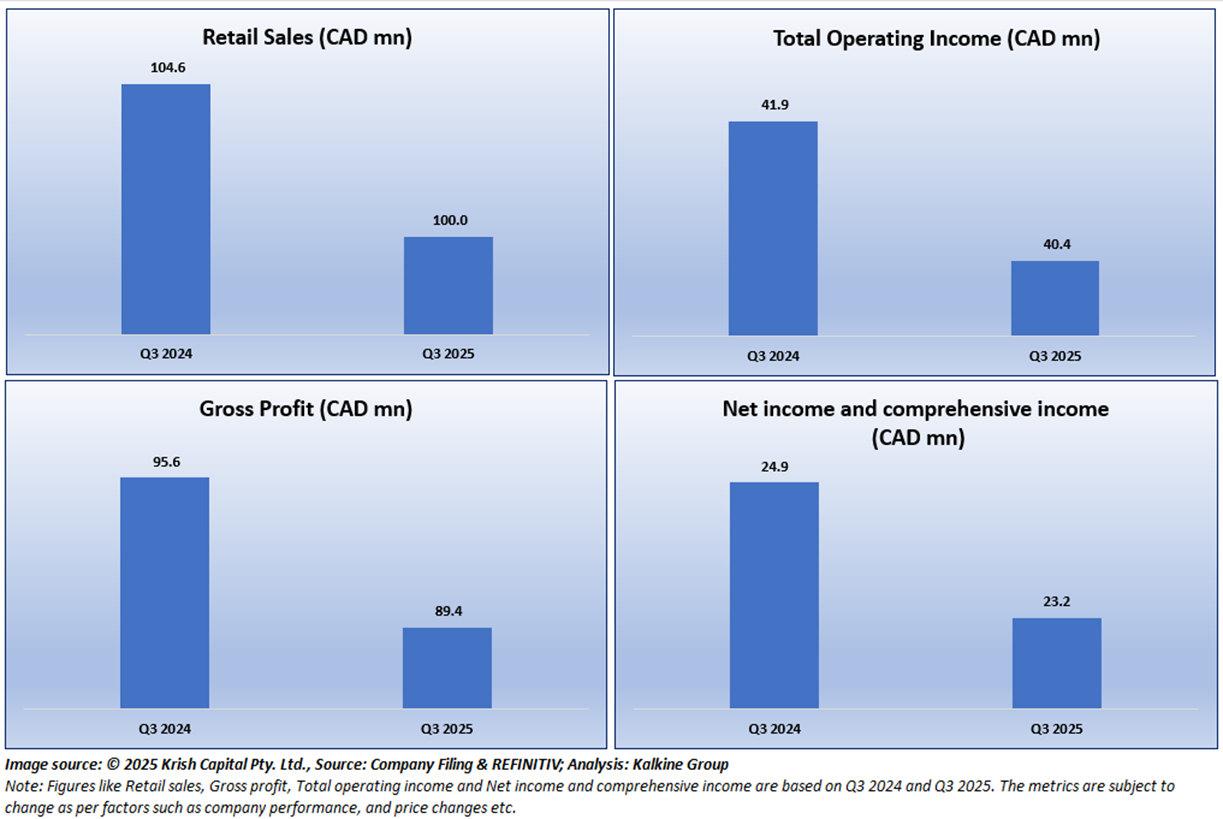
Section 4: Key Metrics
Below chart depicts the changes in Retail sales, Gross profit, Total operating income and Net income and comprehensive income are based on Q3 2024 and Q3 2025.
Section 5: Stock Recommendation Summary

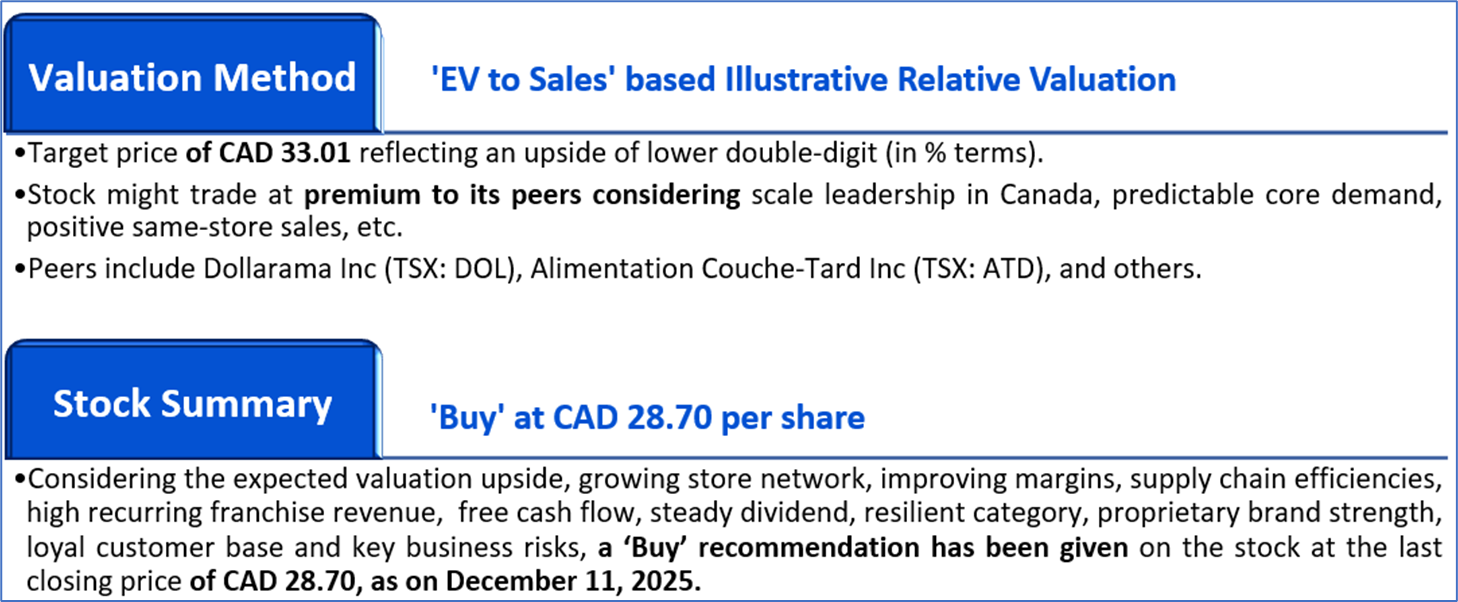
Valuation Methodology: EV to Sales Multiple Based Relative Valuation (Illustrative):


The stock has witnessed an upside of ~0.52% and ~17.71% over the last 1 week and 9 months respectively. Moreover, it is trading below the average 52-week high price of CAD 39.24 and 52-week low price of CAD 22.53, providing an opportunity to accumulate the stock.

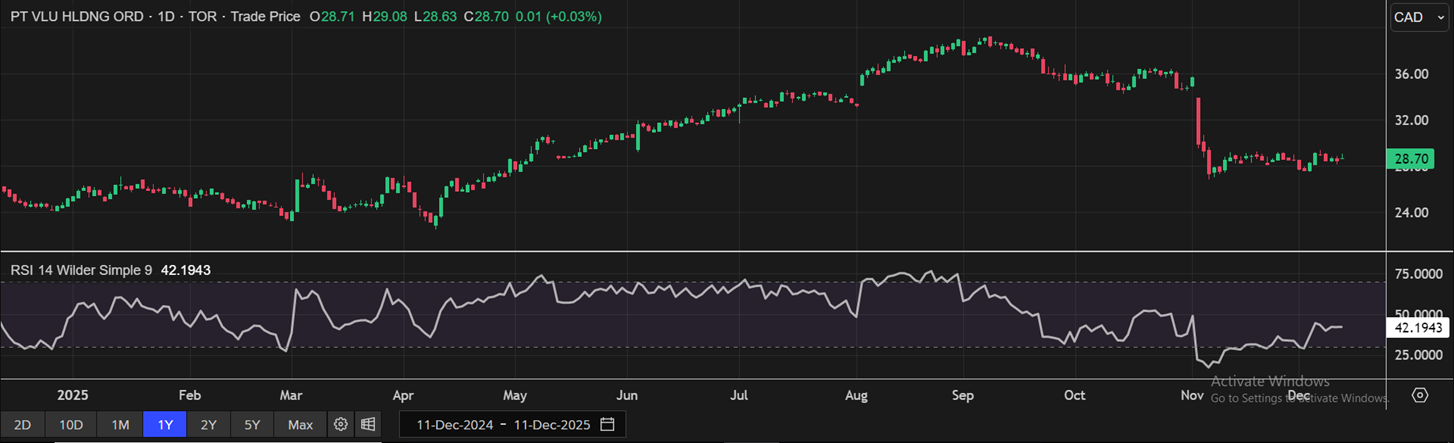
One-Year Technical Price Chart (as of December 11, 2025). Source: REFINITIV, Analysis: Kalkine Group

Note 1: Past performance is not a reliable indicator of future performance.
Note 2: The reference date for all price data, currency, technical indicators, support, and resistance levels is December 11, 2025. The reference data in this report has been partly sourced from REFINITIV.
Note 3: Investment decisions should be made depending on an individual's appetite for upside potential, risks, holding duration, and any previous holdings. An 'Exit' from the stock can be considered if the Target Price mentioned as per the Valuation and or the technical levels provided has been achieved and is subject to the factors discussed above.
Note 4: Dividend Yield may vary as per the stock price movement.
Note 5: Kalkine reports are prepared based on the stock prices captured either from REFINITIV or Trading View. Typically, REFINITIV or Trading View may reflect stock prices with a delay which could be a lag of 25-30 minutes. There can be no assurance that future results or events will be consistent with the information provided in the report. The information is subject to change without any prior notice.
Technical Indicators Defined: -
Support: A level at which the stock prices tend to find support if they are falling, and a downtrend may take a pause backed by demand or buying interest.
Resistance: A level at which the stock prices tend to find resistance when they are rising, and the uptrend may take a pause due to profit booking or selling interest.
Stop-loss: In general, it is a level to protect further losses in case of any unfavourable movement in the stock prices.
Past performance is not a reliable indicator of future performance.

 Please wait processing your request...