Scaling Profitability Amid Advertising Expansion and Strategic Investment: NFLX
Section 1: Company Overview and Fundamentals
1.1 Company Overview:
Netflix, Inc (NASDAQ: NFLX) is a global entertainment streaming company operating in over 190 countries, offering subscription-based access to television series, films, games, and live programming across multiple genres and languages. The company acquires, licenses, and produces original content while delivering streaming services across internet-connected devices. It continues to expand its advertising, gaming, and studio production capabilities, supported by proprietary technology and third-party cloud infrastructure.
Kalkine’s Diversified Opportunities Report covers the Company Overview, Key positives & negatives, Investment summary, Key investment metrics, Top 10 shareholding, Business updates and insights into company recent financial results, Key Risks & Outlook, Price performance and technical summary, Target Price, and Recommendation on the stock.
Stock Performance:
- The stock is in a medium-term downtrend, forming a pattern of lower highs and lower lows after peaking near the USD 130–135 zone.
- Price is trading above the 20-day moving average (around USD 80.01) but below the 50-day moving average (around USD 86.29), indicating continued bearish momentum.
- The 50-day moving average remains above the 20-day moving average, reflecting negative short-term trend alignment.
- A recent bounce toward the 20-day moving average suggests short-term stabilization but not yet a confirmed reversal.
- RSI is near 66, approaching overbought territory within a broader downtrend, implying potential near-term resistance if buying momentum does not strengthen.
- Immediate resistance is seen in the USD 80–86 range, while key support lies near 52-week low USD 75.01.
- A sustained breakout above the 50-day moving average would signal a potential trend reversal.
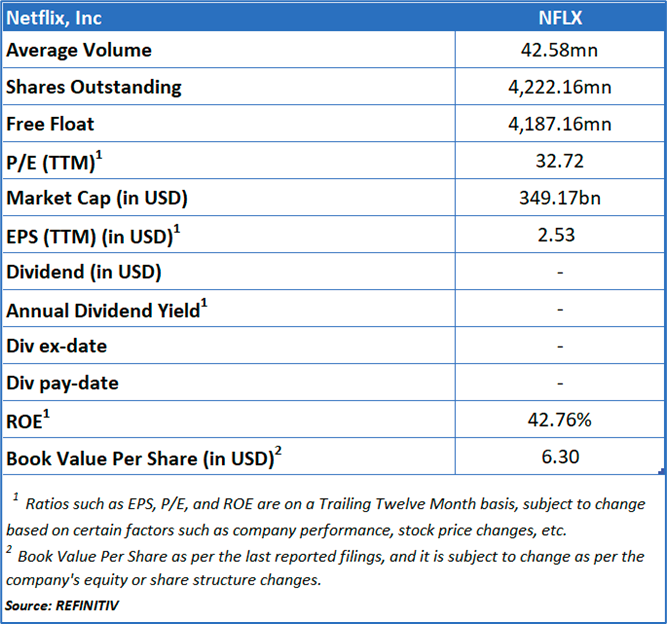
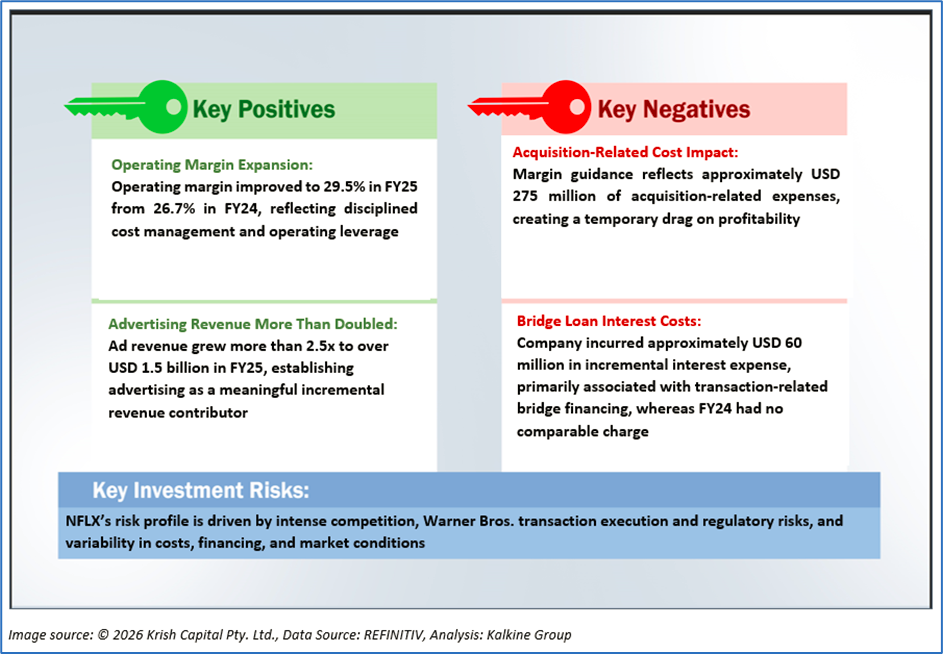
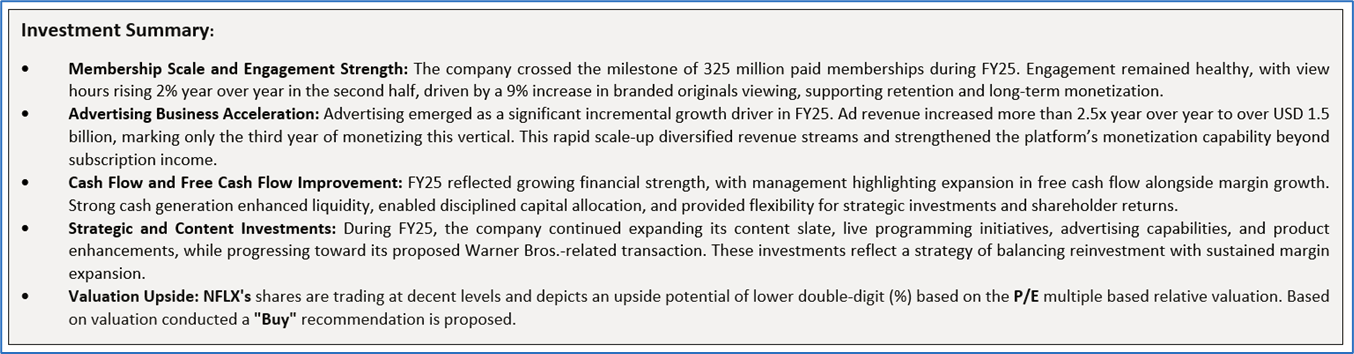
1.2 The Key Positives, Negatives, and Investment summary
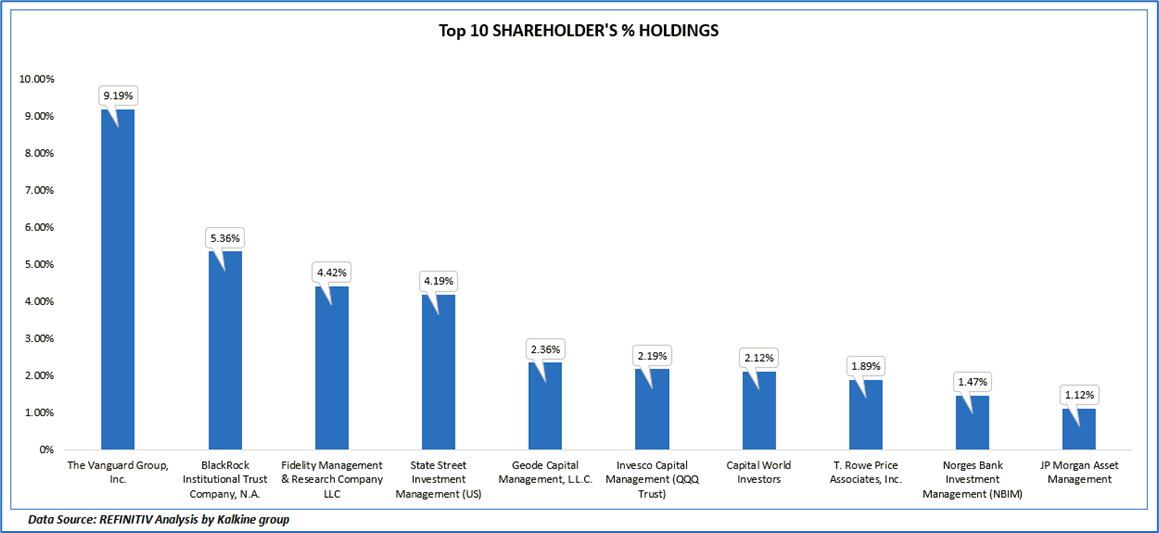
1.3 Top 10 shareholders:
The top 10 shareholders together form ~ 34.30% of the total shareholding, signifying concentrated shareholding. The Vanguard Group, Inc. and BlackRock Institutional Trust Company, N.A. are the biggest shareholders, holding the maximum stake in the company at 9.19% and 5.36%, respectively.
1.4 Key Metrics:
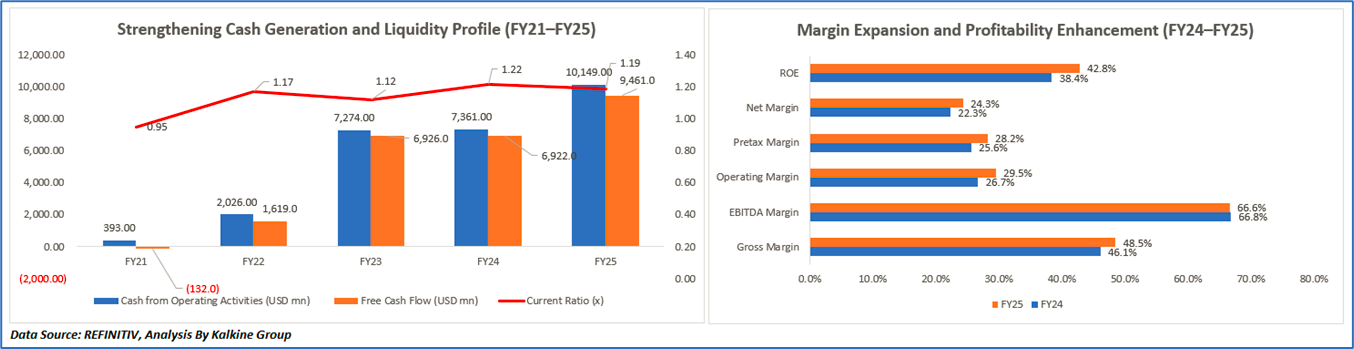
Strengthening Cash Generation and Liquidity Profile (FY21–FY25)
Over FY21–FY25, the company’s cash flow and liquidity profile reflect a structural transition from an investment-intensive phase to a scaled, cash-generative model. In FY21, elevated content spending and production timing pressures constrained free cash flow and kept the current ratio below 1.0x. FY22 marked stabilization, with positive operating cash flow of USD 2.0 billion and free cash flow of USD 1.6 billion, despite foreign exchange and margin headwinds. In FY23, margin recovery and revenue reacceleration lifted free cash flow to USD 6.9 billion, strengthening liquidity. FY24 delivered record operating income above USD 10 billion and a 27% operating margin, further enhancing cash conversion. By FY25, revenue rose 16% to USD 45.2 billion and operating margin expanded to 29.5%, with advertising revenue exceeding USD 1.5 billion, reinforcing robust operating cash flow and sustained improvement in the current ratio.
Margin Expansion and Profitability Enhancement (FY24–FY25)
The improvement across most profitability metrics from FY24 to FY25 reflects stronger revenue growth, operating leverage, and enhanced monetization. Revenue increased by 16% in FY25, supported by membership growth, pricing actions, and rapid expansion of advertising revenue, allowing fixed costs to be absorbed more efficiently and driving operating margin expansion to 29.5%. Gross and EBITDA margins improved as revenue growth outpaced content amortization and operating expenses, while pretax and net margins strengthened despite incremental transaction-related interest costs. The rise in Return on Equity was supported by higher net income and ongoing share repurchases, underscoring a structural shift toward a more scalable, high-margin, and cash-generative business model.
Section 2: Business Updates and Corporate Business Highlights
2.1 Recent Business Updates

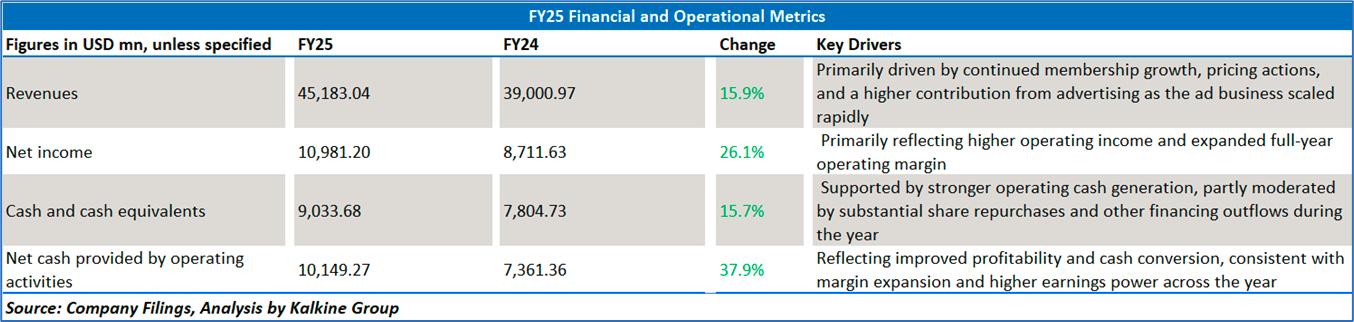
2.2 Insights of FY25:
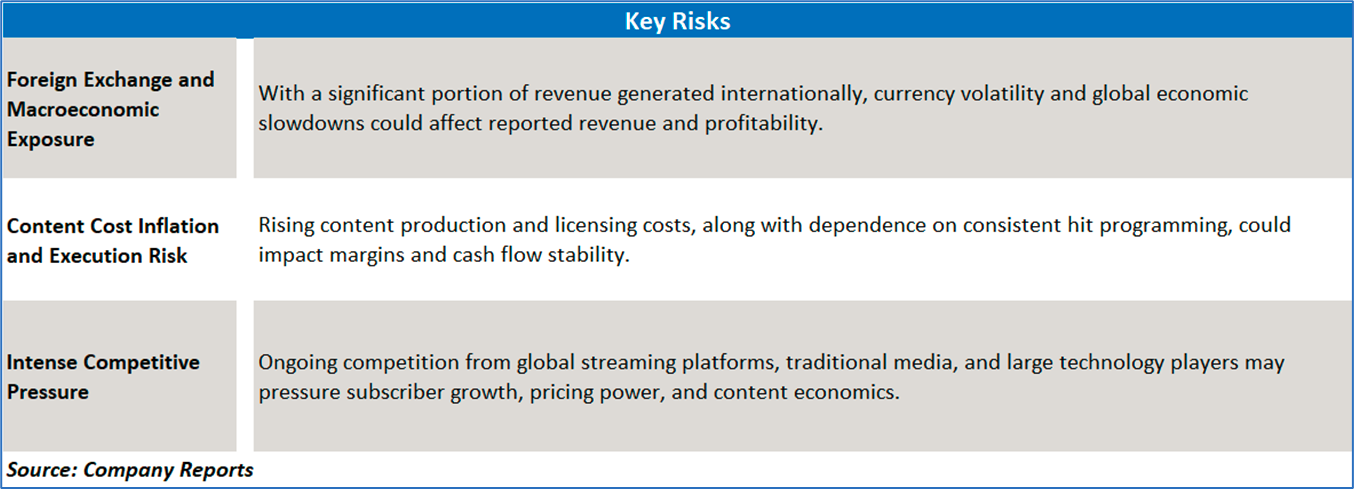
Section 3: Key Risks & Outlook

Section 4: Stock Recommendation Summary:
4.1 Price Performance and Technical Summary:
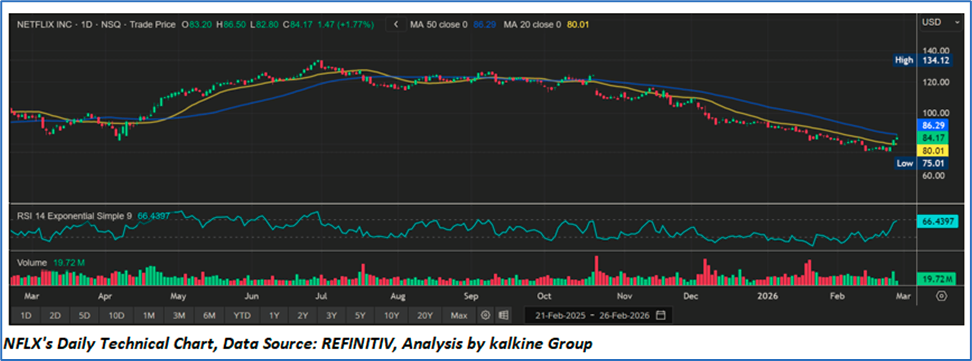
Stock Performance:
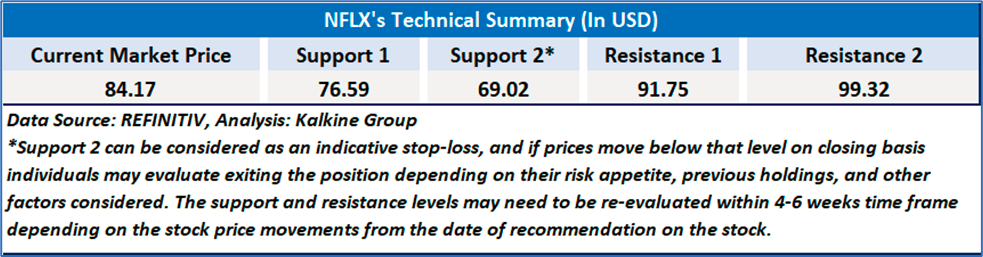
- The stock is in a medium-term downtrend, forming a pattern of lower highs and lower lows after peaking near the USD 130–135 zone.
- Price is trading above the 20-day moving average (around USD 80.01) but below the 50-day moving average (around USD 86.29), indicating continued bearish momentum.
- The 50-day moving average remains above the 20-day moving average, reflecting negative short-term trend alignment.
- A recent bounce toward the 20-day moving average suggests short-term stabilization but not yet a confirmed reversal.
- RSI is near 66, approaching overbought territory within a broader downtrend, implying potential near-term resistance if buying momentum does not strengthen.
- Immediate resistance is seen in the USD 80–86 range, while key support lies near 52-week low USD 75.01.
- A sustained breakout above the 50-day moving average would signal a potential trend reversal.
4.2 Fundamental Valuation
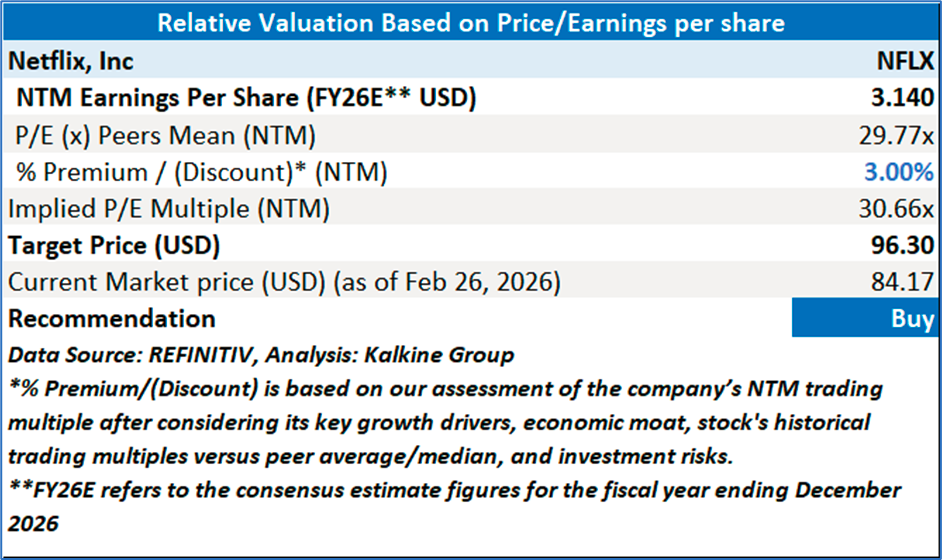
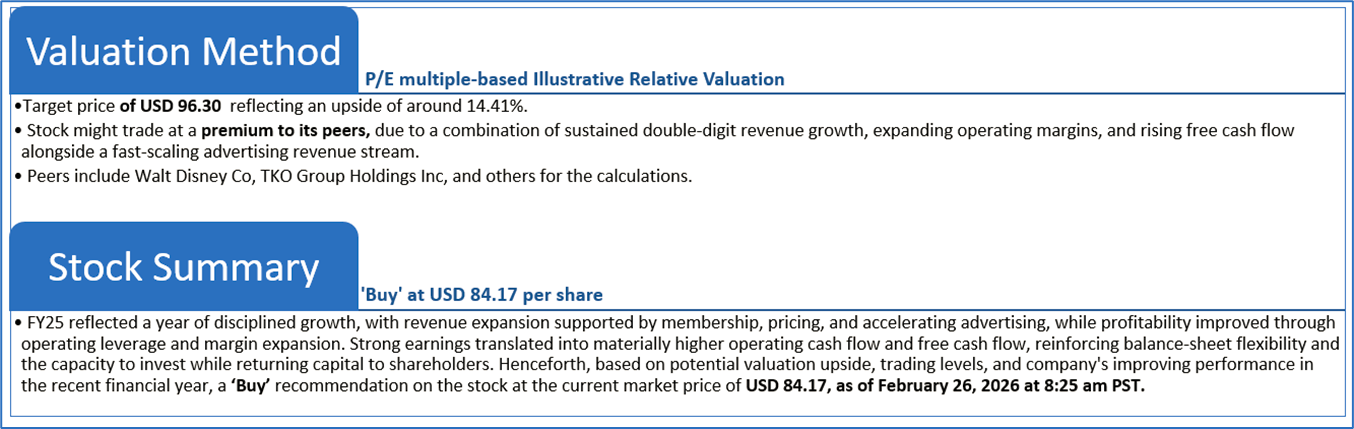
Valuation Methodology: Price/Earnings Multiple Based Relative Valuation
Markets are trading in a highly volatile zone currently due to certain macroeconomic issues and geopolitical tensions prevailing. Therefore, it is prudent to follow a cautious approach while investing.
Note 1: Past performance is not a reliable indicator of future performance.
Note 2: The reference date for all price data, currency, technical indicators, support, and resistance levels is February 26, 2026. The reference data in this report has been partly sourced from REFINITIV.
Note 3: Investment decisions should be made depending on an individual's appetite for upside potential, risks, holding duration, and any previous holdings. An 'Exit' from the stock can be considered if the Target Price mentioned as per the Valuation and or the technical levels provided has been achieved and is subject to the factors discussed above.
Note 4: The report publishing date is as per the Pacific Time Zone.
Technical Indicators Defined: -
Support: A level at which the stock prices tend to find support if they are falling, and a downtrend may take a pause backed by demand or buying interest. Support 1 refers to the nearby support level for the stock and if the price breaches the level, then Support 2 may act as the crucial support level for the stock.
Resistance: A level at which the stock prices tend to find resistance when they are rising, and an uptrend may take a pause due to profit booking or selling interest. Resistance 1 refers to the nearby resistance level for the stock and if the price surpasses the level, then Resistance 2 may act as the crucial resistance level for the stock.
Stop-loss: It is a level to protect against further losses in case of unfavorable movement in the stock prices.
Past performance is not a reliable indicator of future performance.

 NZ
 UK
 US
 AU
 IND

 CA
 Please wait processing your request...