Section1: Company Overview and Fundamental Insights:

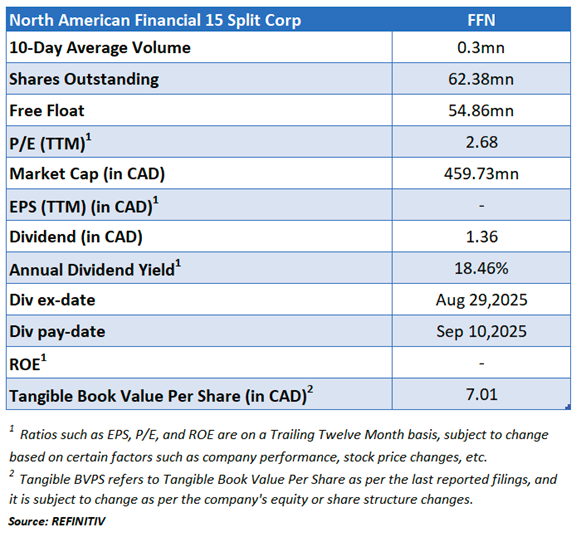
North American Financial 15 Split Corp. (TSX: FFN) is a mutual fund corporation, which invests in a portfolio of over 15 financial services companies. It offers two types of shares, such as Preferred Shares and Class A Shares. Its investment objectives with respect to preferred shares are to provide holders of preferred shares with cumulative preferential monthly cash dividends, the amount of which is fixed on an annual basis and to pay the holders of the preferred shares a certain price per preferred share on or about the termination date.
Kalkine’s Dividend Income Report covers the Investment Highlights, Key Financial Metrics, Risks, Technical Analysis along with the Valuation, Target Price, and Recommendation on the stock.

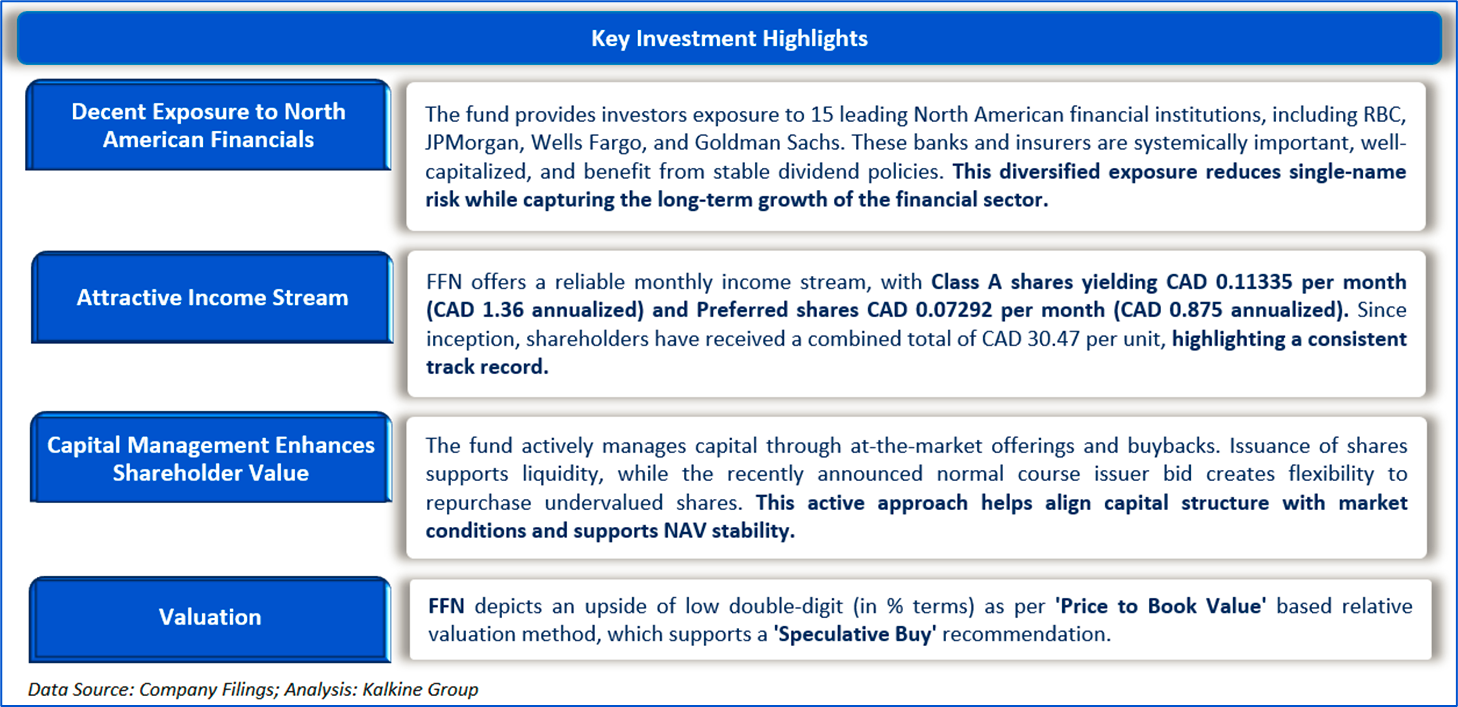

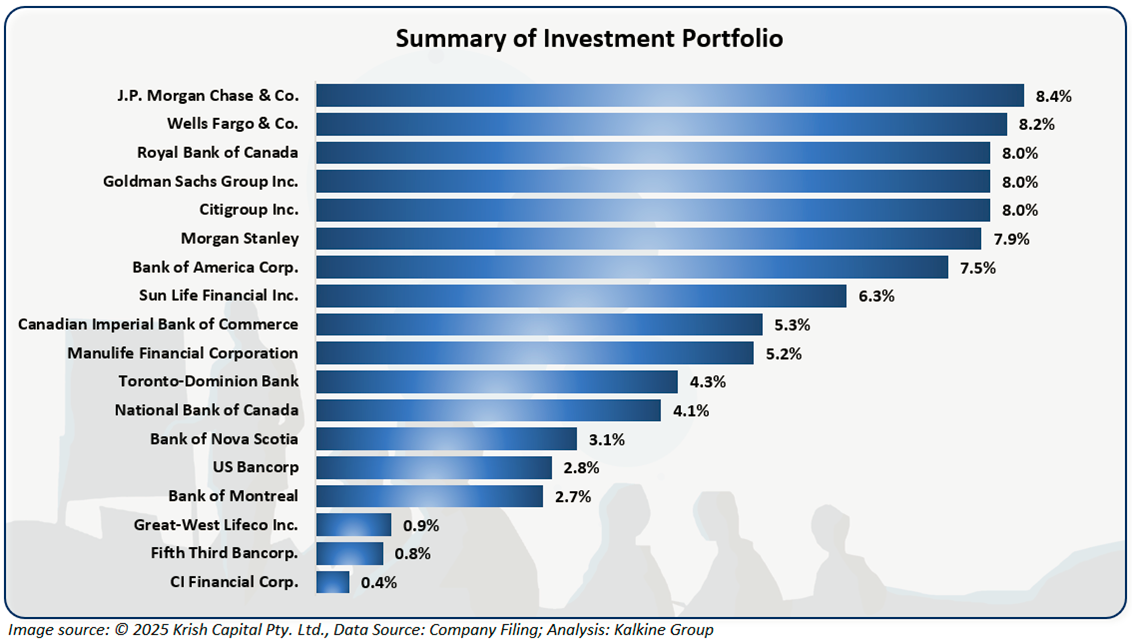
FFN holds a focused portfolio of leading Canadian and US financial services companies, including the Big Six Canadian banks, Major Insurers like Manulife Financial Corporation, Sun Life Financial Inc., and Great-West Lifeco Inc., along with US heavyweights such as J.P. Morgan Chase & Co., Goldman Sachs Group Inc., Bank of America, Citigroup Inc., and Wells Fargo & Co.
This portfolio mix provides decent exposure to systemically important institutions known for stable dividends and healthy balance sheets. The fund may also allocate up to 15% of its assets outside this core group to enhance flexibility. To boost income and manage risk, it actively employs a covered call strategy on some holdings, supporting consistent cash flow while tempering volatility.

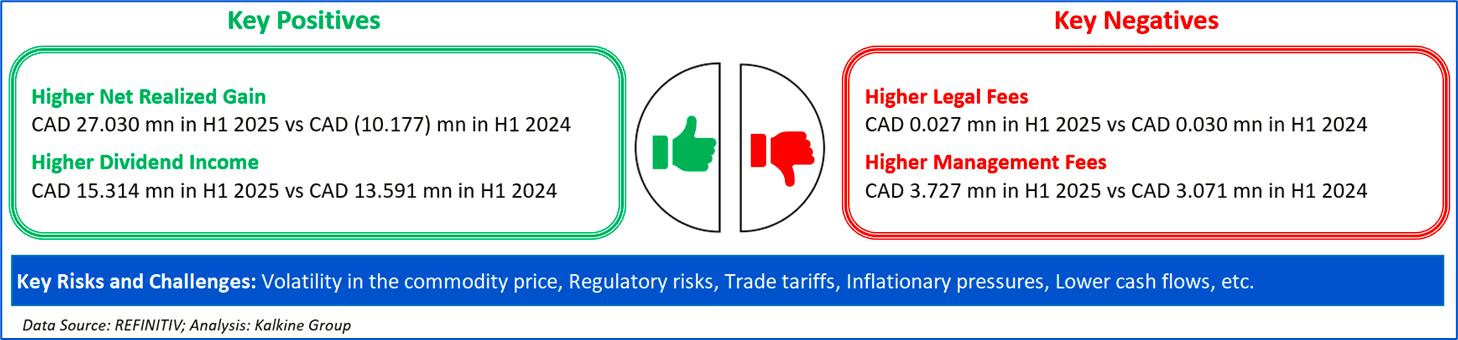
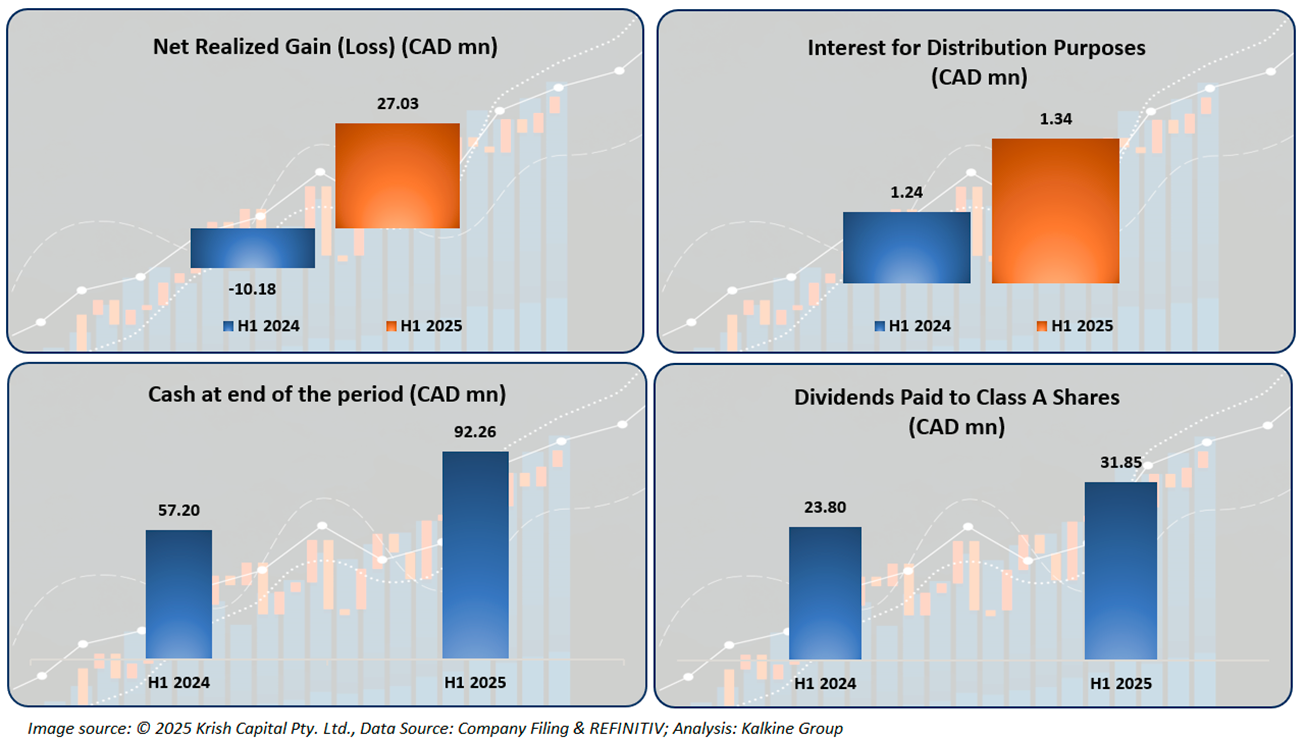
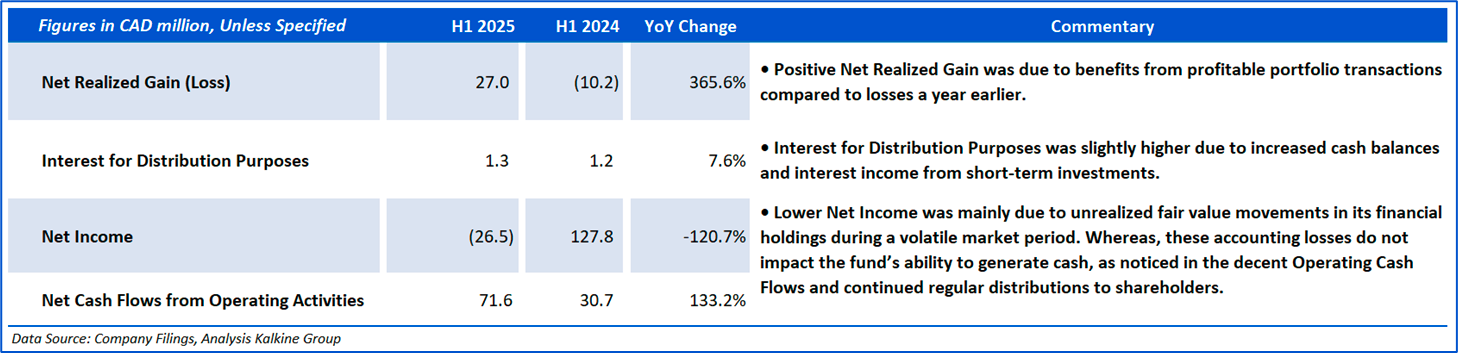
The company reported rising financials in H1 2025, where it clocked healthy growth under its Net Realized Gain (Loss) and Interest for Distribution Purposes, which is a key positive. Furthermore, it witnessed elevated Dividends Paid to Class A Shares and Cash at end of the period, displaying its healthy liquidity position and commitment to distributions.
Section 2: Business Update and Financial Highlights

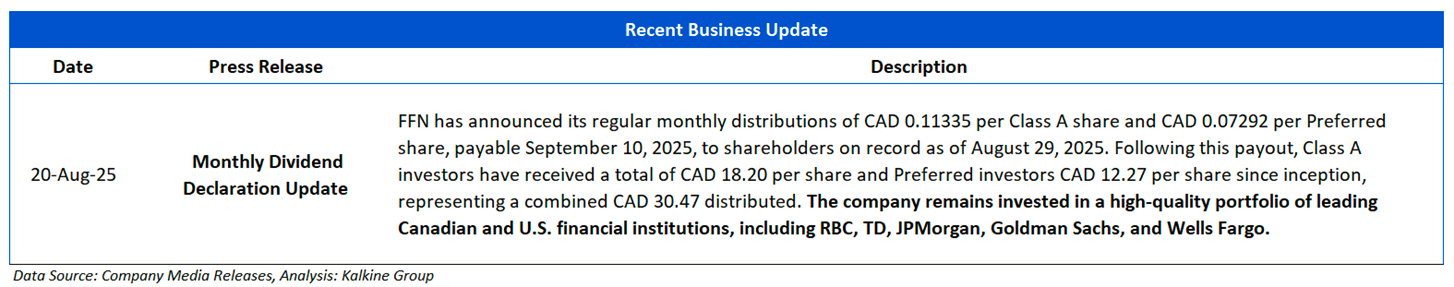
The picture below gives an overview of the company’s recent activities, such as an announcement regarding update on Monthly Dividend Declaration Update.

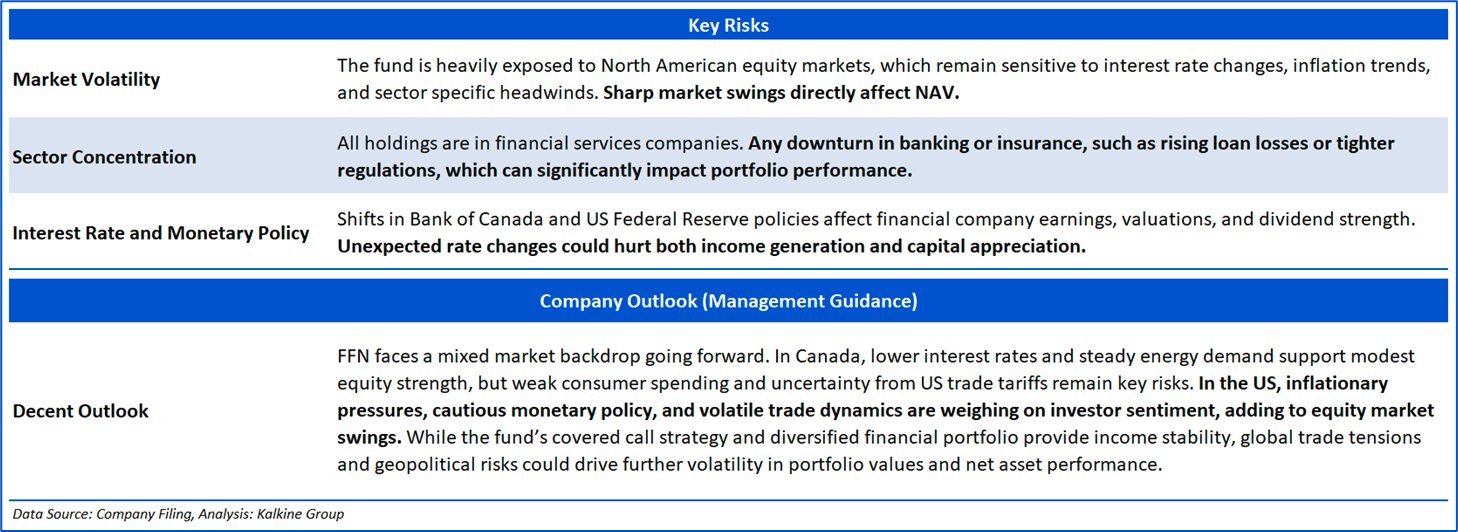
Section 3: Key Risks and Company Outlook
Section 4: Stock Recommendation Summary


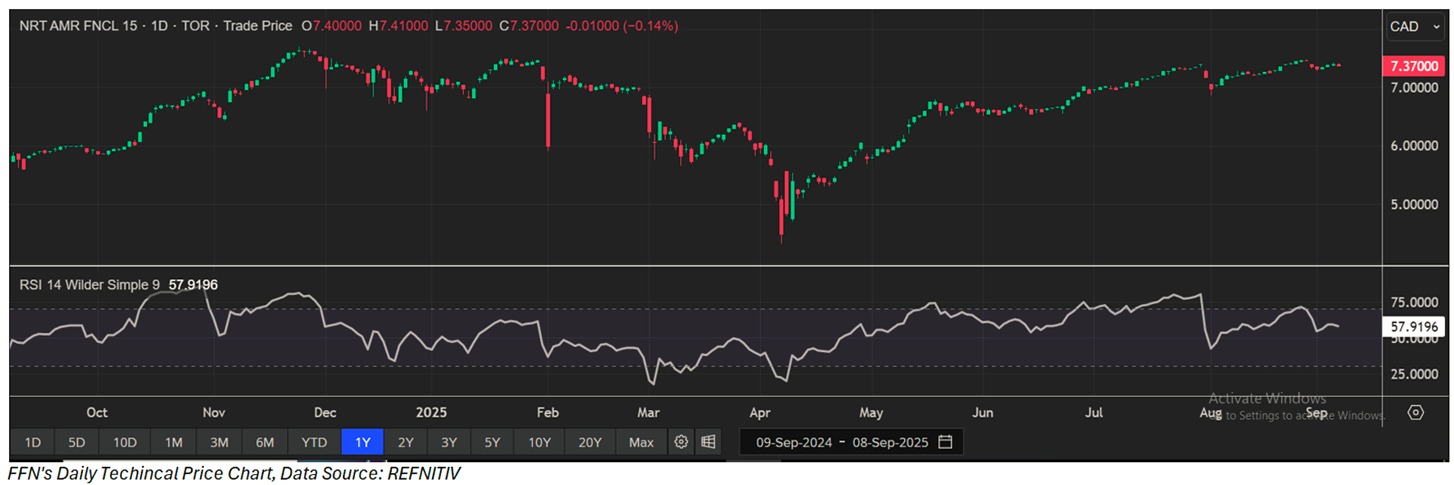
The stock has witnessed an upside of ~2.50% and ~10.82% over the last 1 month and 3 months respectively. Moreover, it is trading above the average 52-week high price of CAD 7.70 and 52-week low price of CAD 4.33, providing an opportunity to ride the trend.

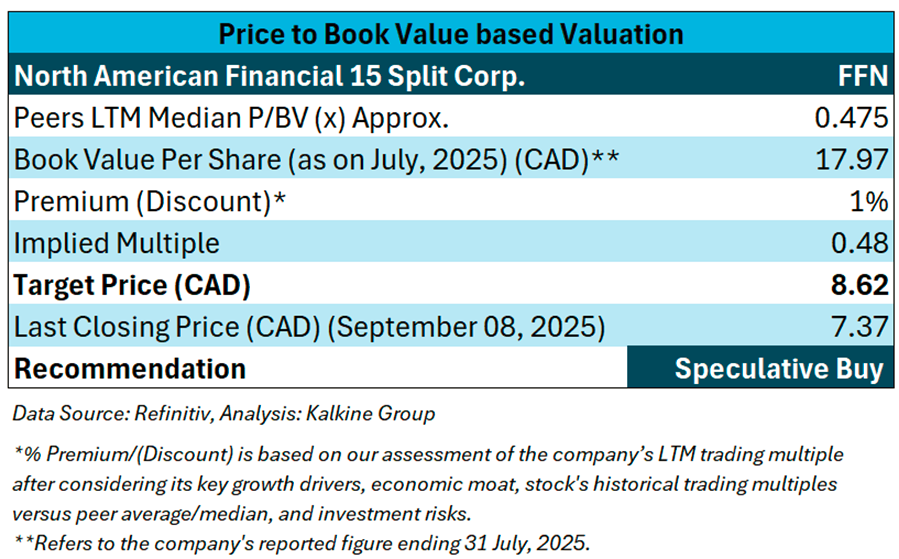
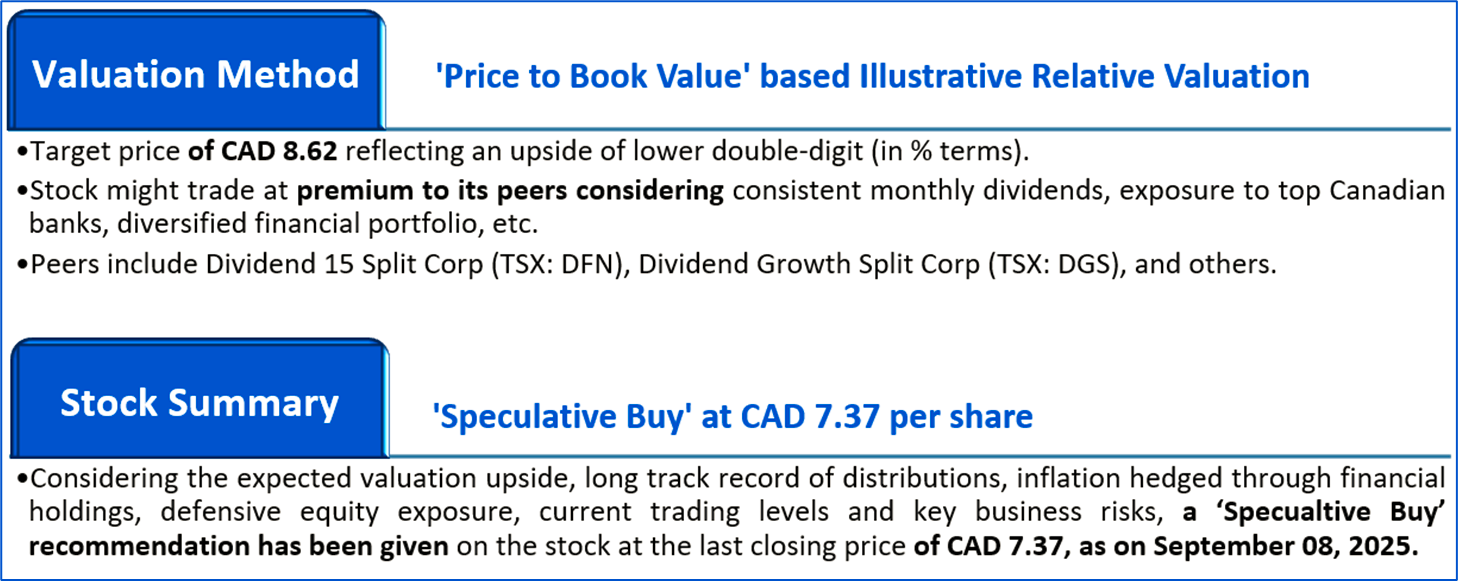
Valuation Methodology Price to Book Value Multiple Based Relative Valuation (Illustrative):
Markets are trading in a highly volatile zone currently due to certain macroeconomic issues and geopolitical tensions prevailing. Therefore, it is prudent to follow a cautious approach while investing.
Note 1: Past performance is not a reliable indicator of future performance.
Note 2: The reference date for all price data, currency, technical indicators, support, and resistance levels is September 08, 2025. The reference data in this report has been partly sourced from REFINITIV.
Note 3: Investment decisions should be made depending on an individual's appetite for upside potential, risks, holding duration, and any previous holdings. An 'Exit' from the stock can be considered if the Target Price mentioned as per the Valuation and or the technical levels provided has been achieved and is subject to the factors discussed above.
Note 4: Dividend Yield may vary as per the stock price movement.
Note 5: Kalkine reports are prepared based on the stock prices captured either from REFINITIV or Trading View. Typically, REFINITIV or Trading View may reflect stock prices with a delay which could be a lag of 25-30 minutes. There can be no assurance that future results or events will be consistent with the information provided in the report. The information is subject to change without any prior notice.
Technical Indicators Defined: -
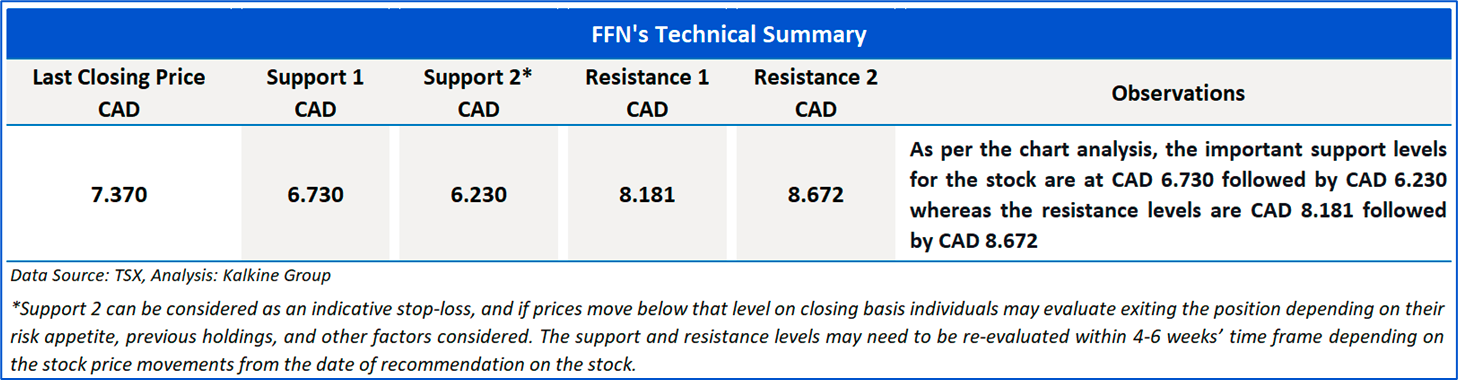
Support: A level at which the stock prices tend to find support if they are falling, and a downtrend may take a pause backed by demand or buying interest. Support 1 refers to the nearby support level for the stock and if the price breaches the level, then Support 2 may act as the crucial support level for the stock.
Resistance: A level at which the stock prices tend to find resistance when they are rising, and an uptrend may take a pause due to profit booking or selling interest. Resistance 1 refers to the nearby resistance level for the stock and if the price surpasses the level, then Resistance 2 may act as the crucial resistance level for the stock.
Stop-loss: It is a level to protect further losses in case of unfavourable movement in the stock prices.
Past performance is not a reliable indicator of future performance.

 Please wait processing your request...