Section1: Commodity Update:
WTI crude oil futures continued to climb toward the $60 per barrel mark on 1st May 2025, driven by growing optimism over a potential trade conflict in US-China relations—the world’s two largest oil consumers. Hopes for renewed trade talks were sparked by China’s openness to negotiations following repeated US outreach, along with President Trump’s remarks hinting at possible agreements with Beijing. Market sentiment was also boosted by Trump’s warning of secondary sanctions against nations buying Iranian oil. However, despite these gains, crude remains on track to post a weekly decline of about 5%, pressured by ongoing trade uncertainties, signs of weakening demand after a contraction in US GDP, and China’s steepest factory slowdown in more than two years. Additional downward pressure came from expectations of rising OPEC+ supply, with Saudi Arabia indicating a willingness to accept lower prices and potentially support increased output at the group’s upcoming May meeting.
Data Source: Trading Economics
Section2: Company Overview and Fundamental Insights:
2.1 Company Overview:
NuVista Energy Ltd. (TSX: NVA) is engaged in the exploration, development, and production of oil and natural gas in the Western Canadian Sedimentary Basin. Products sold include natural gas, condensate & oil, butane, propane, and ethane, with condensate composing nearly half of all sales. Condensate finds significant use in the heavy oil business when applied to heavy oil bitumen. It creates the viscosity needed for pipeline transportation. The Wapiti Montney area delivers the largest portion of hydrocarbon production for NuVista. To better service assets and production in this area, the firm operates compressor and dehydration stations.
Kalkine’s Resource Report covers the Investment Highlights, Key Financial Metrics, Risks, Technical Analysis along with the Valuation, Target Price, and Recommendation on the stock.
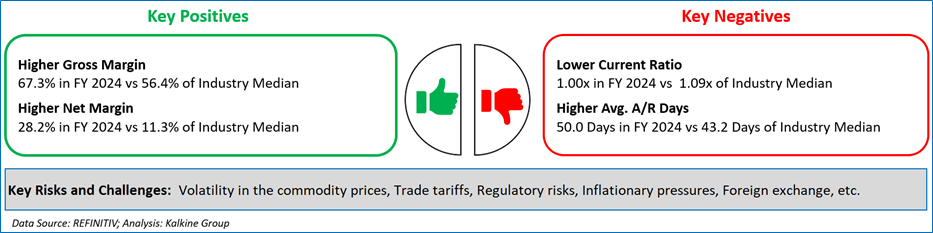
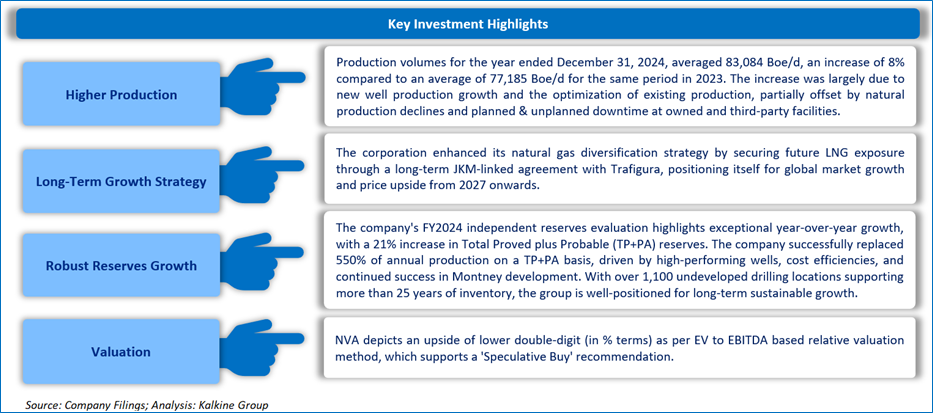
2.2 The Key Positives, Negatives, Investment Highlights and Risks
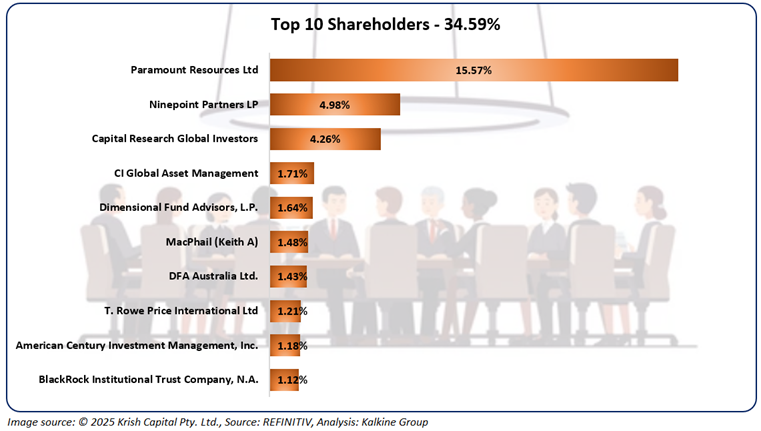
2.3 Top 10 Shareholders:
The top 10 shareholders together form ~34.59% of the total shareholding. Paramount Resources Ltd and Ninepoint Partners LP hold a maximum stake in the company at ~15.57% and ~4.98%, respectively.
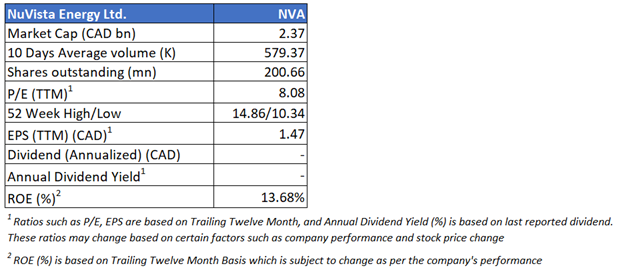
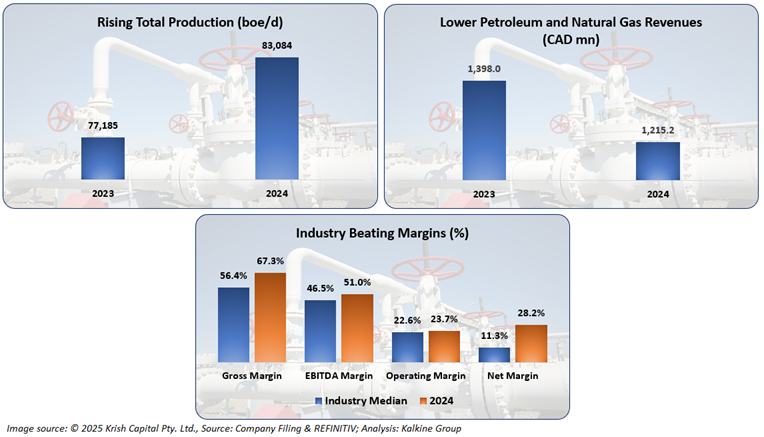
2.4 Key Metrics:
The company reported higher total production in FY 2024 against FY 2023, which is a significant plus. However, it reported lower total realized pricing which led to a drop in its petroleum and Natural Gas revenue. Additionally, it recorded an industry-leading margins profile, demonstrating its depth and flexibility.
Section 3: Business Updates and Financial Highlights
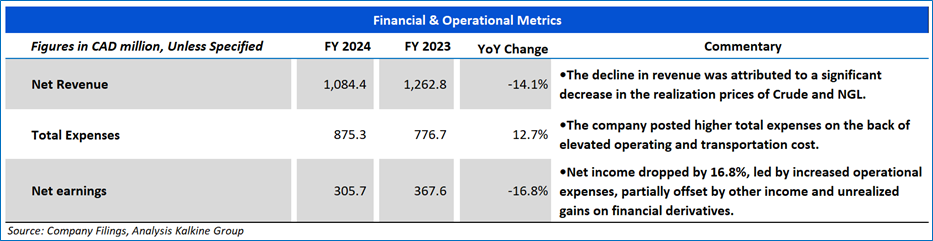
3.1 Recent Updates: The below picture gives an overview of the company’s recent activities, such as an announcement regarding encouraging results from Well Pads.
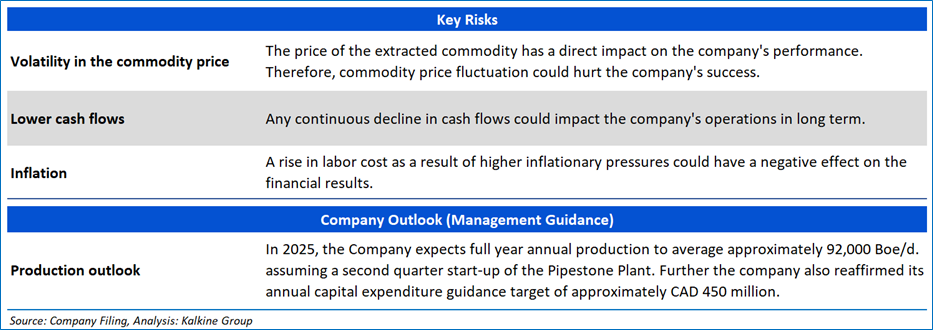
3.2 Insights on FY 2024 Financial Performance:
Section 4: Key Risks and Company Outlook
Section 5: Stock Recommendation Summary:
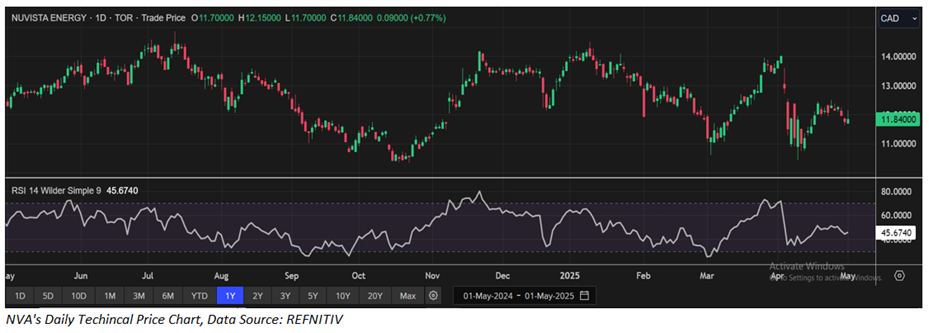
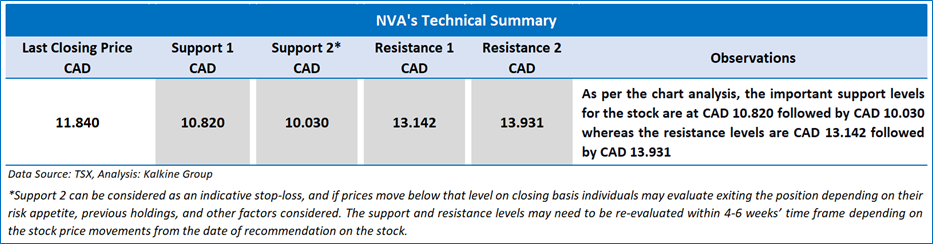
5.1 Price Performance and Technical Summary:

The stock has witnessed a downside of ~3.81% and ~14.51% over the last 1 week and 1 month respectively. Moreover, the stock is trading below the average 52-week high price of CAD 14.86 and 52-week low price of CAD 10.34, providing an opportunity to accumulate the stock.
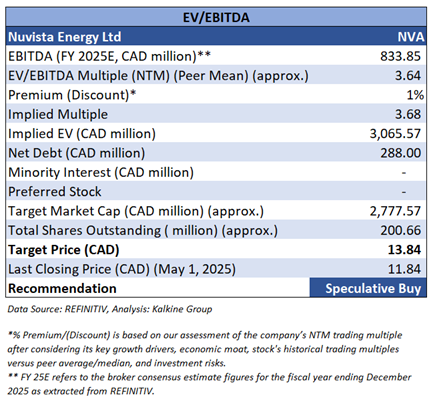
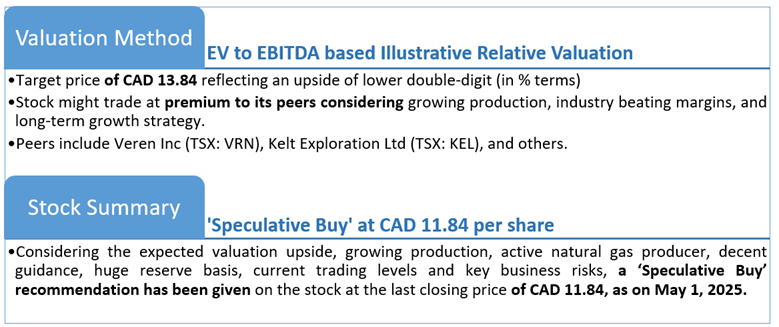
5.2 Fundamental Valuation
Valuation Methodology: EV to EBITDA Based Relative Valuation (Illustrative)
Markets are trading in a highly volatile zone currently due to certain macroeconomic issues and geopolitical tensions prevailing. Therefore, it is prudent to follow a cautious approach while investing.
Note 1: Past performance is not a reliable indicator of future performance.
Note 2: The reference date for all price data, currency, technical indicators, support, and resistance levels is May 1, 2025. The reference data in this report has been partly sourced from REFINITIV.
Note 3: Investment decisions should be made depending on an individual's appetite for upside potential, risks, holding duration, and any previous holdings. An 'Exit' from the stock can be considered if the Target Price mentioned as per the Valuation and or the technical levels provided has been achieved and is subject to the factors discussed above.
Note 4: Dividend Yield may vary as per the stock price movement.
Note 5: Kalkine reports are prepared based on the stock prices captured either from REFINITIV or Trading View. Typically, REFINITIV or Trading View may reflect stock prices with a delay which could be a lag of 25-30 minutes. There can be no assurance that future results or events will be consistent with the information provided in the report. The information is subject to change without any prior notice.
Technical Indicators Defined: -
Support: A level at which the stock prices tend to find support if they are falling, and a downtrend may take a pause backed by demand or buying interest. Support 1 refers to the nearby support level for the stock and if the price breaches the level, then Support 2 may act as the crucial support level for the stock.
Resistance: A level at which the stock prices tend to find resistance when they are rising, and an uptrend may take a pause due to profit booking or selling interest. Resistance 1 refers to the nearby resistance level for the stock and if the price surpasses the level, then Resistance 2 may act as the crucial resistance level for the stock.
Stop-loss: It is a level to protect further losses in case of unfavourable movement in the stock prices.
Past performance is not a reliable indicator of future performance.

 Please wait processing your request...