Section 1: Company Overview and Fundamentals
Company Overview:
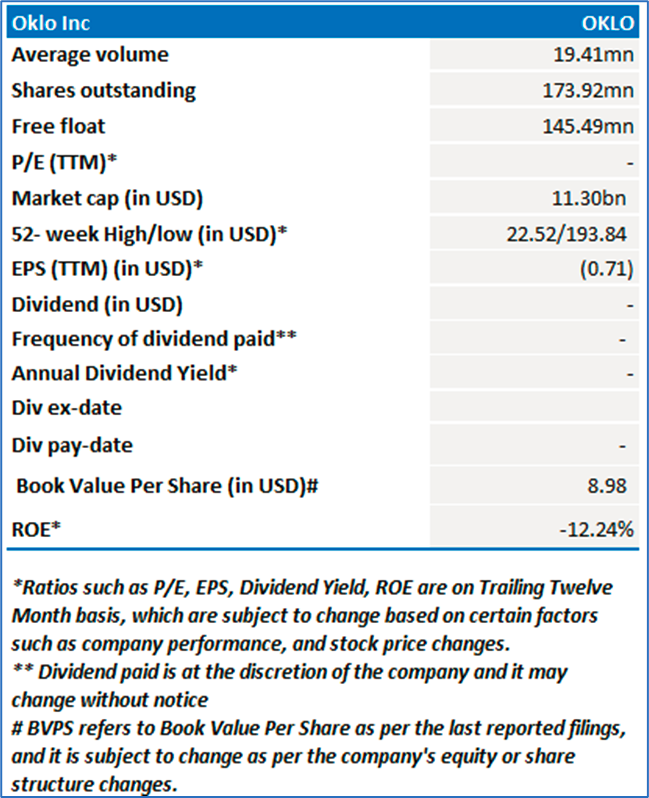
Oklo Inc. (NYSE: OKLO) is an advanced nuclear technology company. The Company is engaged in developing fast fission power plants to provide clean, reliable, and affordable energy on scale. It is developing advanced fuel recycling technologies in collaboration with the United States Department of Energy and United States National Laboratories. It provides 24/7 clean energy to data centers, factories, industrial sites, communities, and defense facilities.
Kalkine’s Diversified Opportunities Report covers the Company Overview, Key positives & negatives, Investment summary, Key investment metrics, Top 10 shareholding, Business updates and insights into company recent financial results, Key Risks & Outlook, Price performance and technical summary, Target Price, and Recommendation on the stock.
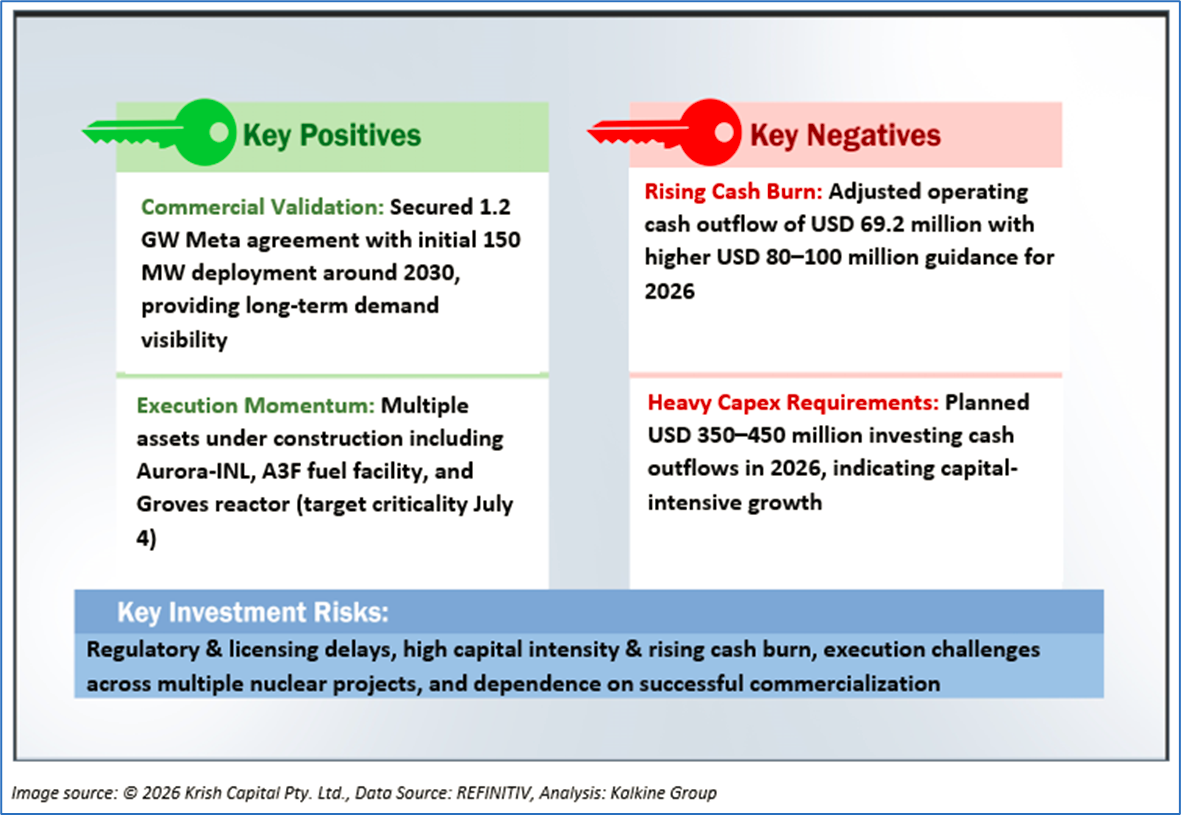
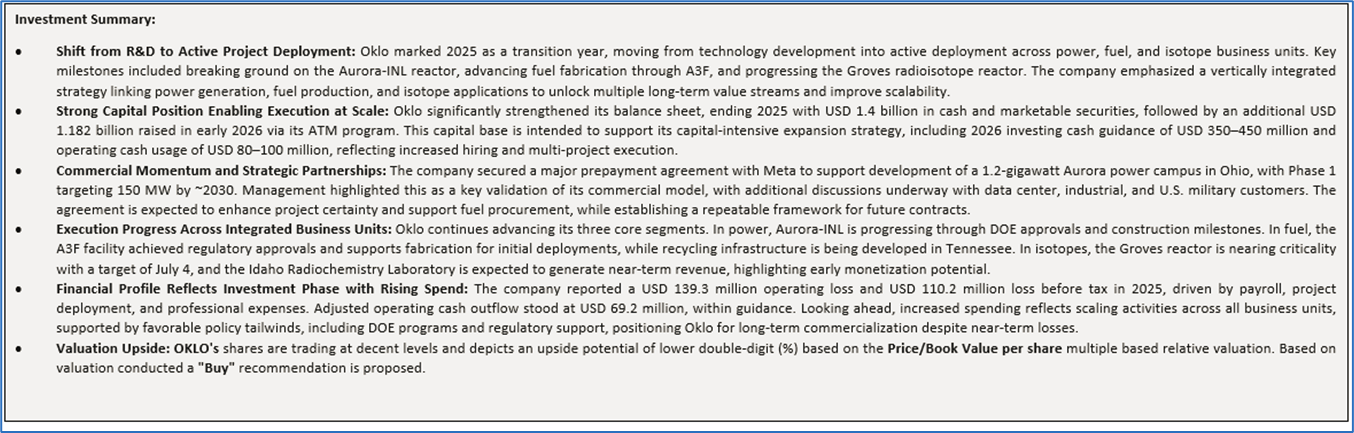
1.2 The Key Positives, Negatives, and Investment summary
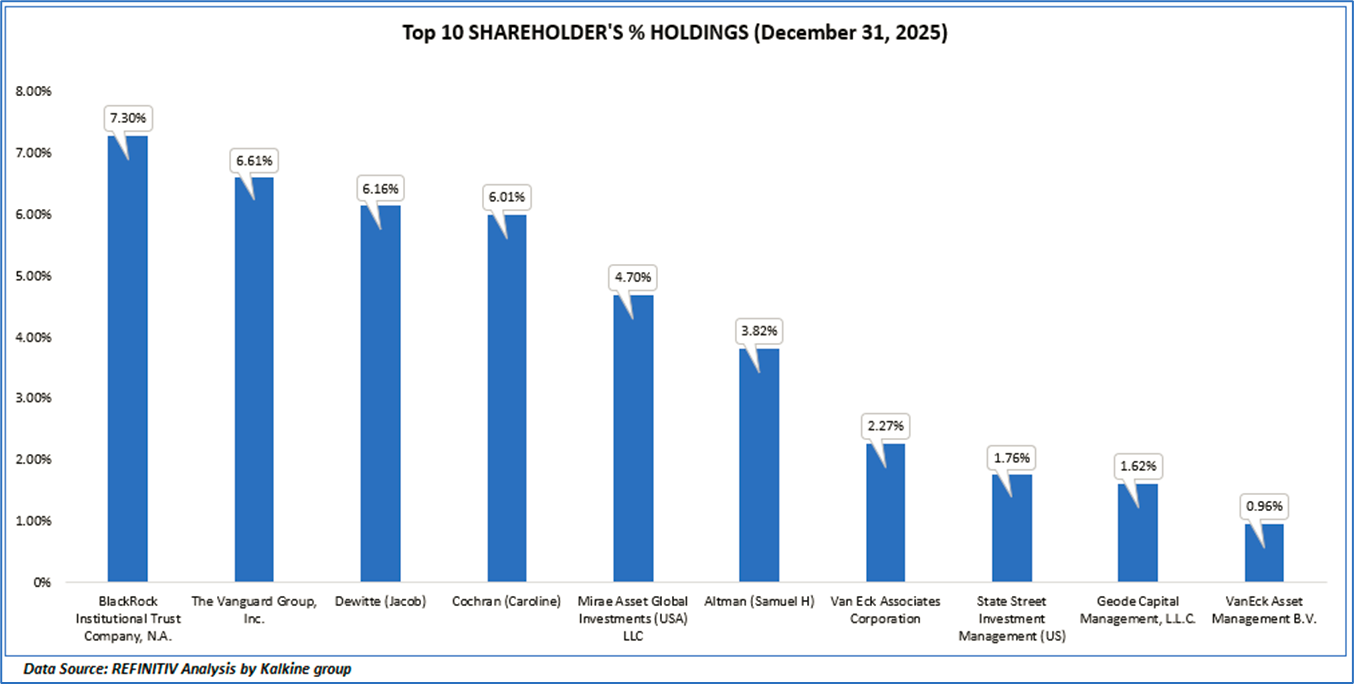
1.3 Top 10 shareholders:
The top 10 shareholders together form ~41.22% of the total shareholding, signifying concentrated shareholding. BlackRock Institutional Trust Company, N.A., and The Vanguard Group, Inc. are the biggest shareholders, holding the maximum stake in the company at 7.30% and 6.61%, respectively.
Section 2: Business Updates and Corporate Business Highlights
2.1 Recent Updates:
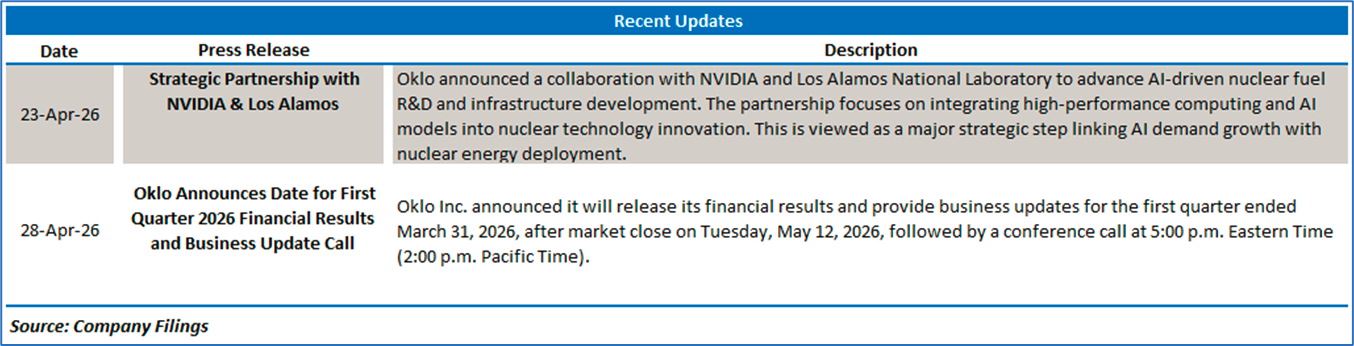
The below picture gives an overview of the recent updates:
2.2 Insights of FY25:
Section 3: Key Risks & Outlook
Section 4: Stock Recommendation Summary:
4.1 Price Performance and Technical Summary:
Stock Performance:
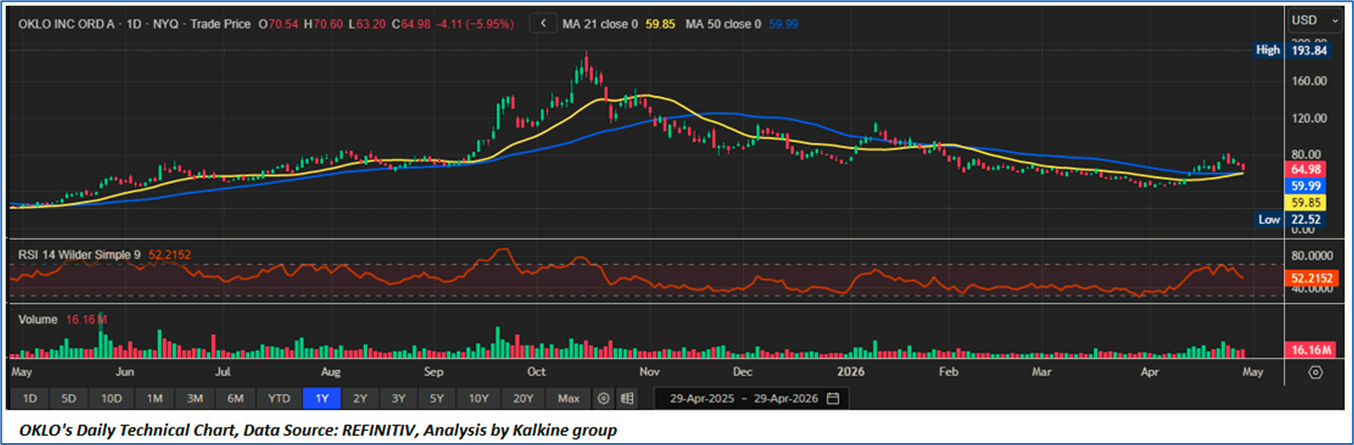
- Trend Structure and Medium-Term Consolidation Phase: OKLO is currently in a post-peak consolidation phase after a strong rally that topped near USD 193.84, with price now stabilizing around USD 64.98. The stock is trading close to both the 21-day moving average (USD 59.85) and 50-day moving average (USD 59.99), indicating a transition from a prior downtrend into a potential base-building structure. The recent recovery above these moving averages suggests improving trend alignment; however, the broader structure still reflects a series of lower highs since the peak, implying that a full bullish reversal is not yet confirmed.
- Momentum, RSI Dynamics and Volume Behaviour: The 14-day RSI at 52.21 signals neutral-to-positive momentum, having recovered from weaker levels and now sitting slightly above the midpoint. This suggests improving buying interest without entering overbought territory, leaving room for further upside if momentum strengthens. Volume has remained relatively steady at 16 million shares, with recent accumulation visible during upward price moves. This indicates gradual re-entry of market participants, though not yet at levels that confirm strong institutional conviction. Sustained higher volume on up-moves would be required to validate a stronger trend reversal.
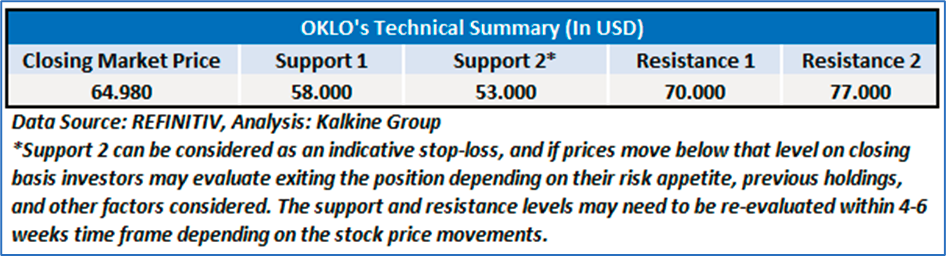
- Key Levels, Breakout Potential and Tactical Outlook: Immediate support lies near the USD 59.50–60.00 zone, aligned with both short-term moving averages, followed by a stronger base near USD 50.00. On the upside, initial resistance is visible around USD 75.00–80.00, with a breakout above this zone potentially opening upside toward USD 100+ and eventually retesting higher levels. Failure to hold above moving averages could reintroduce downside pressure toward the mid-50s. Overall, the technical bias is neutral with a positive tilt, as the stock attempts to transition from consolidation into a potential early-stage recovery, contingent on breakout confirmation and sustained volume support.
4.2 Fundamental Valuation
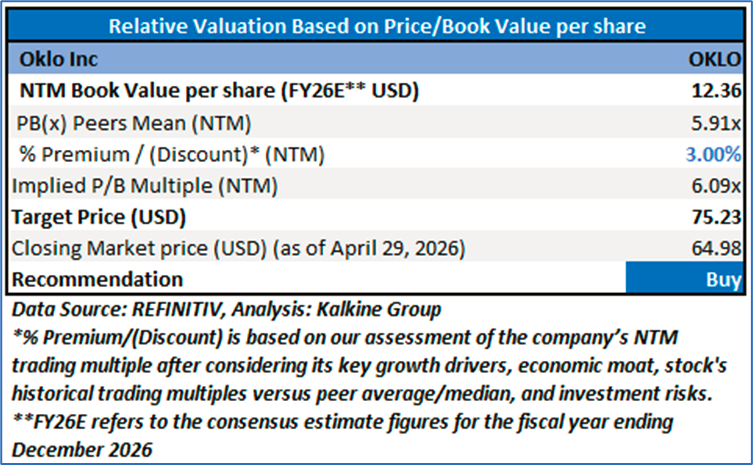
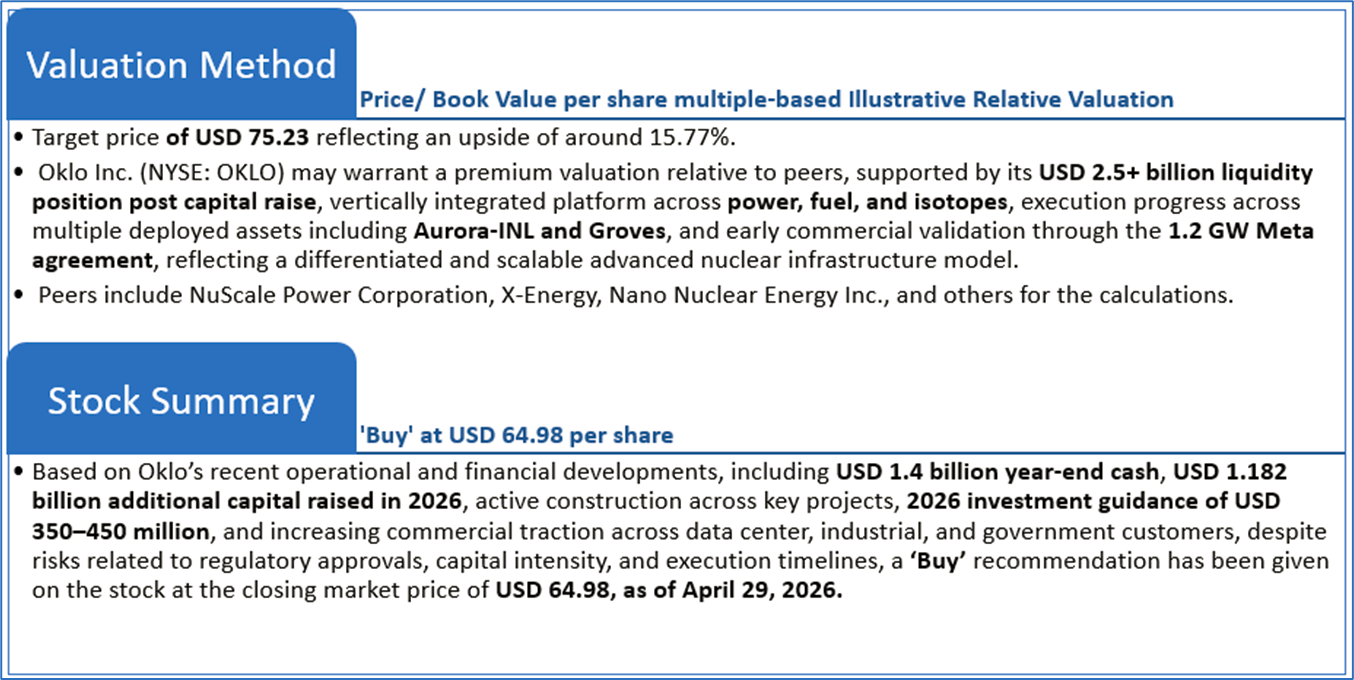
Valuation Methodology: Price/ Book Value per share Multiple Based Relative Valuation
Markets are trading in a highly volatile zone currently due to certain macroeconomic issues and geopolitical tensions prevailing. Therefore, it is prudent to follow a cautious approach while investing.
Note 1: Past performance is not a reliable indicator of future performance.
Note 2: The reference date for all price data, currency, technical indicators, support, and resistance levels is April 29, 2026. The reference data in this report has been partly sourced from REFINITIV.
Note 3: Investment decisions should be made depending on an individual's appetite for upside potential, risks, holding duration, and any previous holdings. An 'Exit' from the stock can be considered if the Target Price mentioned as per the Valuation and or the technical levels provided has been achieved and is subject to the factors discussed above.
Note 4: The report publishing date is as per the Pacific Time Zone.
Technical Indicators Defined: -
Support: A level at which the stock prices tend to find support if they are falling, and a downtrend may take a pause backed by demand or buying interest. Support 1 refers to the nearby support level for the stock and if the price breaches the level, then Support 2 may act as the crucial support level for the stock.
Resistance: A level at which the stock prices tend to find resistance when they are rising, and an uptrend may take a pause due to profit booking or selling interest. Resistance 1 refers to the nearby resistance level for the stock and if the price surpasses the level, then Resistance 2 may act as the crucial resistance level for the stock.
Stop-loss: It is a level to protect against further losses in case of unfavorable movement in the stock prices.
Past performance is not a reliable indicator of future performance.

 NZ
 UK
 US
 AU
 IND

 CA

 Please wait processing your request...