Section1: Commodity Update:
Gold prices dipped below USD 3,340 per ounce on Monday. This decline followed President Donald Trump's decision to postpone a 50% tariff on European goods until July 9, easing immediate trade tensions and reducing gold's appeal as a safe haven. Despite this delay, broader trade concerns persist. Last Friday, Trump also issued a warning to Apple Inc., stating that a 25% tariff would apply if iPhones aren't manufactured in the US. Last week, gold had seen a nearly 5% gain, primarily driven by tariff uncertainty and growing anxieties about the US fiscal outlook. The recently approved tax bill, which passed the House and is now awaiting a Senate vote by August, is projected to increase the US budget deficit by almost USD 3 trillion over the next decade.
Data Source: Trading Economics
Section2: Company Overview and Fundamental Insights:
2.1 Company Overview:
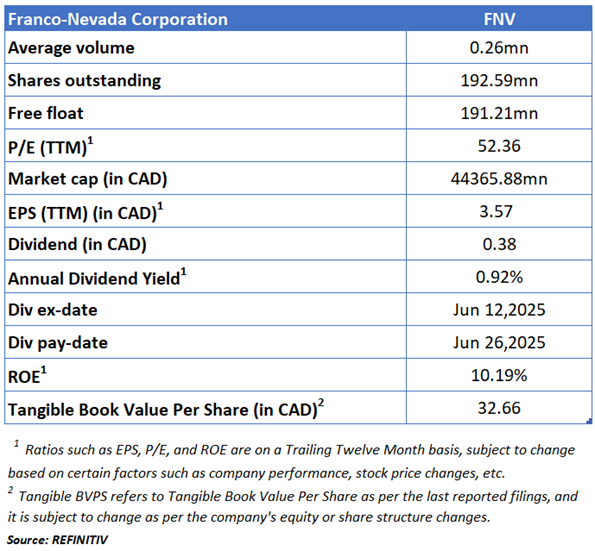
Franco-Nevada Corporation (TSX: FNV) is a precious-metals-focused royalty and investment company. The company owns a diversified portfolio of precious metals and royalty streams, which is actively managed to generate the bulk of its revenue from gold, silver, and platinum. The company does not operate mines, develop projects, or conduct exploration. Franco-Nevada's short-term financial performance is linked to the price of commodities and the amount of production from its portfolio of producing assets. Its long-term performance is affected by the availability of exploration and development capital. The company holds a portfolio of assets, diversified by commodity, revenue type, and stage of a project, primarily located in the United States, Canada, and Australia.
Kalkine’s Investor Report covers the Investment Highlights, Key Financial Metrics, Risks, Technical Analysis along with the Valuation, Target Price, and Recommendation on the stock.
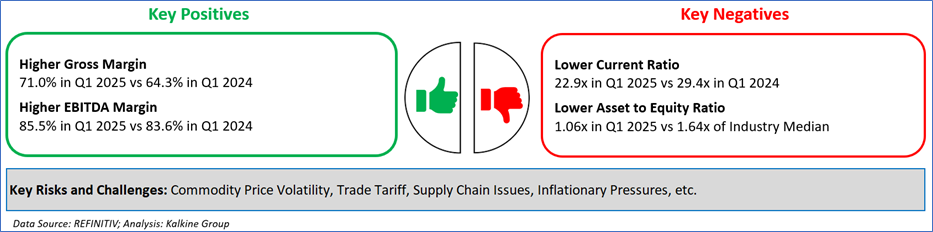
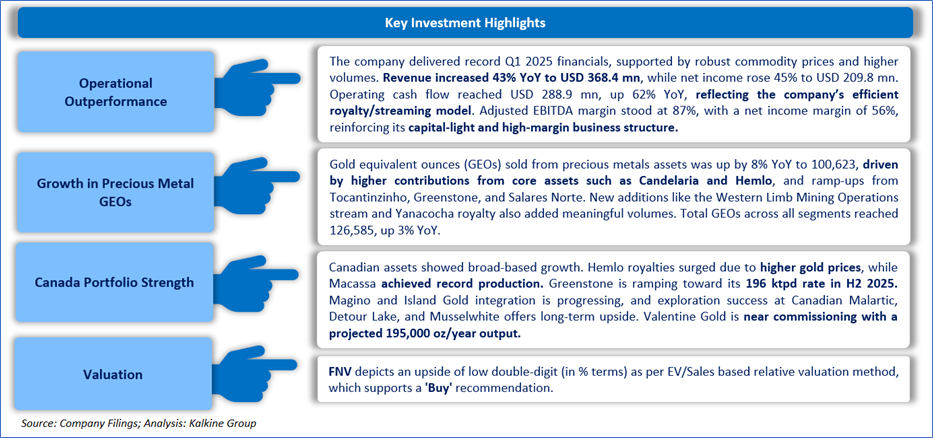
2.2 The Key Positives, Negatives, Investment Highlights and Risks
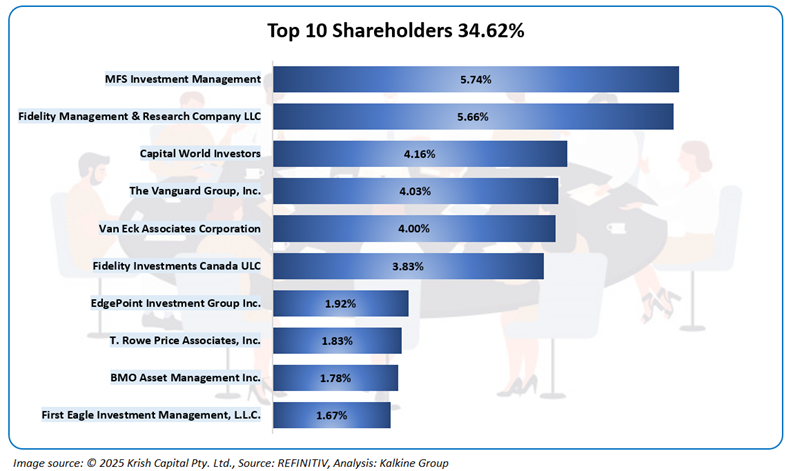
2.3 Top 10 Shareholders:
The top ten shareholders own around 34.62% of the total holdings. MFS Investment Management and Fidelity Management & Research Company LLC have maximum ownership in the company of around 5.74% and 5.66%, respectively.
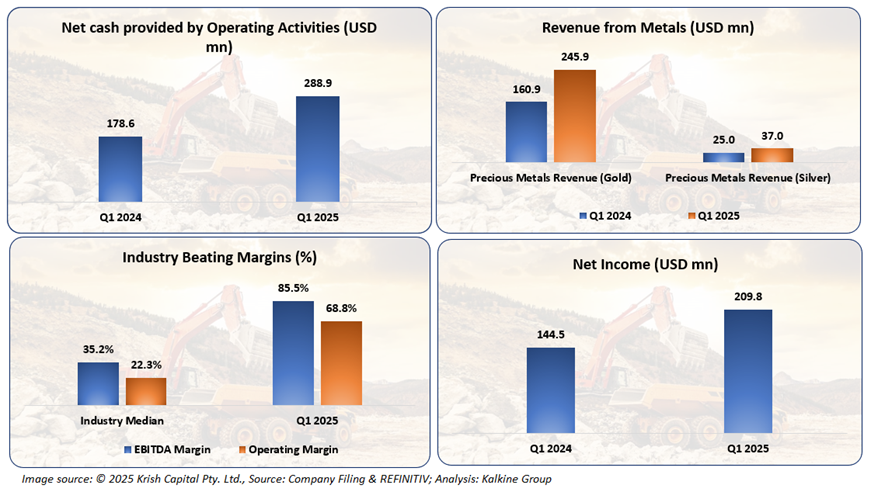
2.3 Key Metrics:
The company has consistently recorded decent financial results, which demonstrates its proven business model. The improvement in financial data was solely due to an increase in the Revenue growth specifically in gold and silver. Furthermore, the company witnessed an increase in Net cash provided by Operating Activities and Net Income.
Section 3: Business Updates and Financial Highlights
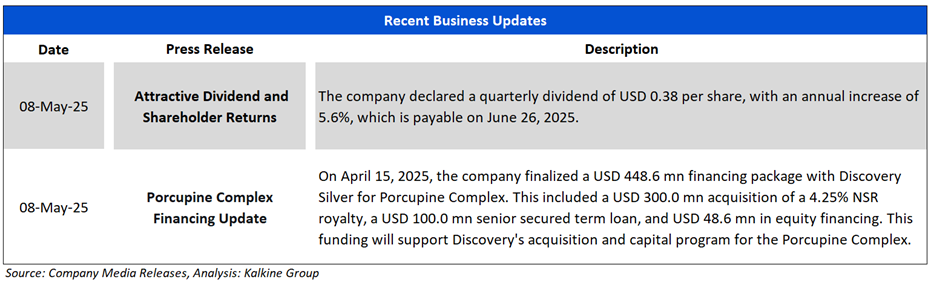
3.1 Recent Updates: The picture below gives an overview of the company’s recent activity on Dividend declaration and updates on Porcupine Complex Financing.
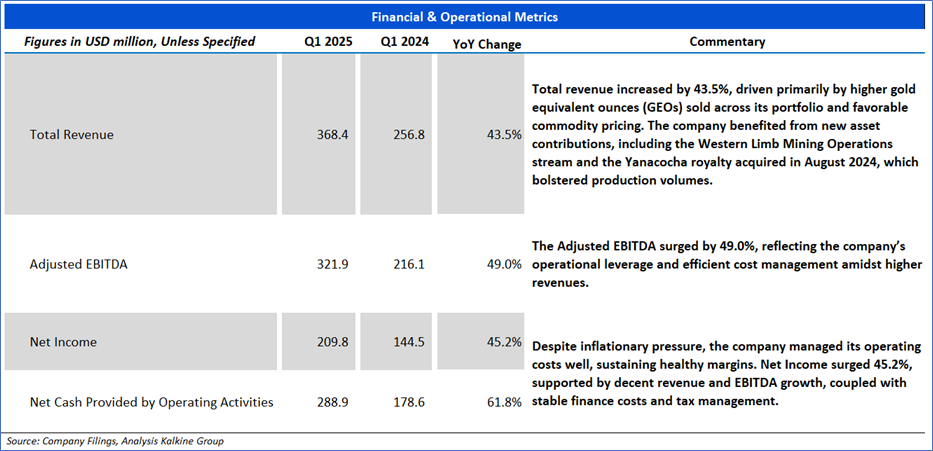
3.2 Insights on Q1 2025 Financial Performance:
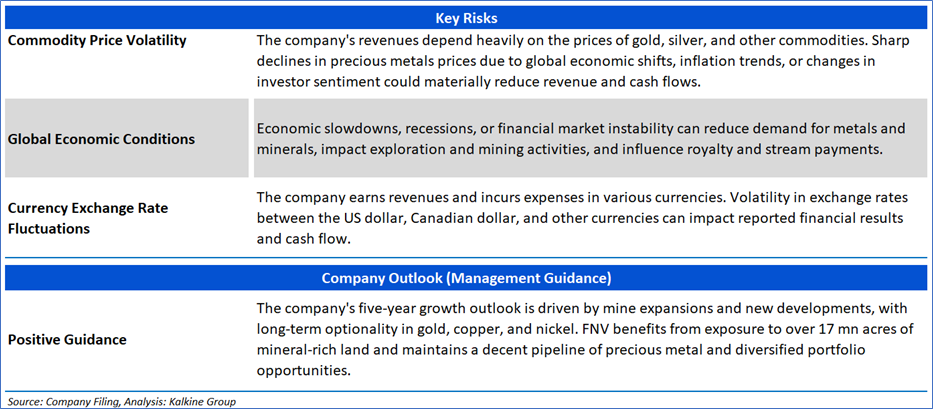
Section 4: Key Risks and Company Outlook
Section 5: Stock Recommendation Summary:
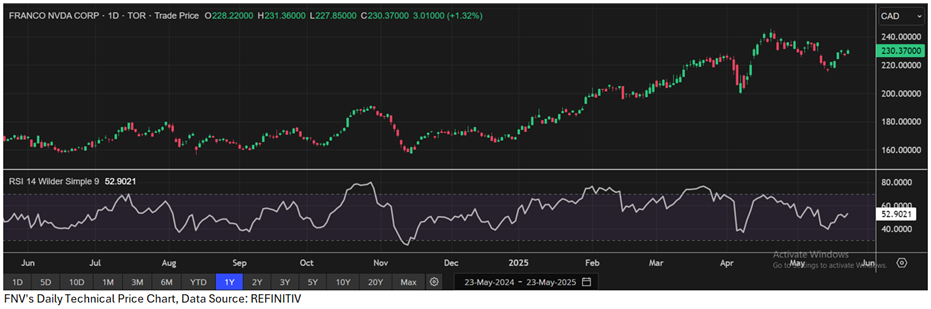
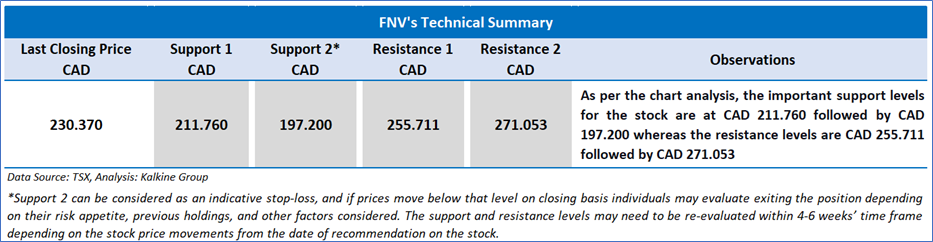
5.1 Price Performance and Technical Summary:

The stock has witnessed an upside of ~3.45% and a downside of ~2.48% over the last 1 week and 1 month respectively. Moreover, the stock is trading above the average 52-week high price of CAD 245.55 and the 52-week low price of CAD 156.31, providing an opportunity to ride the trend.
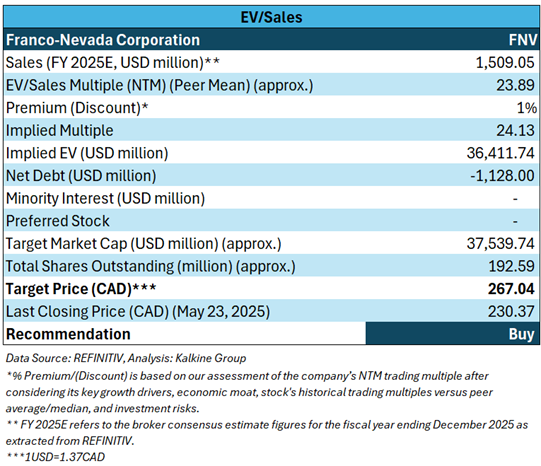
5.2 Fundamental Valuation
Valuation Methodology: EV to Sales Multiple Based Relative Valuation (Illustrative)

Markets are trading in a highly volatile zone currently due to certain macroeconomic issues and geopolitical tensions prevailing. Therefore, it is prudent to follow a cautious approach while investing.
Note 1: Past performance is not a reliable indicator of future performance.
Note 2: The reference date for all price data, currency, technical indicators, support, and resistance levels is May 23, 2025. The reference data in this report has been partly sourced from REFINITIV.
Note 3: Investment decisions should be made depending on an individual's appetite for upside potential, risks, holding duration, and any previous holdings. An 'Exit' from the stock can be considered if the Target Price mentioned as per the Valuation and or the technical levels provided has been achieved and is subject to the factors discussed above.
Note 4: Dividend Yield may vary as per the stock price movement.
Note 5: Kalkine reports are prepared based on the stock prices captured either from REFINITIV or Trading View. Typically, REFINITIV or Trading View may reflect stock prices with a delay which could be a lag of 25-30 minutes. There can be no assurance that future results or events will be consistent with the information provided in the report. The information is subject to change without any prior notice.
Technical Indicators Defined: -
Support: A level at which the stock prices tend to find support if they are falling, and a downtrend may take a pause backed by demand or buying interest. Support 1 refers to the nearby support level for the stock and if the price breaches the level, then Support 2 may act as the crucial support level for the stock.
Resistance: A level at which the stock prices tend to find resistance when they are rising, and an uptrend may take a pause due to profit booking or selling interest. Resistance 1 refers to the nearby resistance level for the stock and if the price surpasses the level, then Resistance 2 may act as the crucial resistance level for the stock.
Stop-loss: It is a level to protect further losses in case of unfavourable movement in the stock prices.
Past performance is not a reliable indicator of future performance.

 Please wait processing your request...