Section 1: Company Overview and Fundamentals
1.1 Company Overview:
Palantir Technologies Inc. (NASDAQ: PLTR) is engaged in building software to assist in counterterrorism investigations and operations. The Company has built four principal software platforms, including Palantir Gotham (Gotham), Palantir Foundry (Foundry), Palantir Apollo (Apollo), and Palantir Artificial Intelligence Platform (AIP).
Kalkine’s American Tech Report covers the Company Overview, Key positives & negatives, Investment summary, Key investment metrics, Top 10 shareholding, Business updates and insights into company recent financial results, Key Risks & Outlook, Price performance and technical summary, Target Price, and Recommendation on the stock.
Price Performance:
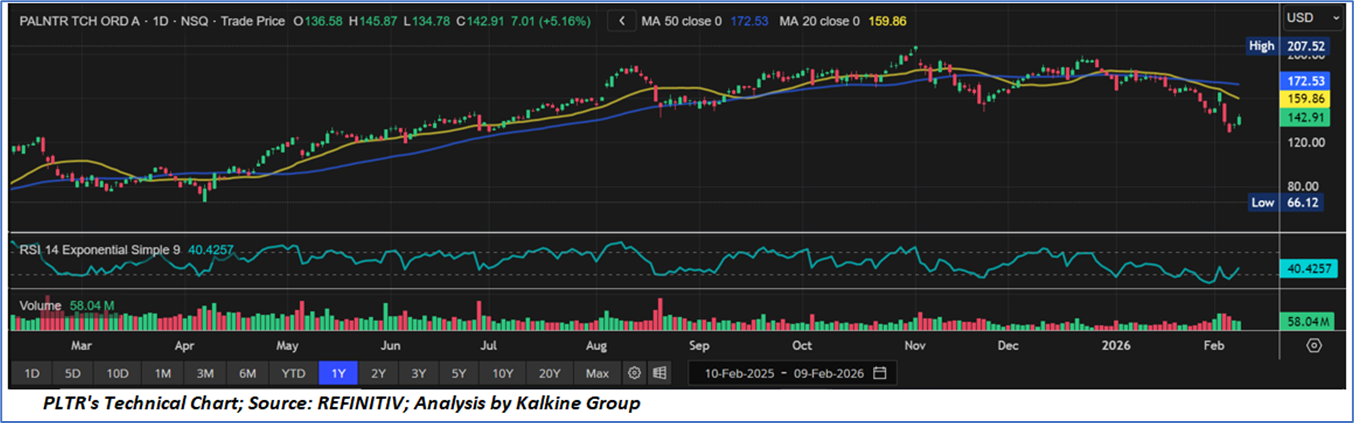
- Trend Structure and Price Positioning: Palantir remains within a broader medium-term uptrend, though recent price action reflects a corrective pullback from the prior peak near USD 207. The stock is consolidating in the USD 140–145 range, suggesting stabilization rather than a confirmed structural breakdown. The longer-term bias remains constructive provided key support levels continue to hold.
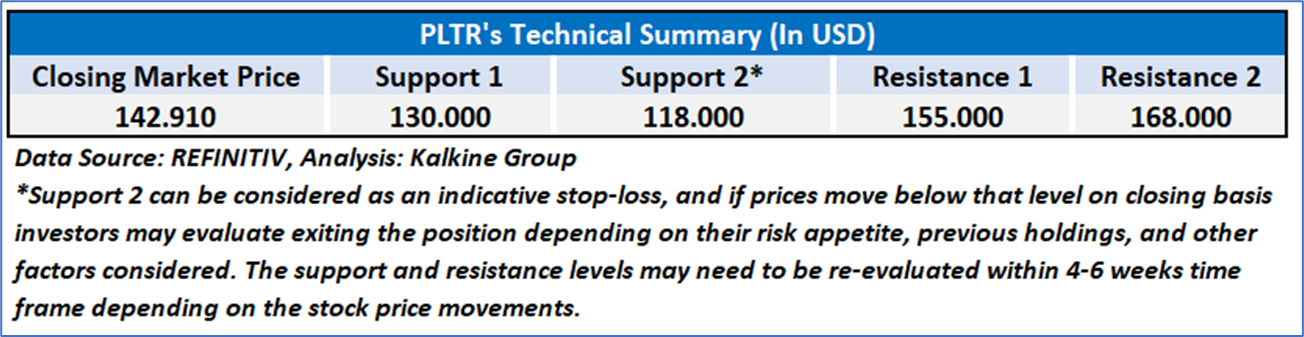
- Moving Averages and Key Technical Levels: PLTR is currently trading below its 20-day and 50-day moving averages, indicating short-term technical pressure and overhead resistance. The USD 135–140 zone is emerging as an important support band, while a sustained move back above the USD 160–170 region would be required to restore bullish momentum.
- Momentum and Volume Dynamics: RSI in the low-40s reflects neutral-to-soft momentum, consistent with consolidation rather than capitulation. Volume trends appear orderly, suggesting controlled profit-taking rather than aggressive distribution. A pickup in momentum and stronger upside volume would be needed to confirm a renewed breakout phase
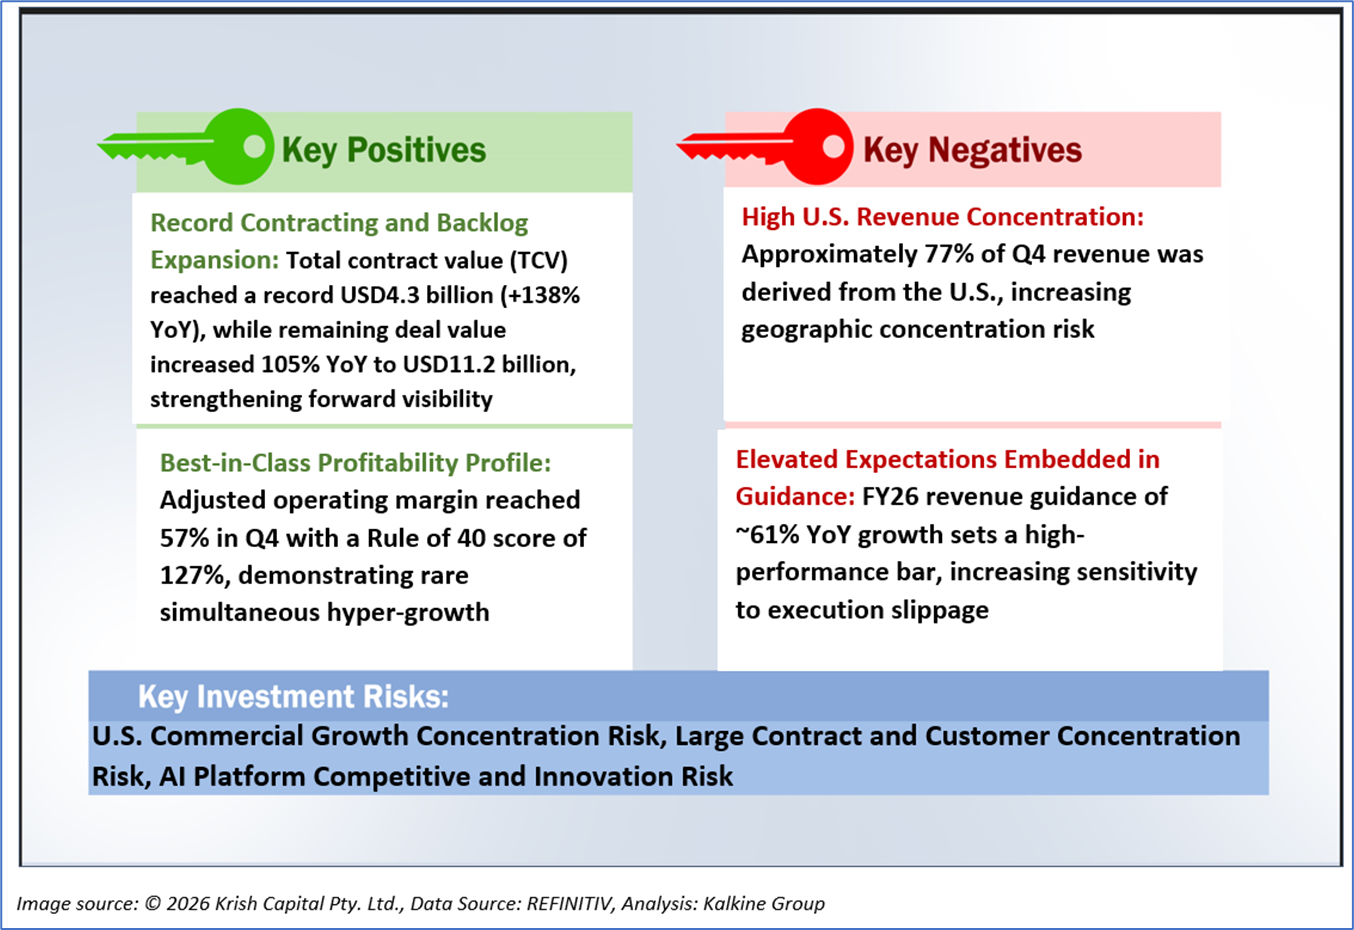
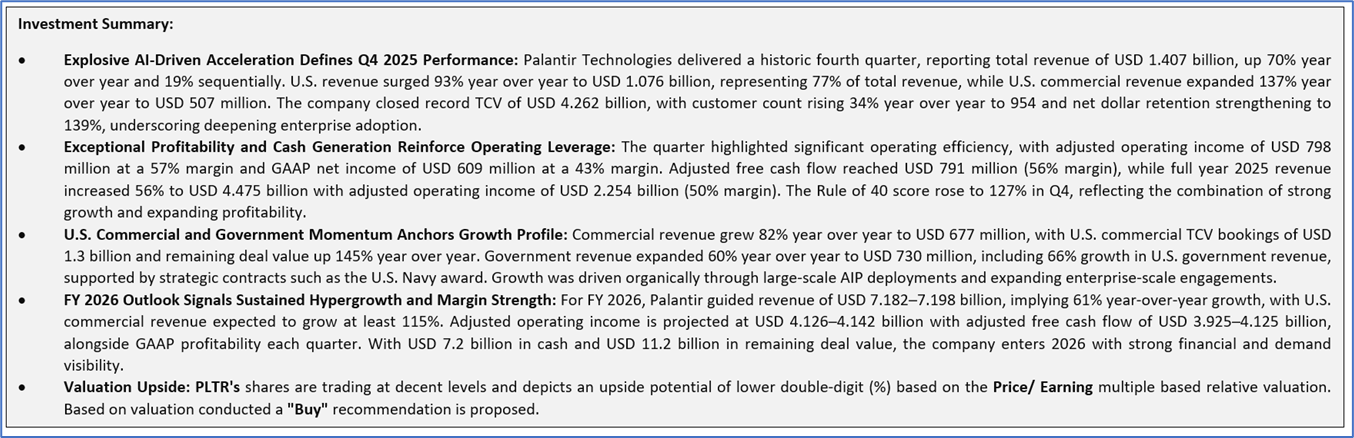
1.2 The Key Positives, Negatives, and Investment summary
1.3 Top 10 shareholders:
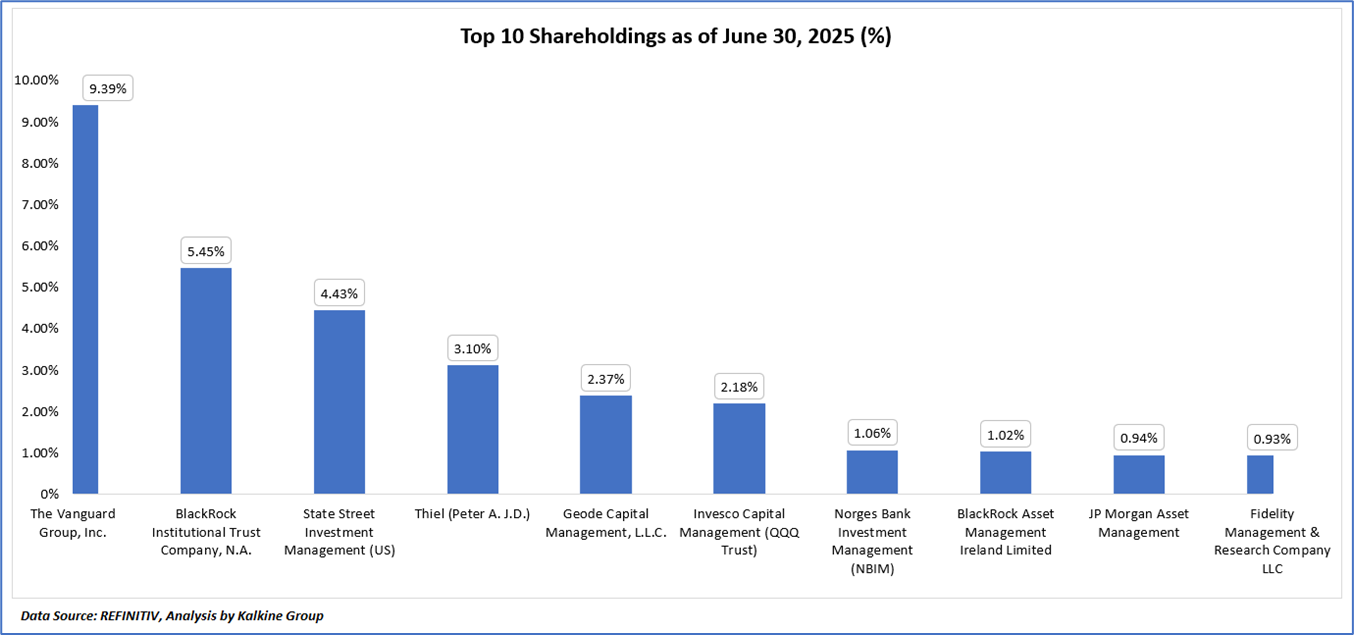
The top 10 shareholders together form ~30.88% of the total shareholding, signifying concentrated shareholding. The Vanguard Group, Inc., and BlackRock Institutional Trust Company, N.A. are the biggest shareholders, holding the maximum stake in the company at ~9.39% and ~5.45%, respectively.
1.4 Key Metrics
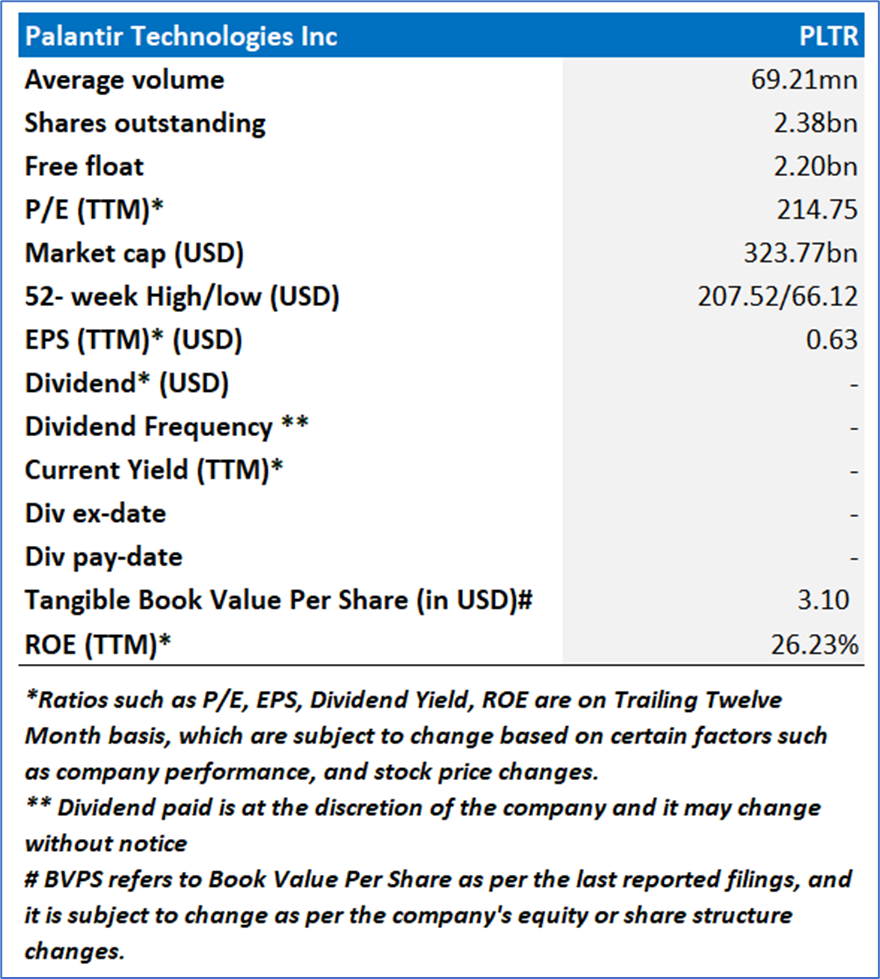
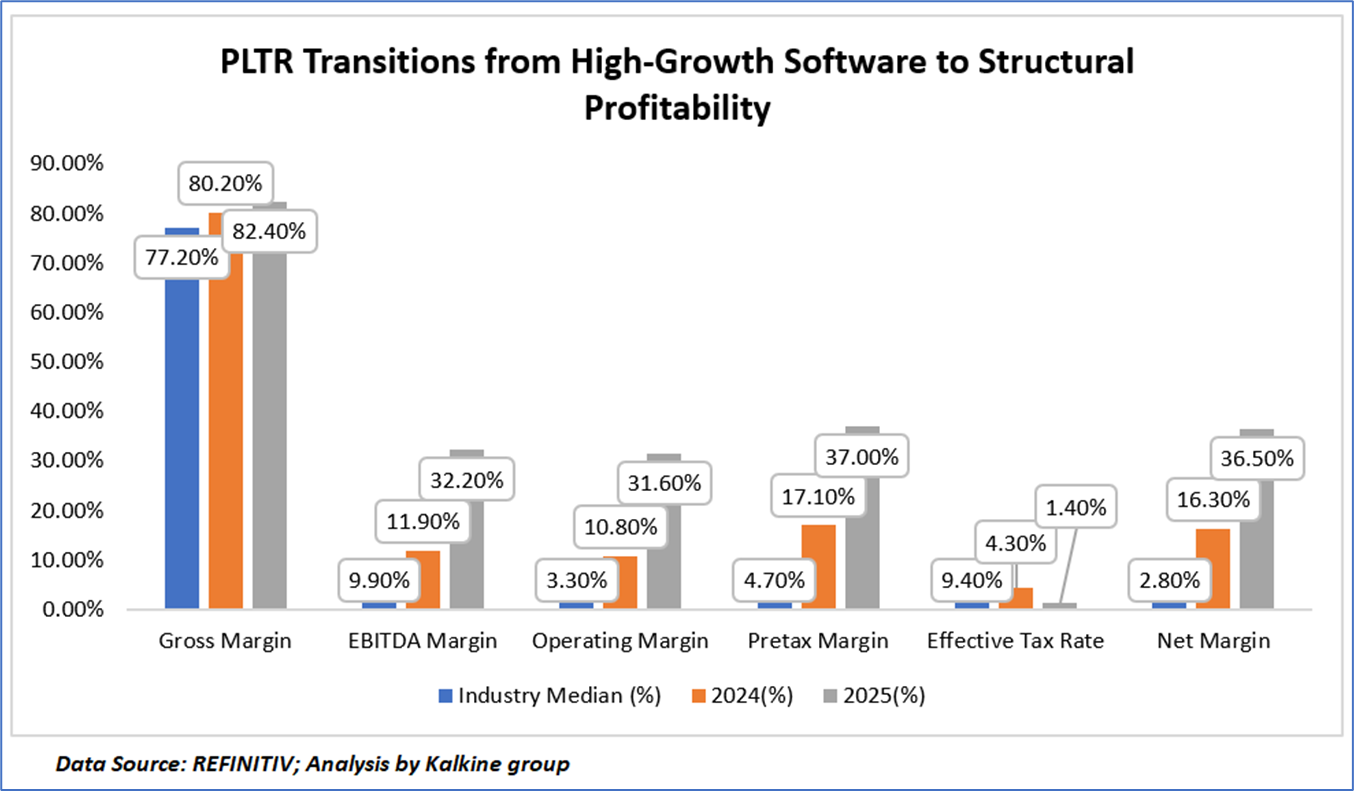
Palantir Technologies’ 2025 financial profile reflects a decisive step-change in profitability, materially outperforming both its 2024 performance and industry median benchmarks across nearly every margin metric. Gross margin expanded to 82.4%, exceeding the industry median of 77.2% and reinforcing the scalability of its software-centric model. More notably, EBITDA margin surged to 32.2% (versus 11.9% in 2024 and a 9.9% industry median), while operating margin expanded sharply to 31.6%, nearly ten times the 3.3% industry median and almost triple its 2024 level of 10.8%, signaling substantial operating leverage as revenue accelerated. Pretax margin increased to 37.0%, reflecting both revenue scale and disciplined expense control, while the effective tax rate declined to 1.4%, further supporting bottom-line expansion. Consequently, net margin reached 36.5%, dramatically higher than the 16.3% recorded in 2024 and well above the 2.8% industry median, underscoring PLTR’s transition from a high-growth SaaS platform to a structurally profitable, cash-generative enterprise software leader with exceptional margin differentiation.
Section 2: Business Updates and Financial Highlights
2.1 Recent Updates:
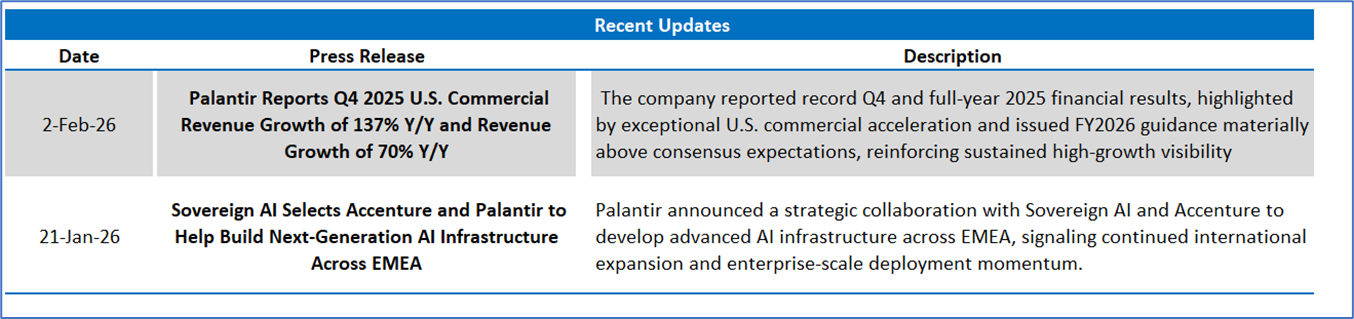
The below picture gives an overview of the recent updates:
2.2 Insights of FY25:
Section 3: Key Risks and Outlook:
Section 4: Stock Recommendation Summary:
4.1 Technical Summary:
Price Performance:
- Trend Structure and Price Positioning: Palantir remains within a broader medium-term uptrend, though recent price action reflects a corrective pullback from the prior peak near USD 207. The stock is consolidating in the USD 140–145 range, suggesting stabilization rather than a confirmed structural breakdown. The longer-term bias remains constructive provided key support levels continue to hold.
- Moving Averages and Key Technical Levels: PLTR is currently trading below its 20-day and 50-day moving averages, indicating short-term technical pressure and overhead resistance. The USD 135–140 zone is emerging as an important support band, while a sustained move back above the USD 160–170 region would be required to restore bullish momentum.
- Momentum and Volume Dynamics: RSI in the low-40s reflects neutral-to-soft momentum, consistent with consolidation rather than capitulation. Volume trends appear orderly, suggesting controlled profit-taking rather than aggressive distribution. A pickup in momentum and stronger upside volume would be needed to confirm a renewed breakout phase.
4.2 Fundamental Valuation
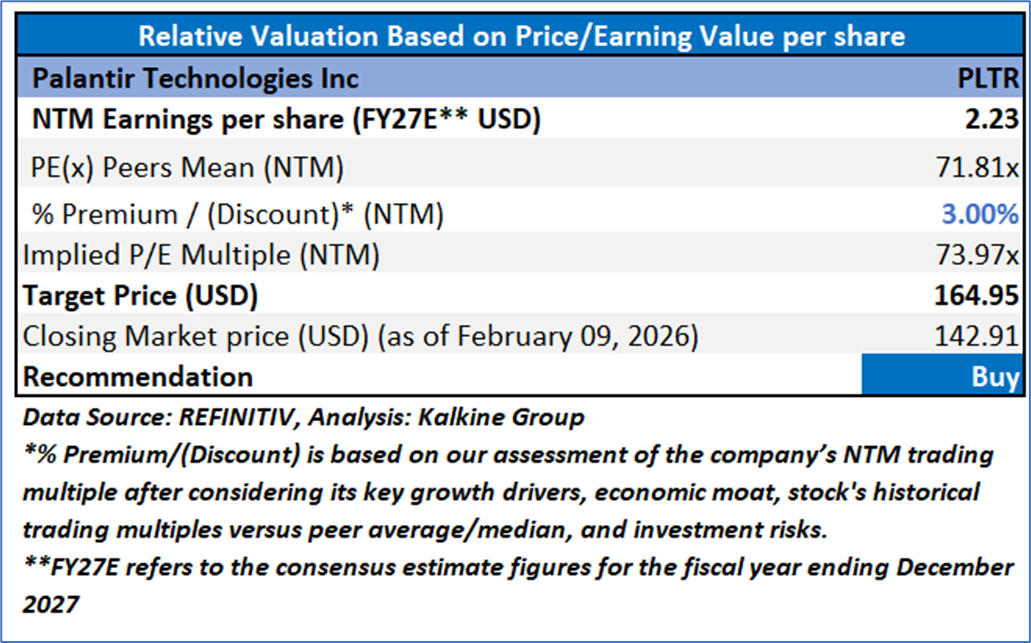
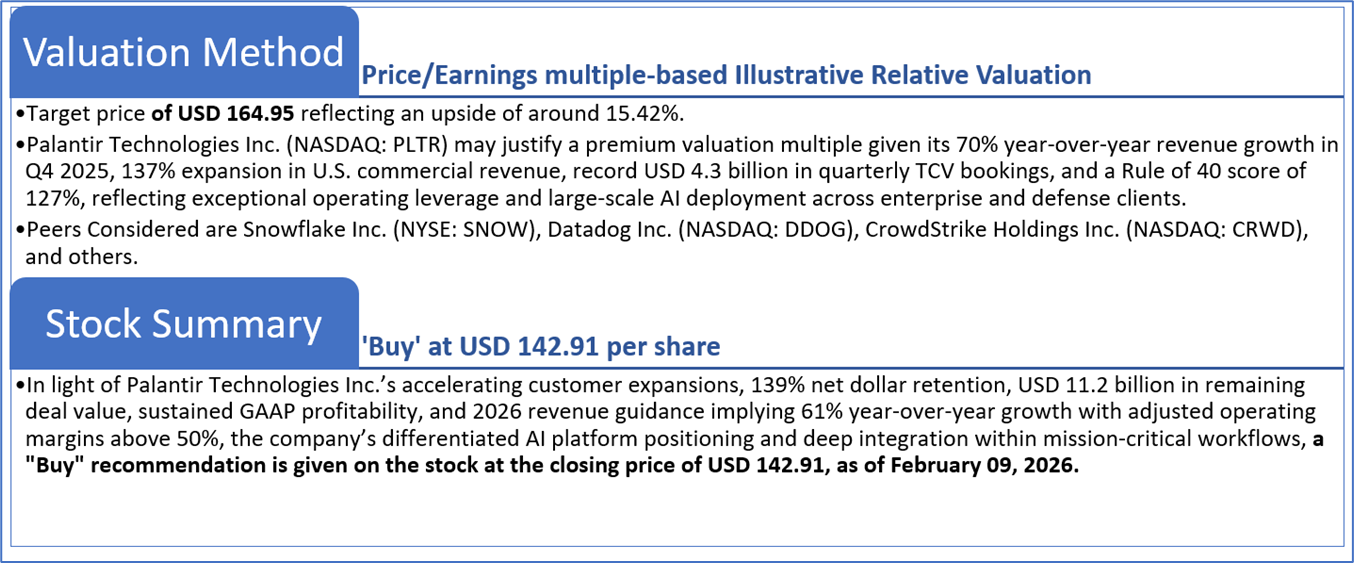
Valuation Methodology: Price/Earnings Multiple Based Relative Valuation
Markets are trading in a highly volatile zone currently due to certain macroeconomic issues and geopolitical tensions prevailing. Therefore, it is prudent to follow a cautious approach while investing.
Note 1: Past performance is not a reliable indicator of future performance.
Note 2: The reference date for all price data, currency, technical indicators, support, and resistance levels is February 09, 2026. The reference data in this report has been partly sourced from REFINITIV.
Note 3: Investment decisions should be made depending on an individual's appetite for upside potential, risks, holding duration, and any previous holdings. An 'Exit' from the stock can be considered if the Target Price mentioned as per the Valuation and or the technical levels provided has been achieved and is subject to the factors discussed above.
Note 4: The report publishing date is as per the Pacific Time Zone.
Technical Indicators Defined: -
Support: A level at which the stock prices tend to find support if they are falling, and a downtrend may take a pause backed by demand or buying interest. Support 1 refers to the nearby support level for the stock and if the price breaches the level, then Support 2 may act as the crucial support level for the stock.
Resistance: A level at which the stock prices tend to find resistance when they are rising, and an uptrend may take a pause due to profit booking or selling interest. Resistance 1 refers to the nearby resistance level for the stock and if the price surpasses the level, then Resistance 2 may act as the crucial resistance level for the stock.
Stop-loss: It is a level to protect against further losses in case of unfavorable movement in the stock prices.
Past performance is not a reliable indicator of future performance.

 NZ
 UK
 US
 AU
 IND

 CA

 Please wait processing your request...