Section 1: Company Overview, Shariah Compliance Standards and Fundamentals
Section 1.1: Palo Alto Networks, Inc. (NASDAQ: PANW) is a global artificial intelligence (AI) cybersecurity company, with a comprehensive portfolio of cybersecurity solutions and platforms across network, cloud, security operations, AI and Identity. Its network security platform includes Secure Access Service Edge (SASE), Next-Generation Firewalls, Cloud Delivered Security Services (CDSS), Prisma AIRS, and Strata Cloud Manager (SCM).
Kalkine’s ‘The Shariah Compliance Report’ covers the Investment Highlights, Shariah-compliance standards, Key Financial Metrics, Risks, and Technical Analysis along with the Valuation, Target Price, and Recommendation on the stock.

Section 1.2: What are the Key Metrics for Shariah Compliance to be Considered?
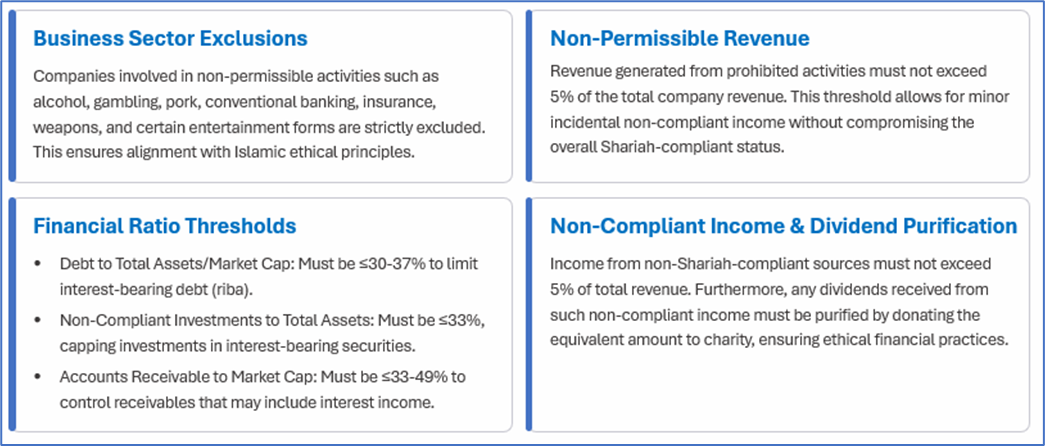
The Shariah Compliance Report aims to identify equities that align with Shariah and ethical principles, providing valuable insights on financial metrics, business activities and compliance with Islamic finance norms.
Key Shariah Screening Criteria and Thresholds
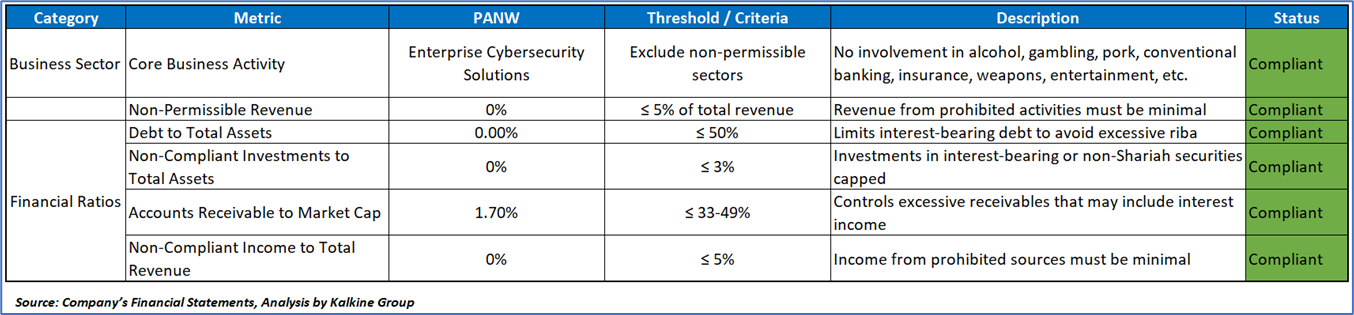
Shariah Metrics for Palo Alto Networks Inc. (NASDAQ: PANW):
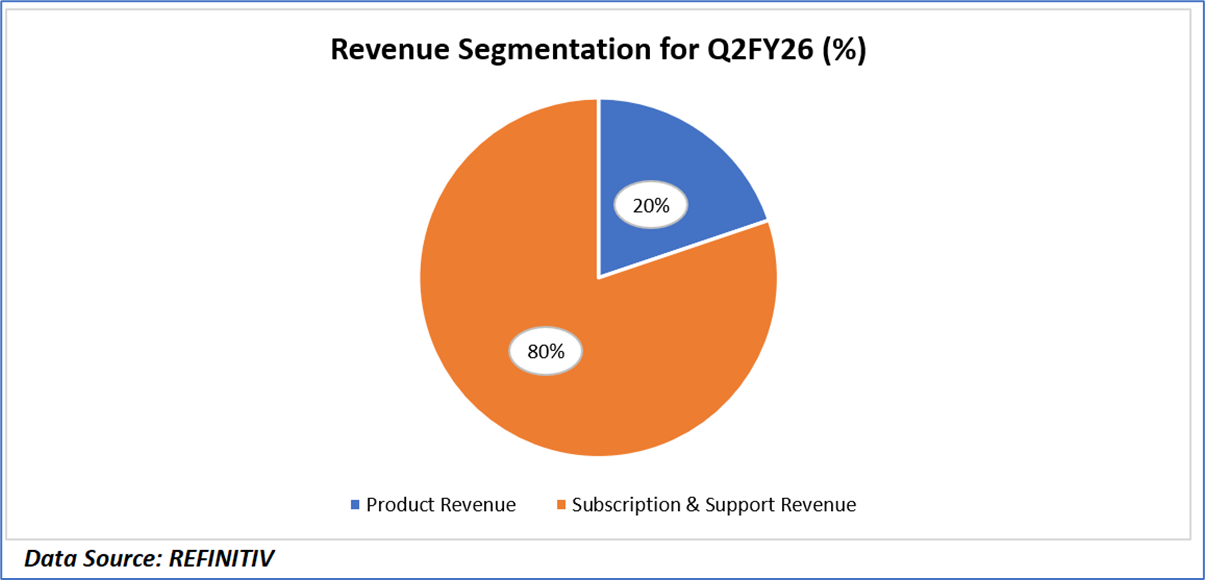
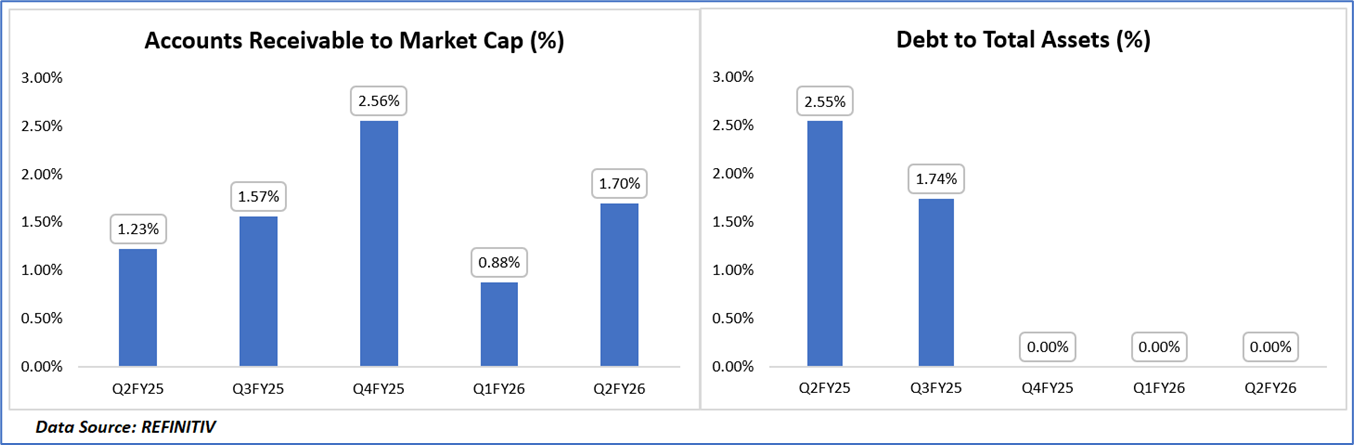
Revenue Segmentation of PANW in Q2FY26 & Historical Compliance of Financial Ratios:
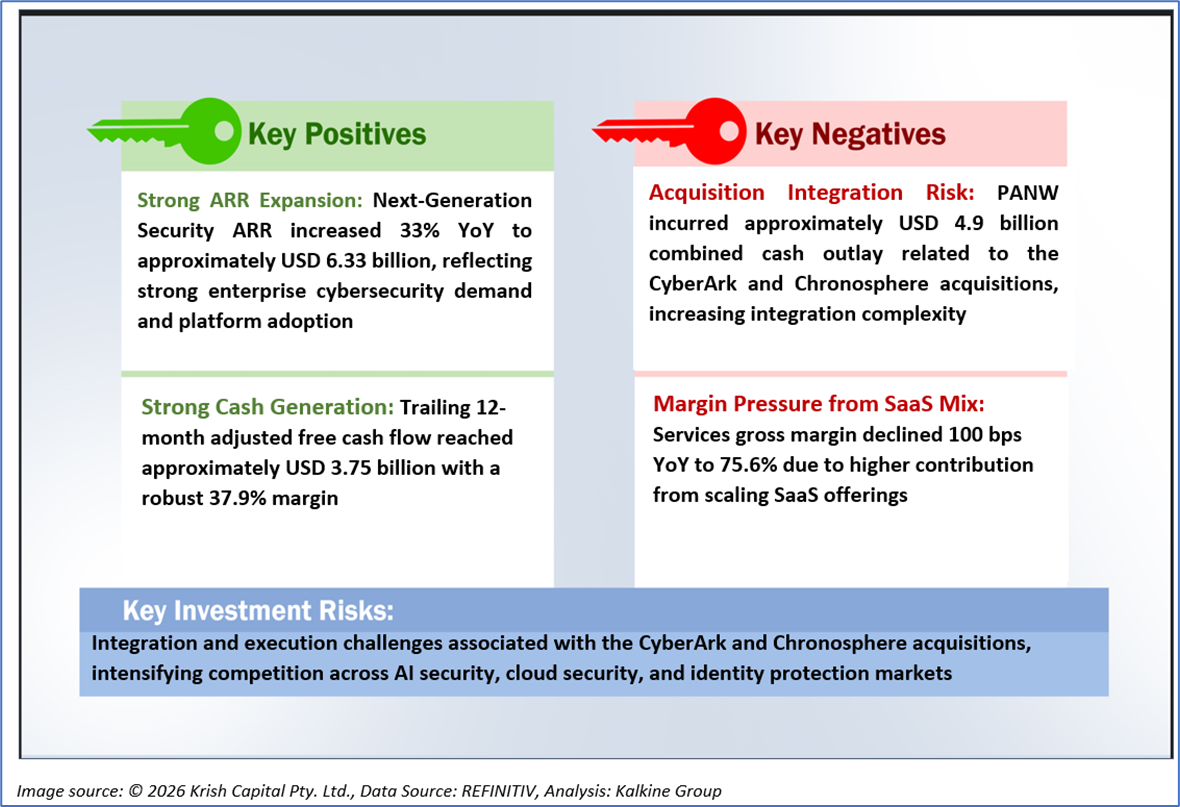
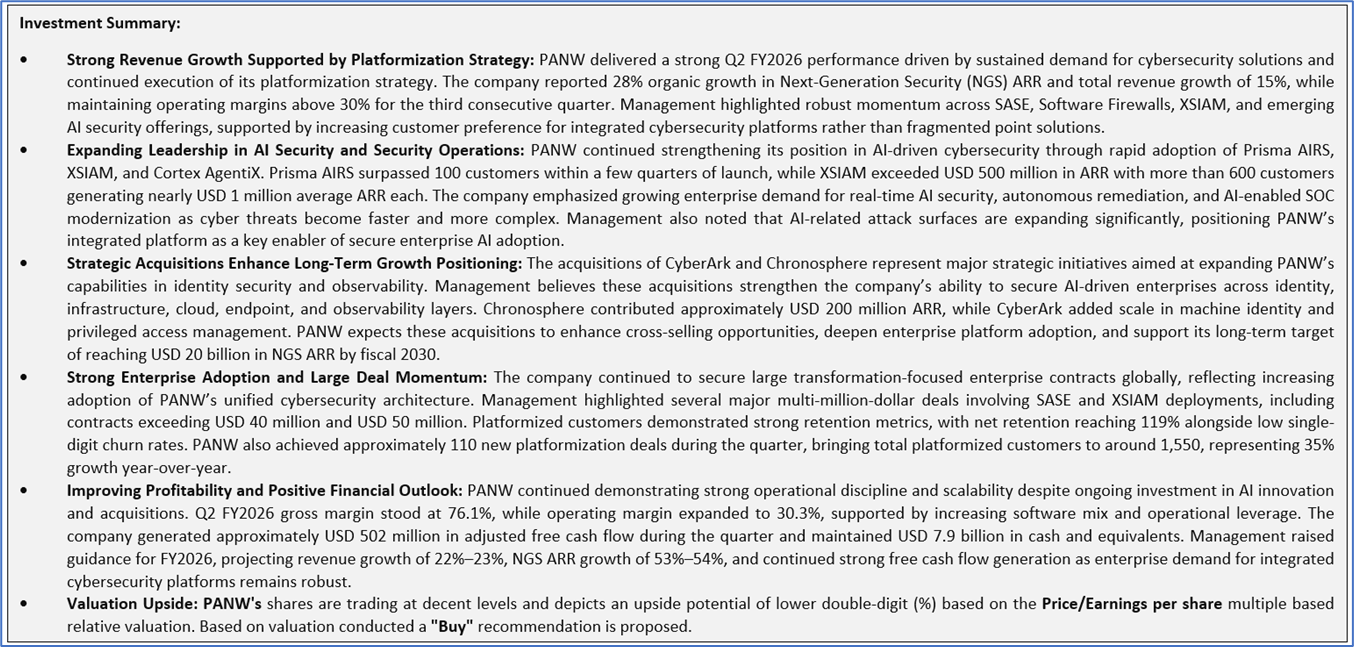
1.3 The Key Positives, Negatives, and Investment summary
1.4 Top 10 shareholders:
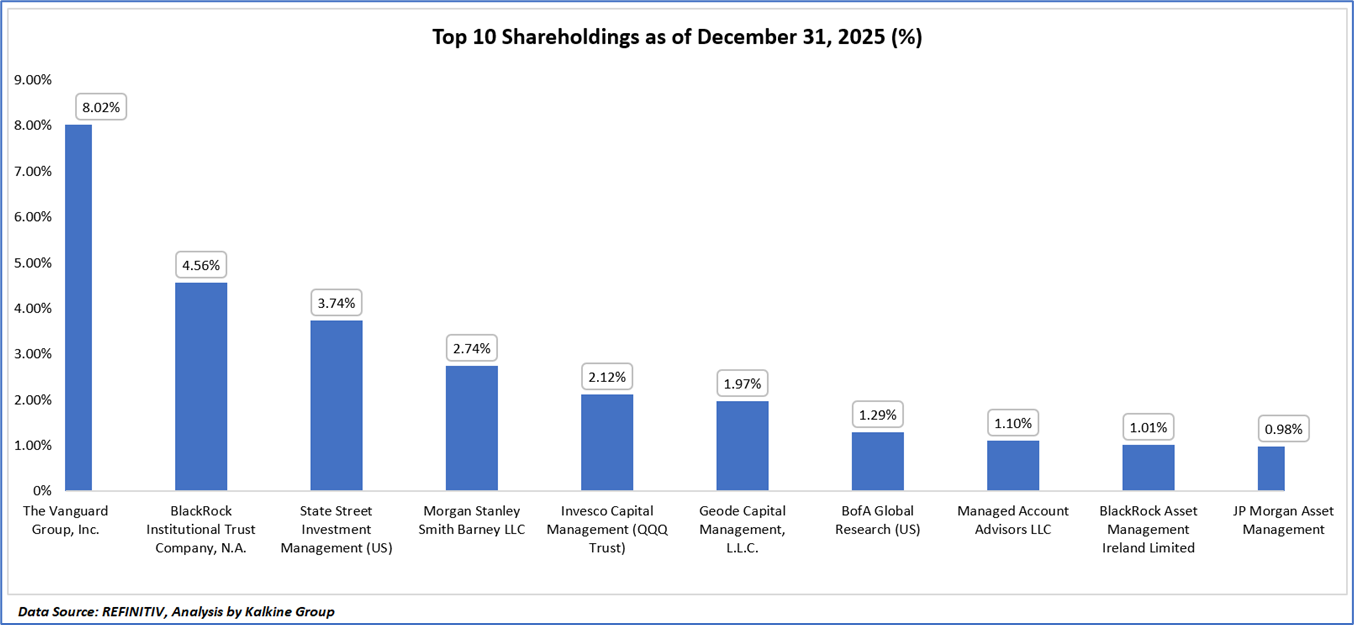
The top 10 shareholders together form ~27.53% of the total shareholding, signifying concentrated shareholding. The Vanguard Group, Inc., and BlackRock Institutional Trust Company, N.A. are the biggest shareholders, holding the maximum stake in the company at ~8.02% and ~4.56%, respectively.
1.5 Key Metrics:
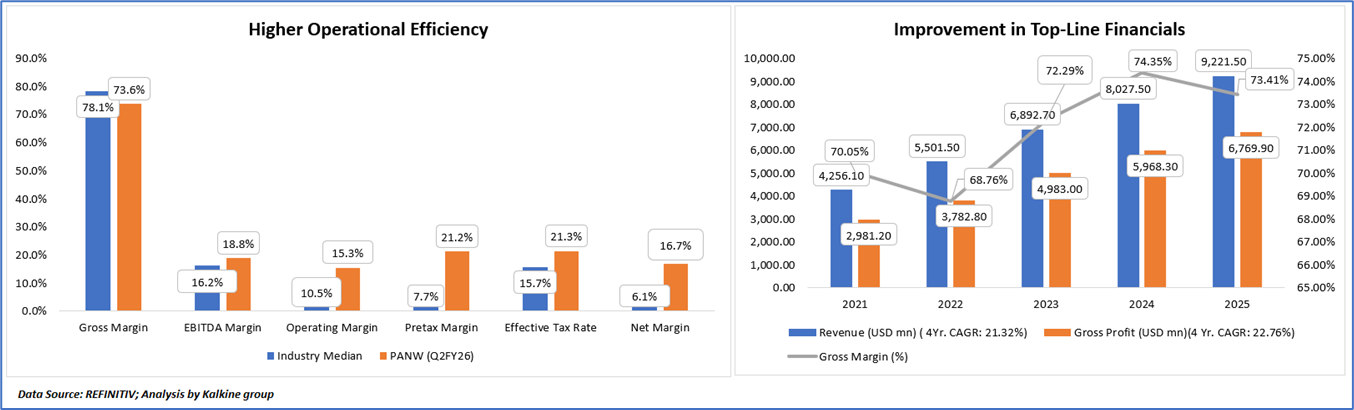
- Strong Revenue Growth Reflects Sustained Cybersecurity Demand: Palo Alto Networks (PANW) has demonstrated strong top-line expansion over the last four years, with revenue increasing from approximately USD 4.26 billion in FY2021 to USD 9.22 billion in FY2025, representing a robust 4-year CAGR of 21.32%. The growth trajectory reflects increasing enterprise adoption of PANW’s integrated cybersecurity platform across network security, cloud security, SASE, AI security, and security operations solutions. The consistent acceleration in revenue also highlights the company’s ability to capitalize on rising cybersecurity spending and expanding AI-driven security requirements globally.
- Gross Profit Expansion Supported by Software-Led Business Mix: Gross profit increased from approximately USD 2.98 billion in FY2021 to USD 6.77 billion in FY2025, delivering a stronger 4-year CAGR of 22.76%, slightly ahead of revenue growth. This indicates improving operational leverage and increasing contribution from higher-margin software and subscription-based offerings. PANW’s expanding platformization strategy, rising adoption of Software Firewalls, XSIAM, and Prisma AIRS, along with growing recurring subscription revenues, have supported long-term profitability expansion despite continued investments in innovation and acquisitions.
- Gross Margin Stability Indicates Healthy Pricing Power: PANW maintained relatively stable gross margins within the 69%–74% range over FY2021–FY2025, with margins improving from 70.05% in FY2021 to 73.41% in FY2025. The expansion toward FY2024 and FY2025 reflects a favorable software mix, operational efficiencies, and increasing scale benefits from cloud-delivered security services. Although the Q2 FY2026 gross margin of 73.6% remains slightly below the industry median of 78.1%, the company continues to demonstrate strong pricing discipline and resilient profitability while balancing rapid growth and ongoing investments in AI security and platform expansion.
- Superior Profitability Metrics Compared to Industry Peers: PANW’s profitability profile remains notably stronger than industry median levels across most operating metrics. In Q2 FY2026, EBITDA margin stood at 18.8% versus the industry median of 16.2%, while operating margin reached 15.3% compared to the industry benchmark of 10.5%. Pretax margin was particularly strong at 21.2%, significantly outperforming the industry median of 7.7%, reflecting efficient cost management, strong recurring revenue generation, and scalable operating leverage. Additionally, PANW’s net margin of 16.7% substantially exceeded the industry median of 6.1%, highlighting the company’s strong earnings conversion capabilities despite elevated investment activity.
- Margin Structure Reflects Scalable Business Model with Continued Investment Capacity: The company’s overall financial profile demonstrates a scalable cybersecurity platform model capable of generating strong profitability alongside sustained growth investments. While PANW’s effective tax rate of 21.3% remains moderately above the industry median of 15.7%, the company continues to deliver strong bottom-line performance supported by expanding subscription revenues, disciplined operating expense management, and increasing enterprise platform adoption. The combination of strong revenue growth, expanding gross profit, and above-industry profitability metrics positions PANW favorably to continue investing aggressively in AI security, identity protection, cloud security, and strategic acquisitions while maintaining healthy financial flexibility.
Section 2: Business Updates and Financial Highlights
2.1 Recent Updates:
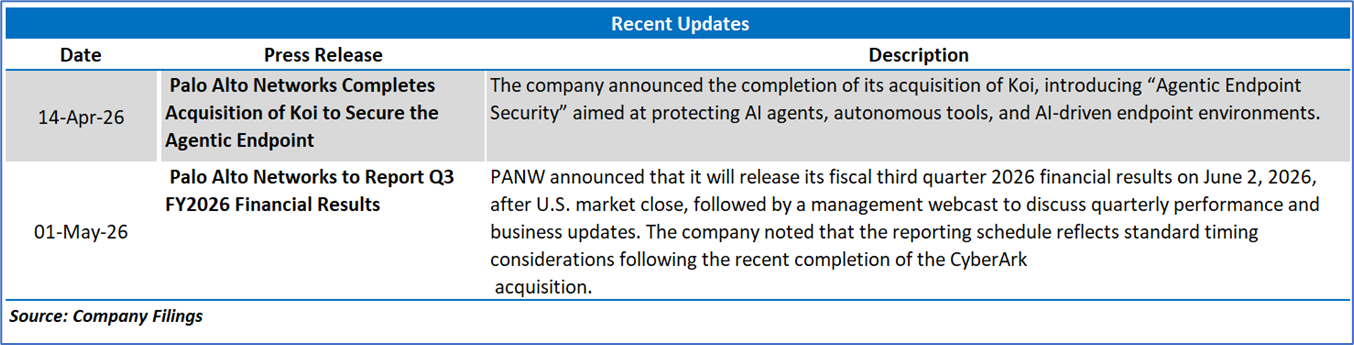
The below picture gives an overview of the recent updates:
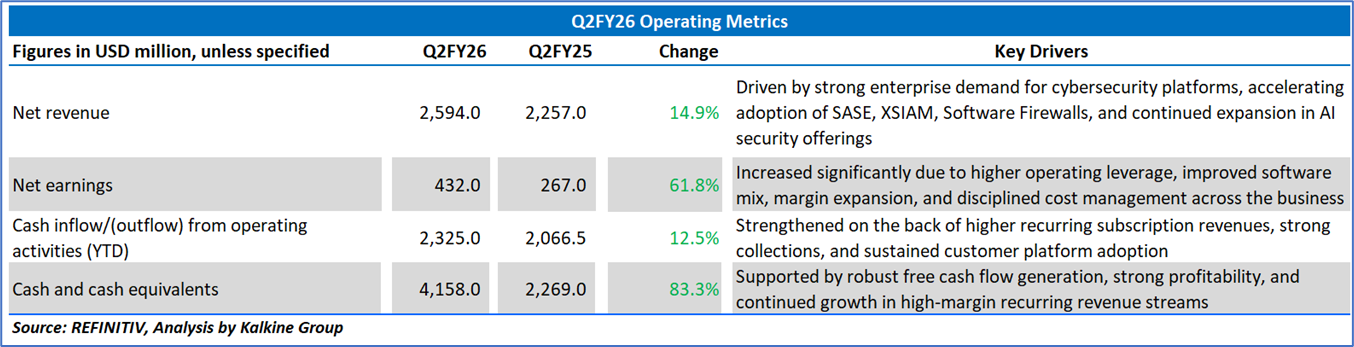
2.2 Insights of Q2FY26:
Section 3: Key Risks and Outlook:
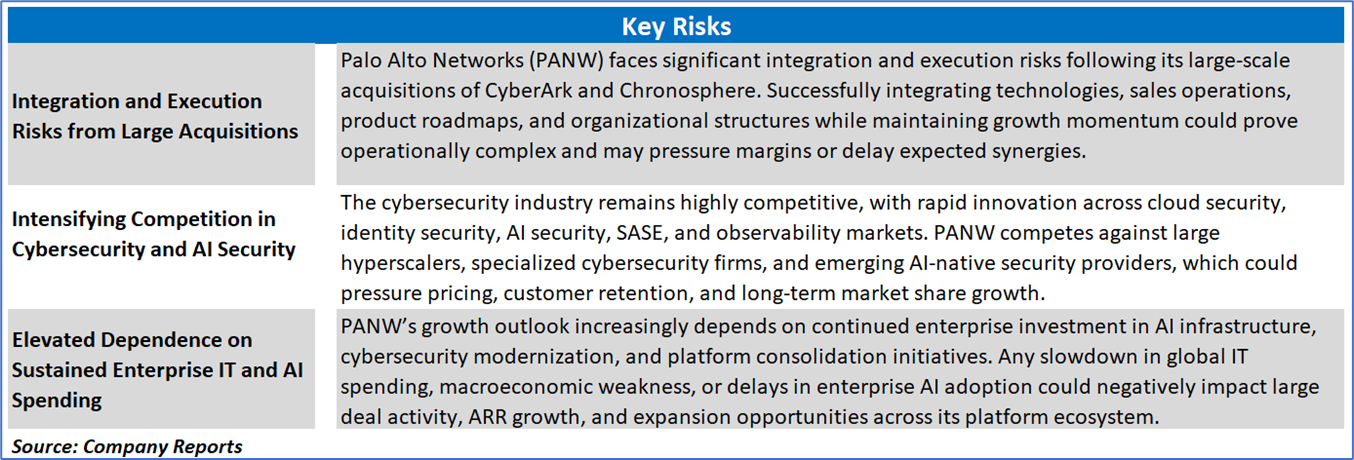
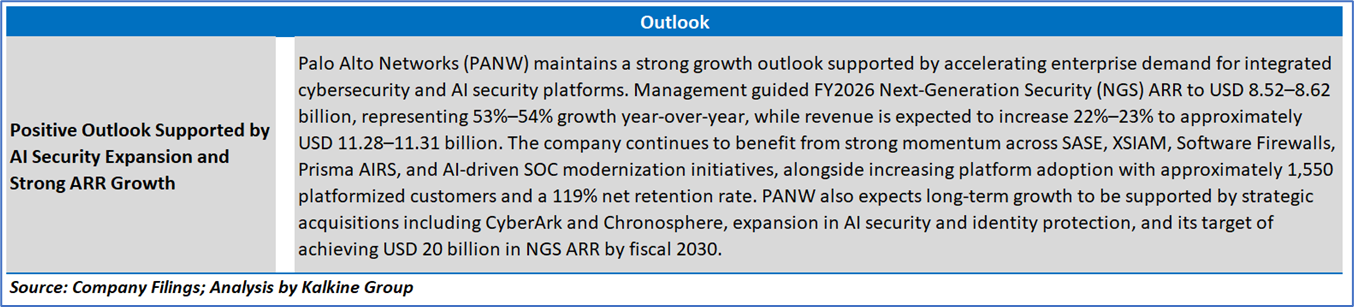
Section 4: Stock Recommendation Summary:
4.1 Technical Summary:
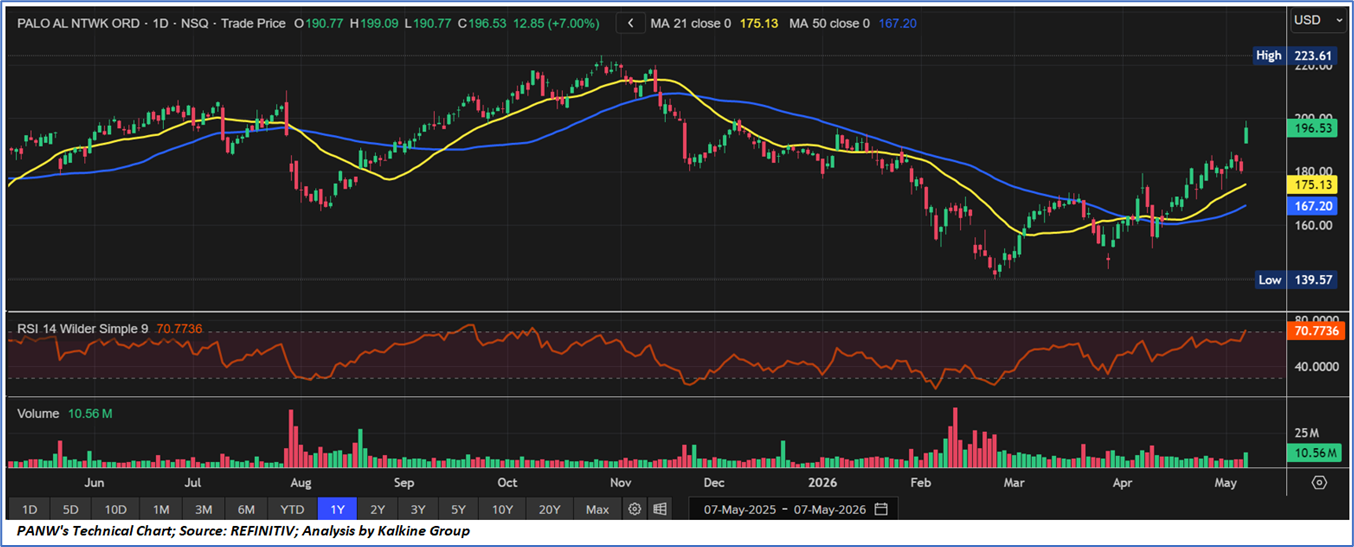
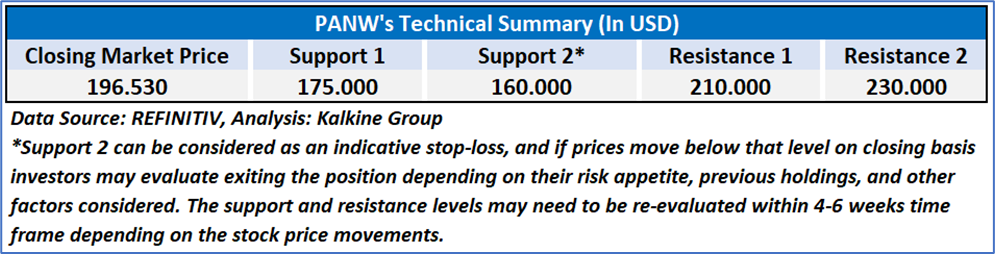
- Strong Bullish Momentum Above Key Moving Averages: Palo Alto Networks (PANW) continues to exhibit strong bullish technical momentum, with the stock trading decisively above both its 21-day moving average of approximately USD 175.13 and 50-day moving average of approximately USD 167.20. The recent breakout toward USD 196.53 indicates strengthening upward price momentum supported by improving trend structure and sustained institutional buying activity. The widening gap between short-term and medium-term moving averages further confirms positive trend continuation and reinforces the ongoing recovery from the February–March correction phase.
- RSI Signals Elevated Momentum with Near-Term Overbought Conditions: The Relative Strength Index (RSI-14) is currently positioned near 70.8, indicating strong buying momentum while simultaneously approaching overbought territory. This suggests that bullish sentiment remains dominant; however, the sharp acceleration in recent sessions could increase the probability of short-term consolidation or mild profit-booking activity near current resistance levels. Despite elevated RSI conditions, the absence of bearish divergence and continued higher-high formation suggests momentum remains structurally supportive for further upside continuation if broader market conditions remain favorable.
- Volume Expansion and Breakout Structure Support Upside Bias: Recent price action reflects a constructive breakout pattern supported by improving trading volumes, indicating stronger market participation during the latest upward move. PANW has successfully reclaimed key resistance zones around USD 180–185, which may now act as an important technical support range during any pullback. The stock is also trading well above its yearly low of approximately USD 139.57 while gradually approaching the prior high zone near USD 223.61, suggesting improving medium-term sentiment. Sustained price stability above the 21-day and 50-day moving averages could support continued upside momentum toward higher resistance levels over the coming quarters.
4.2 Fundamental Valuation
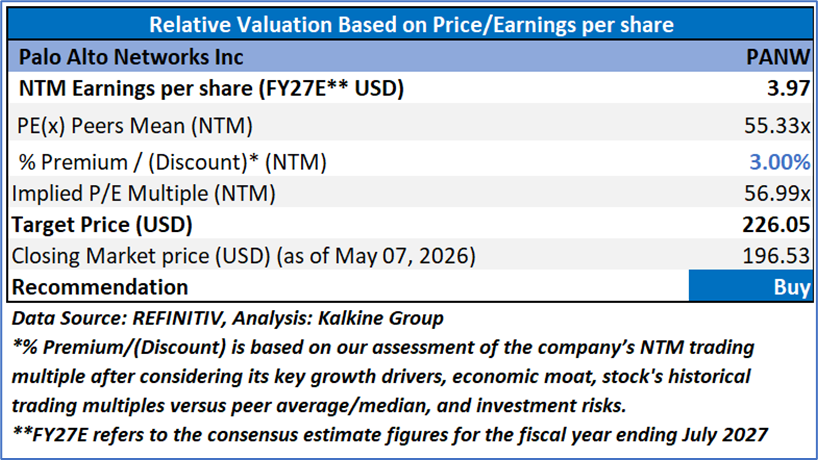
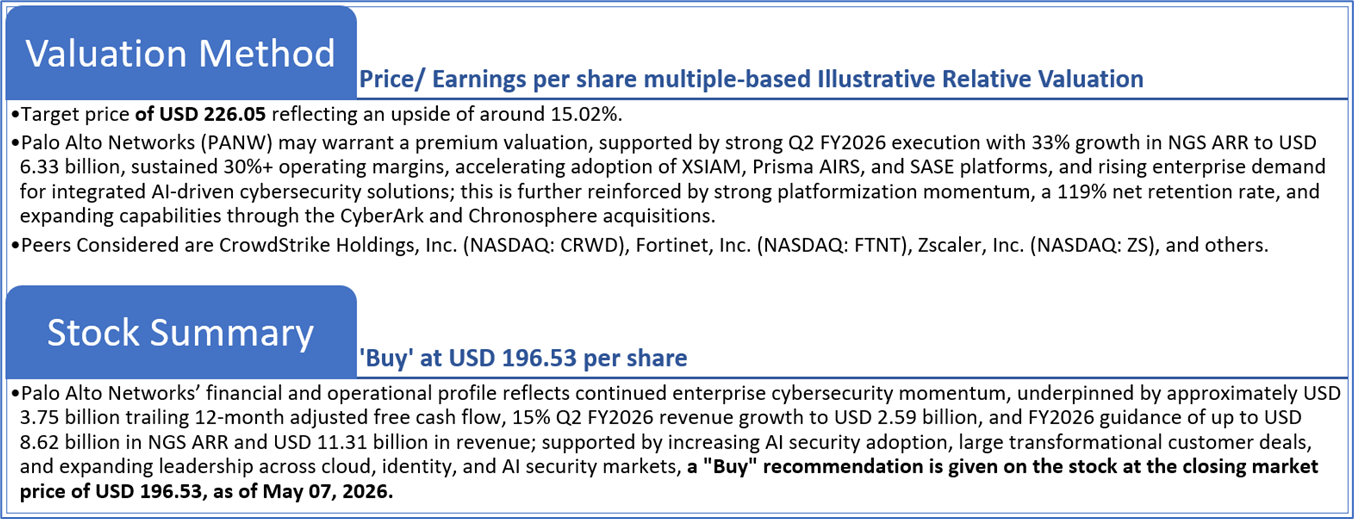
Valuation Methodology: Price/Earnings Per Share Multiple Based Relative Valuation
Markets are trading in a highly volatile zone currently due to certain macroeconomic issues and geopolitical tensions prevailing. Therefore, it is prudent to follow a cautious approach while investing.
Note 1: Past performance is not a reliable indicator of future performance.
Note 2: The reference date for all price data, currency, technical indicators, support, and resistance levels is May 07, 2026. The reference data in this report has been partly sourced from REFINITIV.
Note 3: Investment decisions should be made depending on an individual's appetite for upside potential, risks, holding duration, and any previous holdings. An 'Exit' from the stock can be considered if the Target Price mentioned as per the Valuation and or the technical levels provided have been achieved and is subject to the factors discussed above.
Note 4: The report publishing date is as per the Pacific Time Zone.
Technical Indicators Defined: -
Support: A level at which the stock prices tend to find support if they are falling, and a downtrend may take a pause backed by demand or buying interest. Support 1 refers to the nearby support level for the stock and if the price breaches the level, then Support 2 may act as the crucial support level for the stock.
Resistance: A level at which the stock prices tend to find resistance when they are rising, and an uptrend may take a pause due to profit booking or selling interest. Resistance 1 refers to the nearby resistance level for the stock and if the price surpasses the level, then Resistance 2 may act as the crucial resistance level for the stock.
Stop-loss: It is a level to protect against further losses in case of unfavorable movement in the stock prices.
Past performance is not a reliable indicator of future performance.

 NZ
 UK
 US
 AU
 IND

 CA

 Please wait processing your request...