Section 1: Company Overview, Shariah Compliance Standards and Fundamentals
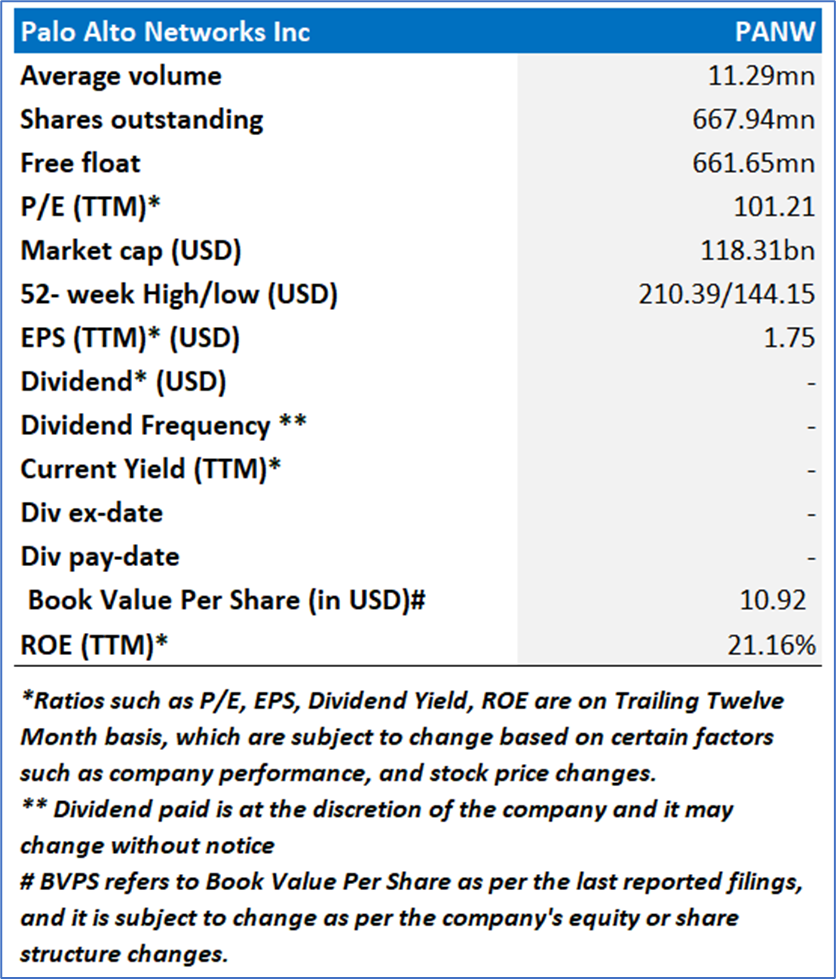
Section 1.1: Palo Alto Networks, Inc. (NASDAQ: PANW) provides comprehensive artificial intelligence (AI)-powered security solutions across network, cloud, security operations and AI. The Company focuses on four areas: Network Security, Cloud Security, Security Operations and Threat Intelligence and Advisory Services (Unit 42).
Kalkine’s ‘The Shariah Compliance Report’ covers the Investment Highlights, Shariah-compliance standards, Key Financial Metrics, Risks, and Technical Analysis along with the Valuation, Target Price, and Recommendation on the stock.
Section 1.2: What are the Key Metrics for Shariah Compliance to be Considered?
The Shariah Compliance Report aims to identify equities that align with Shariah and ethical principles, providing valuable insights on financial metrics, business activities and compliance with Islamic finance norms.
Key Shariah Screening Criteria and Thresholds
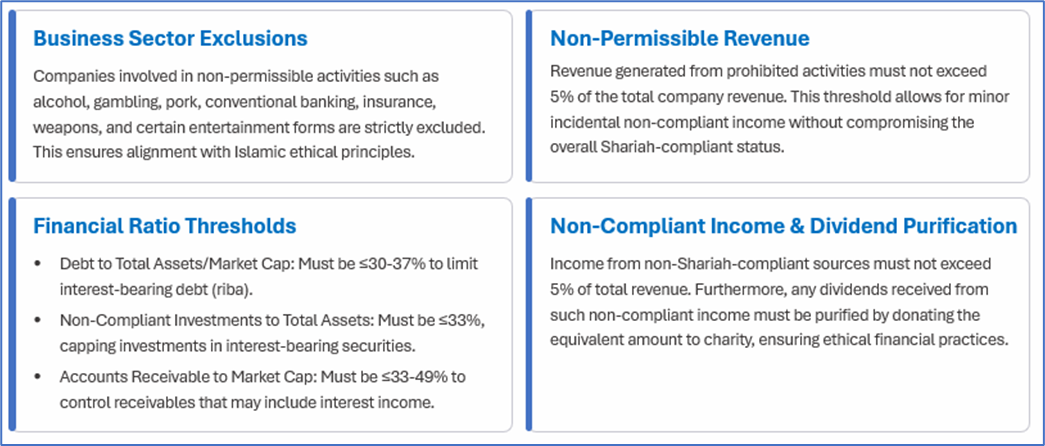
Shariah Metrics for Palo Alto Networks Inc (NASDAQ: PANW):
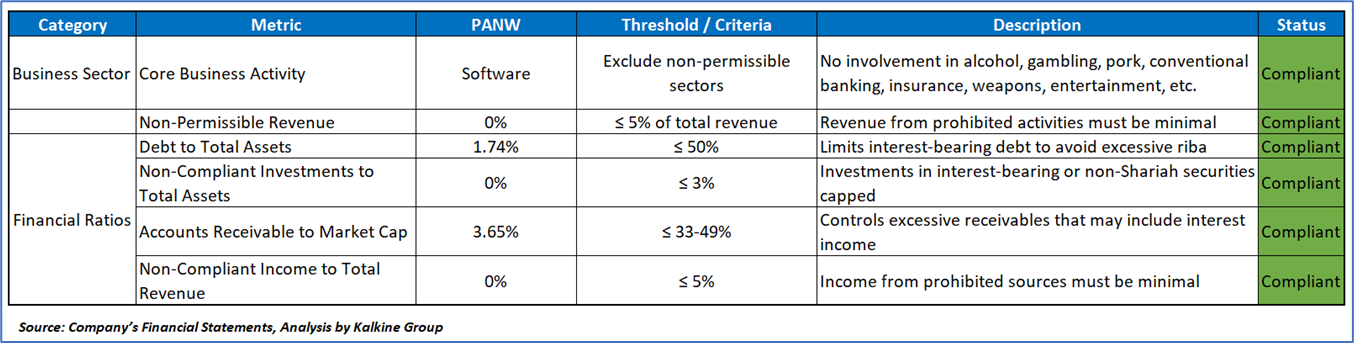
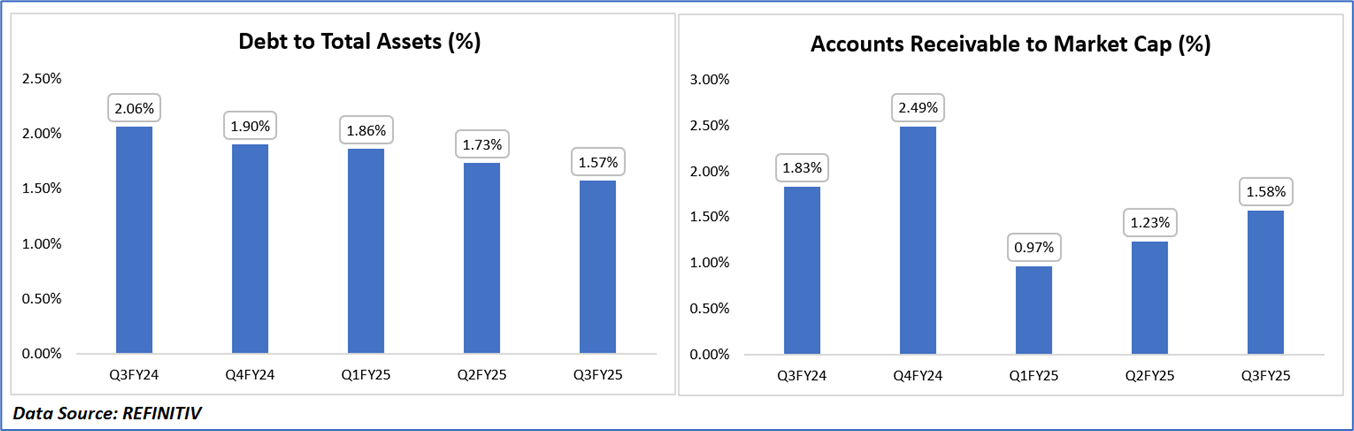
Revenue Segmentation of PANW in Q3FY25 & Historical Compliance of Financial Ratios:

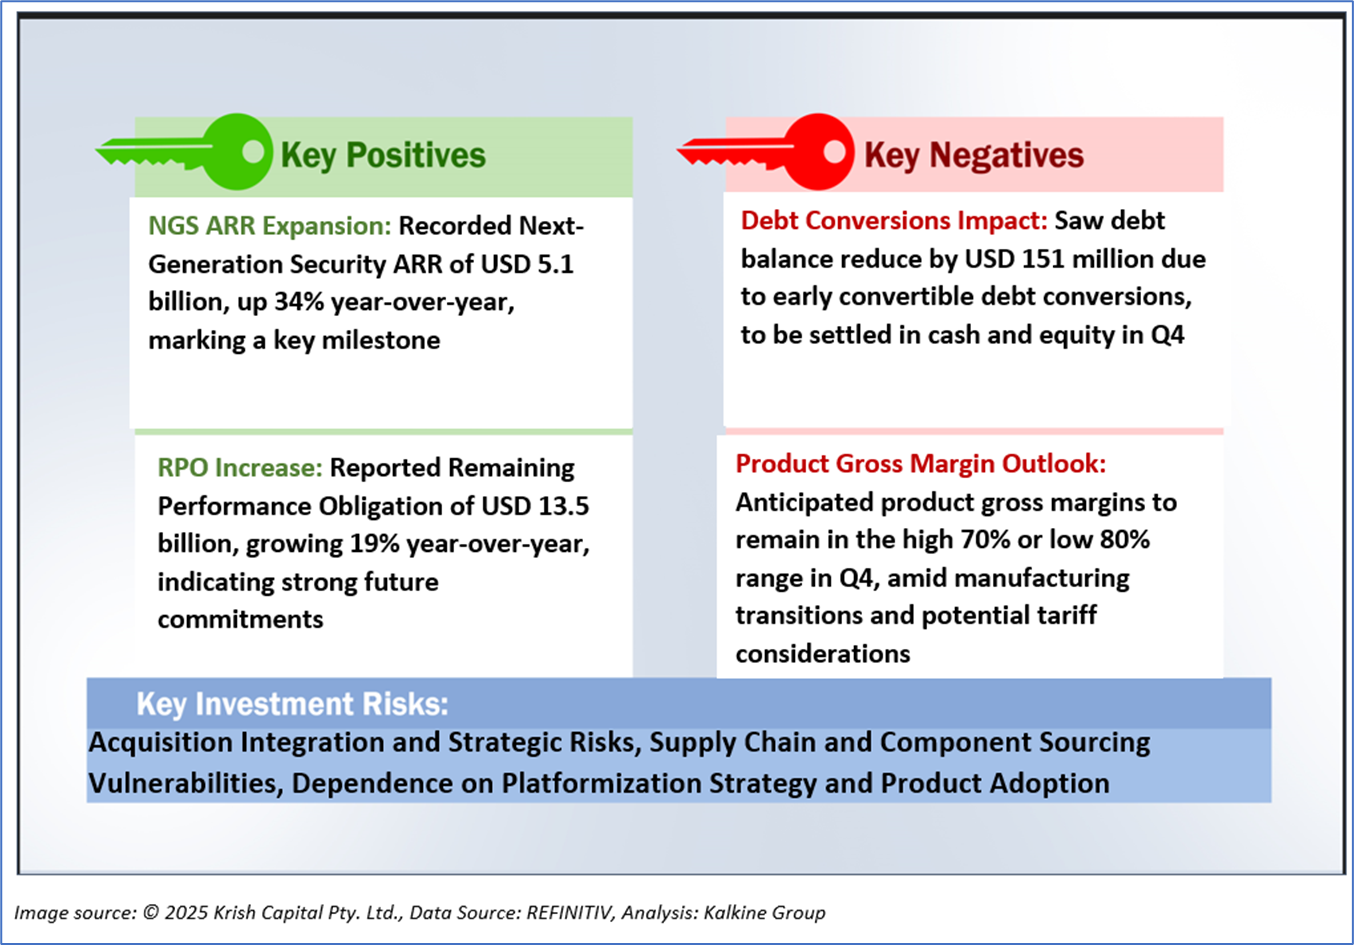
1.3 The Key Positives, Negatives, and Investment summary
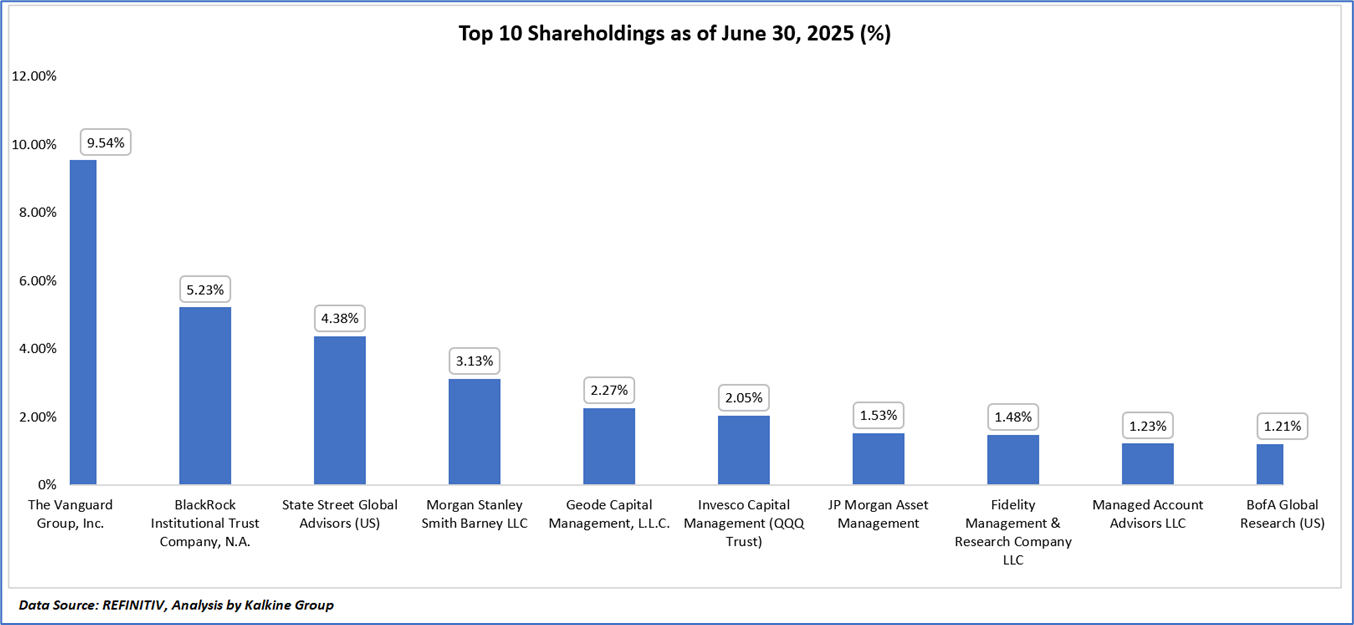
1.4 Top 10 shareholders:
The top 10 shareholders together form ~32.06% of the total shareholding, signifying concentrated shareholding. The Vanguard Group, Inc., and BlackRock Institutional Trust Company, N.A. are the biggest shareholders, holding the maximum stake in the company at ~9.54% and ~5.23%, respectively.
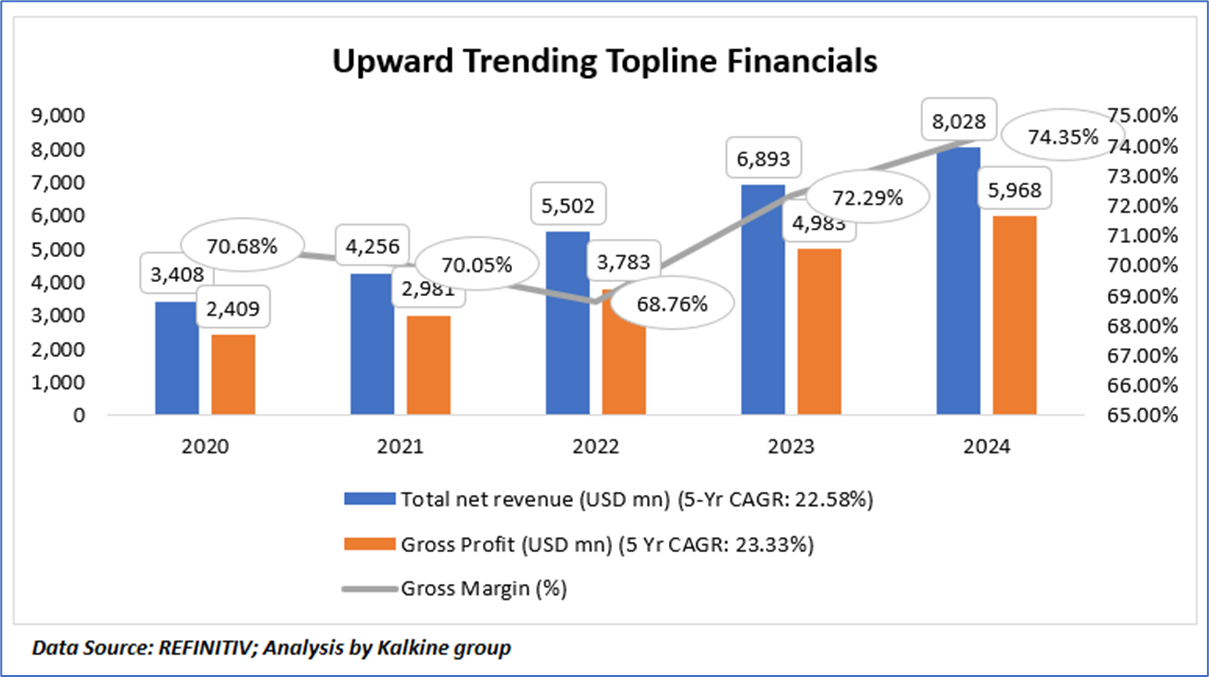
1.5 Key Metrics:
Palo Alto Networks, Inc. exhibited robust financial growth from fiscal year 2020 to 2024, with total net revenue escalating from USD 3,408 million to USD 8,028 million, achieving a commendable five-year annual growth rate (CAGR) of 22.58%, driven by expanding demand for its cybersecurity solutions amid rising digital threats and AI adoption. Concurrently, gross profit advanced from USD 2,409 million to USD 5,968 million, registering a slightly higher CAGR of 23.33%, indicative of enhanced operational efficiencies and favorable product mix shifts toward higher-margin subscription and software-based offerings. Gross margin, while experiencing a minor dip from 70.68% in 2020 to 68.76% in 2022—potentially attributable to increased costs from supply chain pressures or investments in innovations subsequently rebounded to 74.35% by 2024, underscoring the company's successful Platformization strategy and scale advantages that bolster profitability resilience in a competitive landscape.
Section 2: Business Updates and Financial Highlights
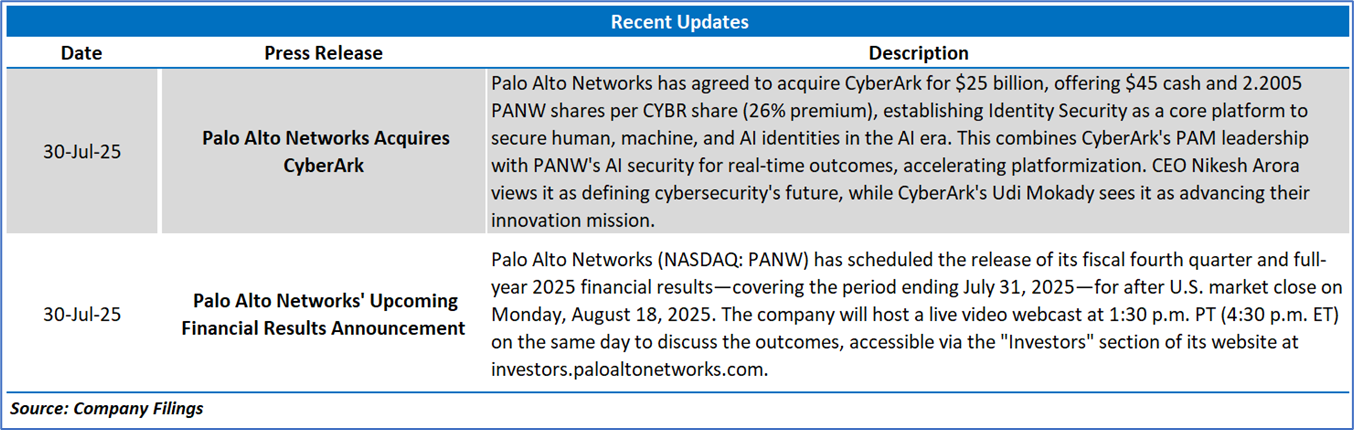
2.1 Recent Updates:
The below picture gives an overview of the recent updates:
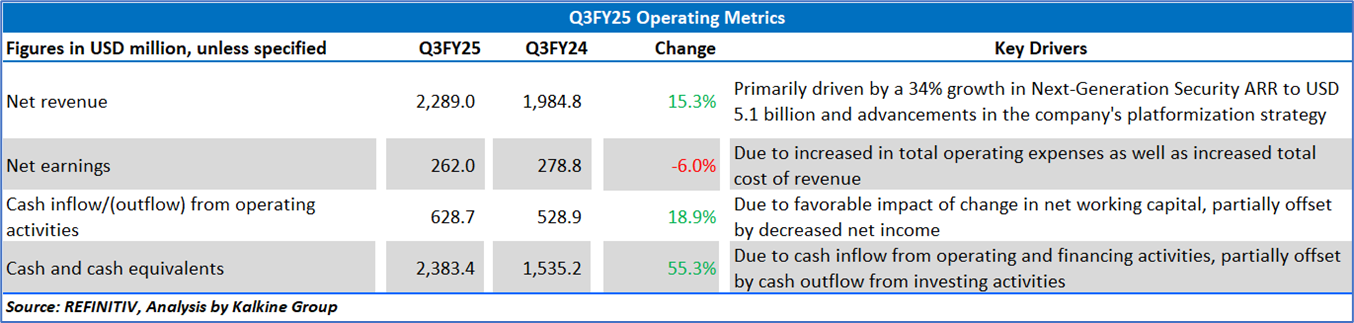
2.2 Insights of Q3FY25:
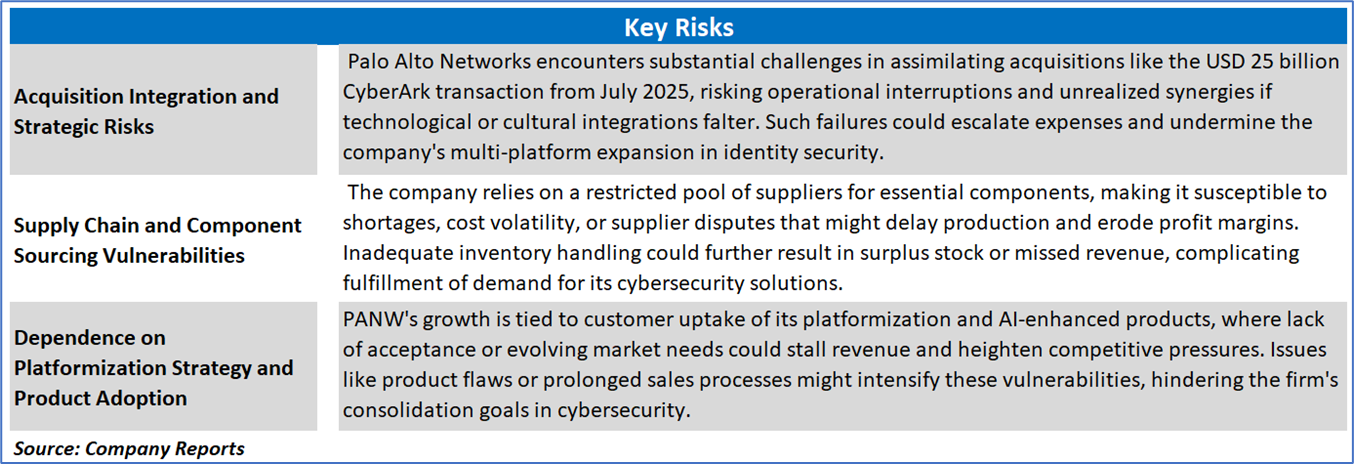
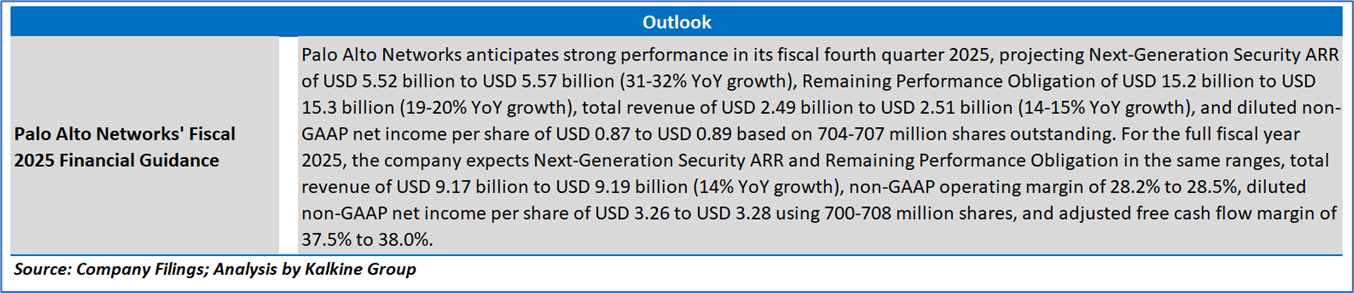
Section 3: Key Risks and Outlook:
Section 4: Stock Recommendation Summary:
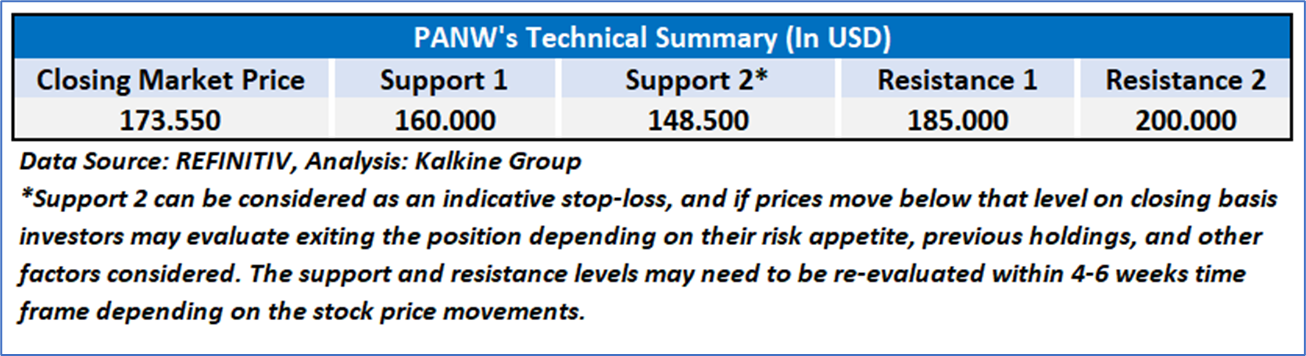
4.1 Technical Summary:
Price Performance:
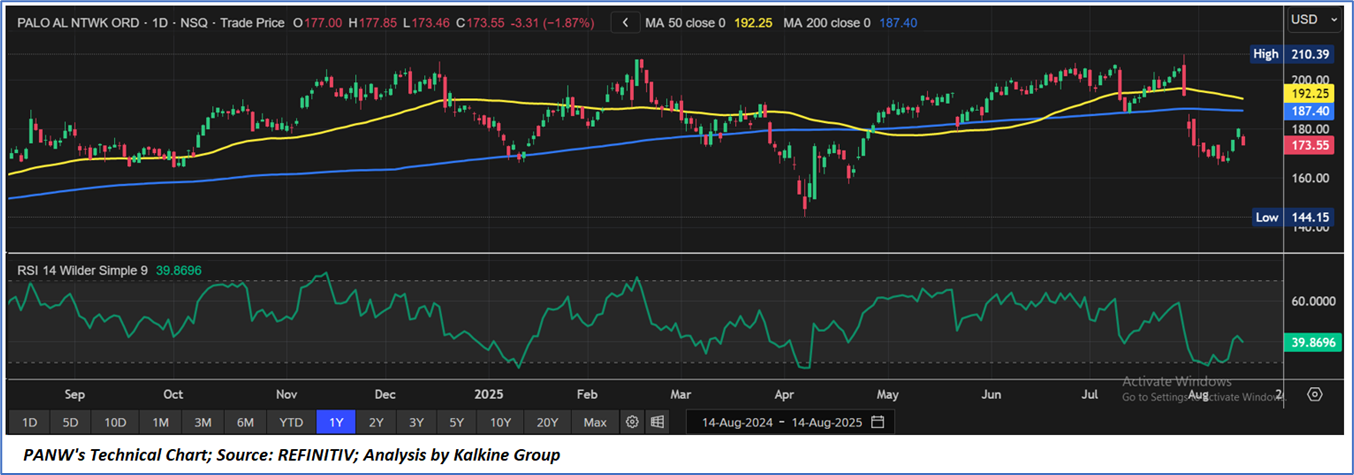
- PANW's share price has corrected by approx. 10.03% in the past three months. Similarly, in the long term, stock has corrected by 14.03% over the past six months.
- The stock is leaning towards the upper band of its 52-week range of USD 210.39 and 52-week low price of USD 144.15, with the current price near an important support area of USD 160.00-USD 170.00, therefore an expectation of upward movement if the levels sustain.
- The price is currently below both its short-term (50-day) SMA and long-term (200-day) SMA, with the current RSI of 39.87, recovering from oversold levels, with expectations of upward movement if the above-mentioned support sustains.
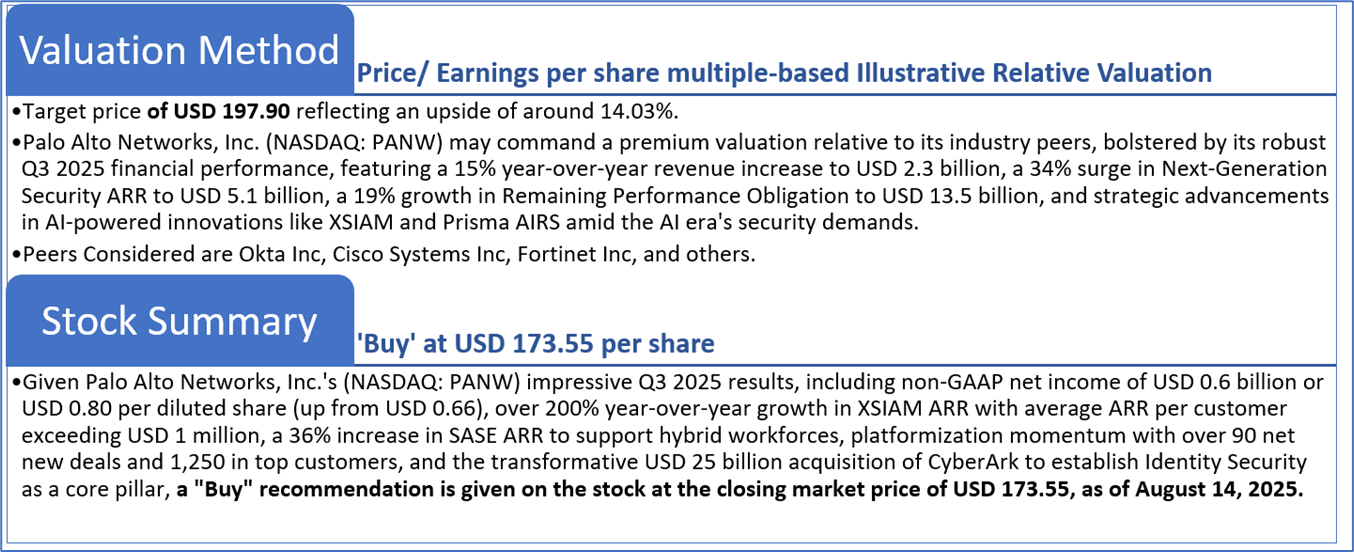
4.2 Fundamental Valuation
Valuation Methodology: Price/Earnings Per Share Multiple Based Relative Valuation

Markets are trading in a highly volatile zone currently due to certain macroeconomic issues and geopolitical tensions prevailing. Therefore, it is prudent to follow a cautious approach while investing.
Note 1: Past performance is not a reliable indicator of future performance.
Note 2: The reference date for all price data, currency, technical indicators, support, and resistance levels is August 14, 2025. The reference data in this report has been partly sourced from REFINITIV.
Note 3: Investment decisions should be made depending on an individual's appetite for upside potential, risks, holding duration, and any previous holdings. An 'Exit' from the stock can be considered if the Target Price mentioned as per the Valuation and or the technical levels provided have been achieved and is subject to the factors discussed above.
Note 4: The report publishing date is as per the Pacific Time Zone.
Technical Indicators Defined: -
Support: A level at which the stock prices tend to find support if they are falling, and a downtrend may take a pause backed by demand or buying interest. Support 1 refers to the nearby support level for the stock and if the price breaches the level, then Support 2 may act as the crucial support level for the stock.
Resistance: A level at which the stock prices tend to find resistance when they are rising, and an uptrend may take a pause due to profit booking or selling interest. Resistance 1 refers to the nearby resistance level for the stock and if the price surpasses the level, then Resistance 2 may act as the crucial resistance level for the stock.
Stop-loss: It is a level to protect against further losses in case of unfavorable movement in the stock prices.
Past performance is not a reliable indicator of future performance.

 Please wait processing your request...