Section 1: Company Fundamentals
Company Overview and Performance summary
Company Overview:
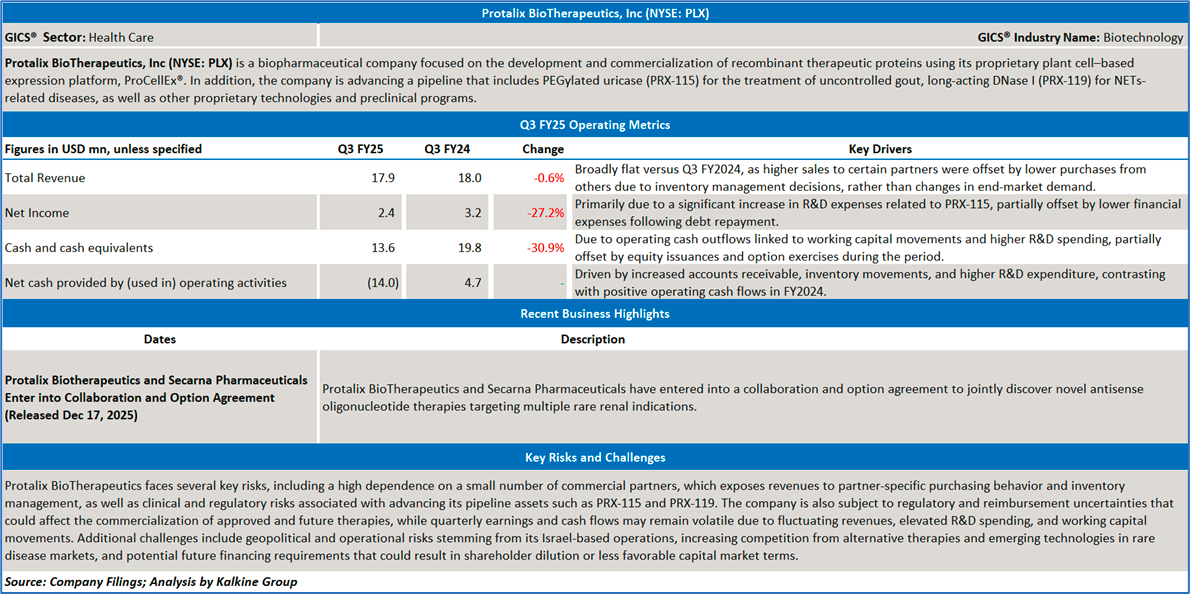
Protalix BioTherapeutics, Inc (NYSE: PLX) is a biopharmaceutical company focused on the development and commercialization of recombinant therapeutic proteins using its proprietary plant cell–based expression platform, ProCellEx®. In addition, the company is advancing a pipeline that includes PEGylated uricase (PRX-115) for the treatment of uncontrolled gout, long-acting DNase I (PRX-119) for NETs-related diseases, as well as other proprietary technologies and preclinical programs.
This US Inflation Report covers the Company Overview & Price performance, Summary table, Key positives & negatives, Key metrics, Company details, technical guidance & Stock recommendation, and Price chart.
Price Performance:
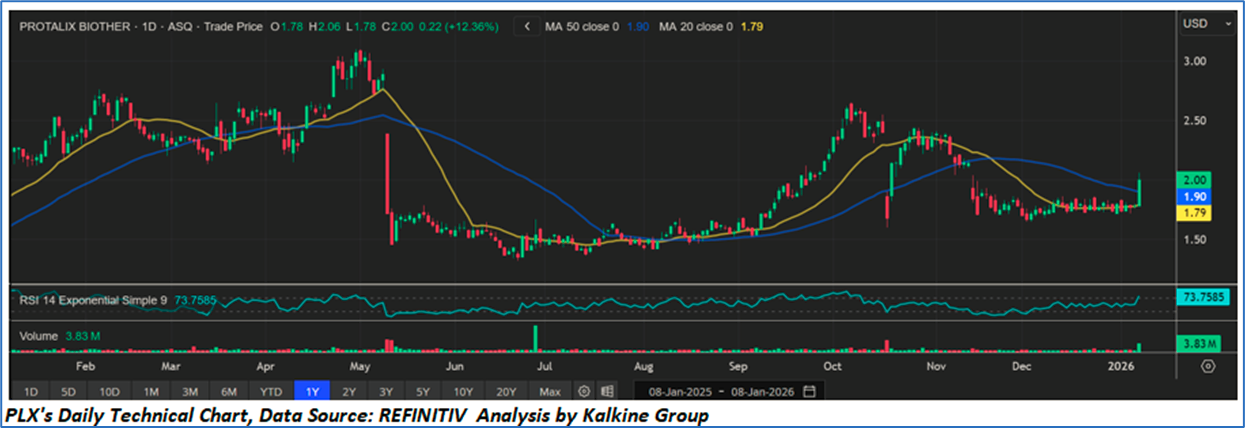
- The stock has transitioned from a prolonged consolidation phase into a renewed short-term uptrend. After forming a base around the USD 1.50–1.60 zone, price action has recently pushed higher, indicating improving momentum.
- The price is trading above both the 20-day MA (USD 1.79) and the 50-day MA (USD 1.90), with the shorter-term average turning upward. This configuration suggests a near-term bullish bias, though the 50-day MA may still act as an intermediate resistance/support pivot.
- The RSI (~74) is in overbought territory, reflecting strong buying pressure. While this confirms momentum strength, it also raises the probability of short-term consolidation or a mild pullback before further upside.
- olume has expanded on the recent upward move, lending credibility to the price advance and suggesting accumulation rather than a low-liquidity spike.
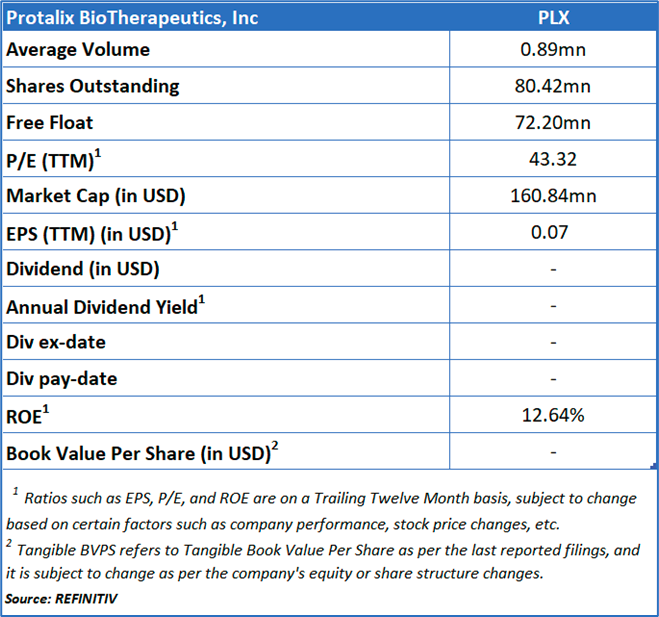
1.2 Summary Table
1.3 The Key Positives & Negatives
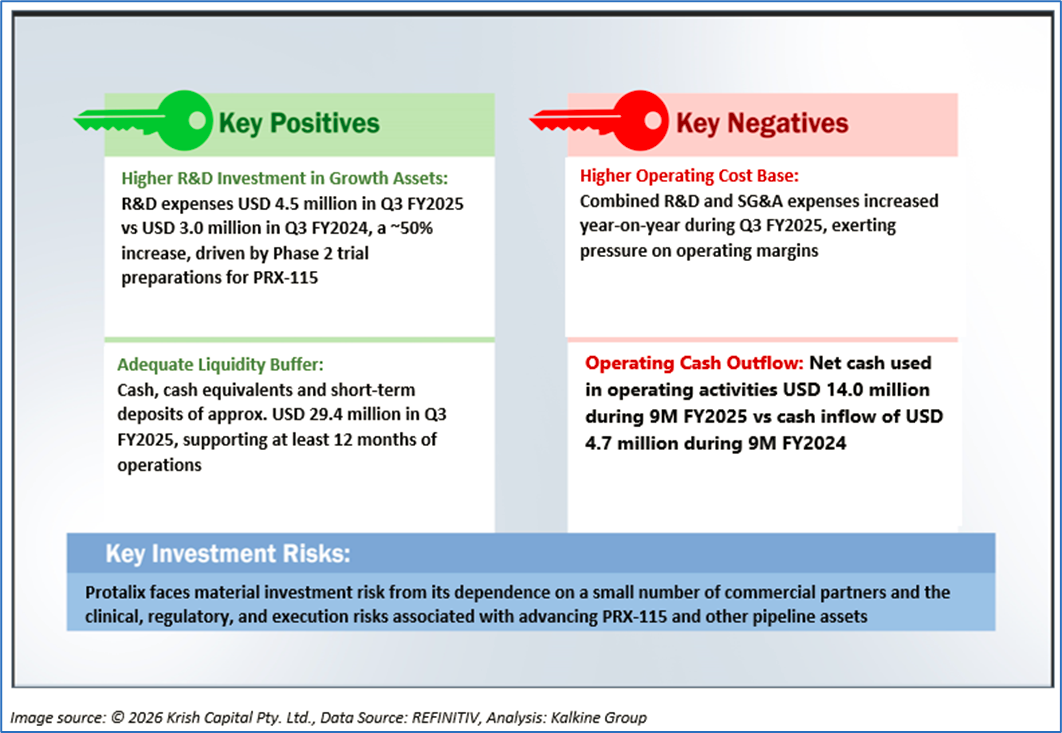
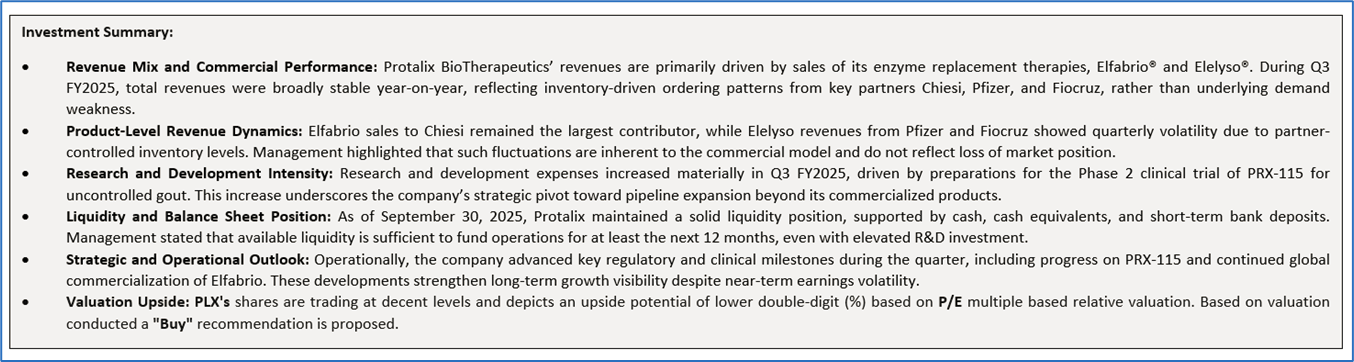
1.4 Key Metrics
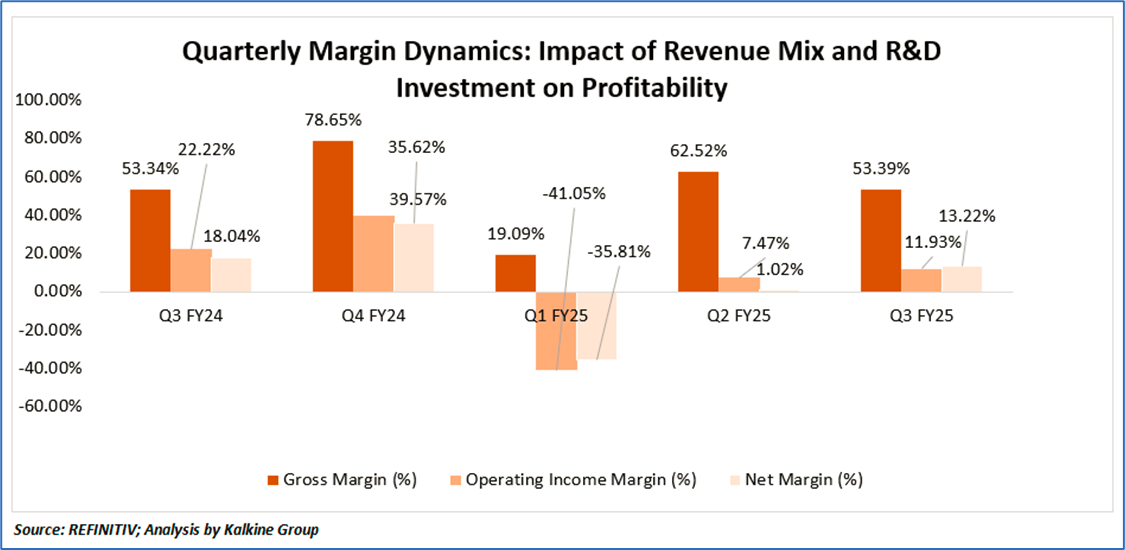
The margin trends reflect a business with structurally strong gross profitability but quarterly volatility at the operating and net levels driven by timing and investment factors. Gross margins remained robust across periods due to the high-margin enzyme replacement therapy portfolio and the efficiency of the ProCellEx® platform, with peaks in Q4 FY24 and Q2 FY25 supported by a favorable product mix and higher partner purchases, while softer quarters reflect inventory normalization by partners rather than pricing pressure. The sharp compression in operating and net margins in Q1 FY25 was primarily due to a significant increase in R&D spending linked to preparations for the Phase 2 PRX-115 trial, combined with comparatively lower revenues. The subsequent recovery in Q2 FY25 and Q3 FY25 was aided by revenue normalization, continued SG&A discipline, lower financing costs following debt repayment, and supportive tax effects, highlighting earnings volatility driven by strategic investment and timing rather than structural weakness.
Section 2: Protalix BioTherapeutics, Inc (NYSE: PLX) (“Buy” at the closing market price of USD 2.00, as of Jan 08,2026)
2.1 Company Details
2.2 Technical Guidance and Stock Recommendation
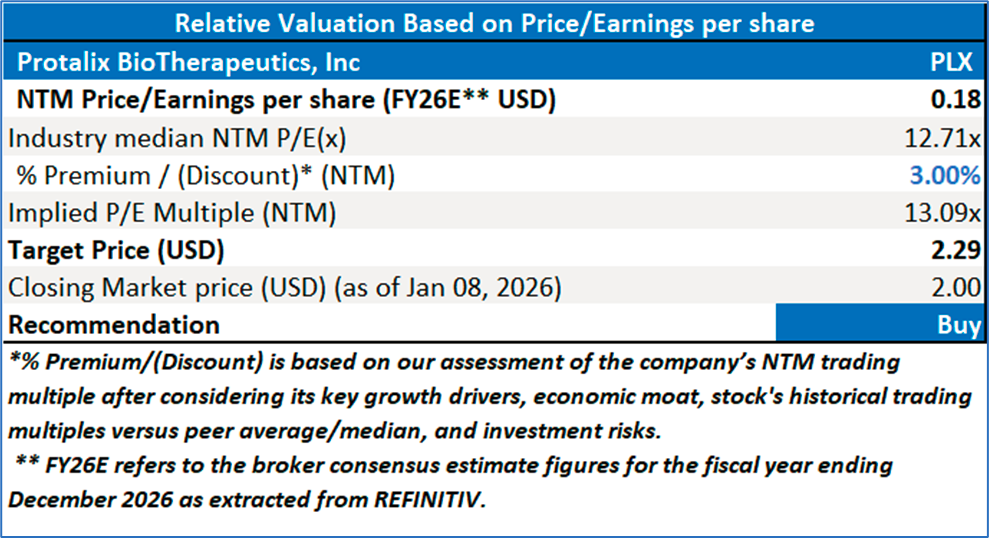
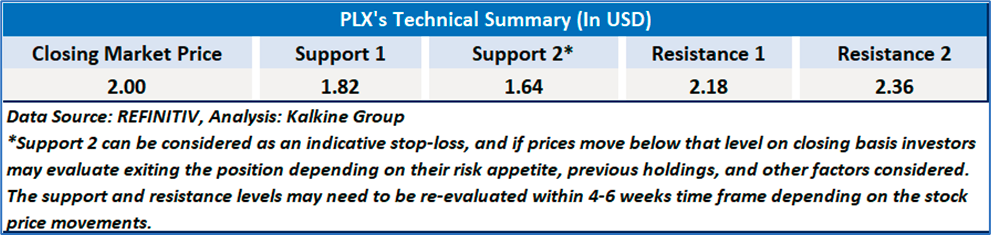
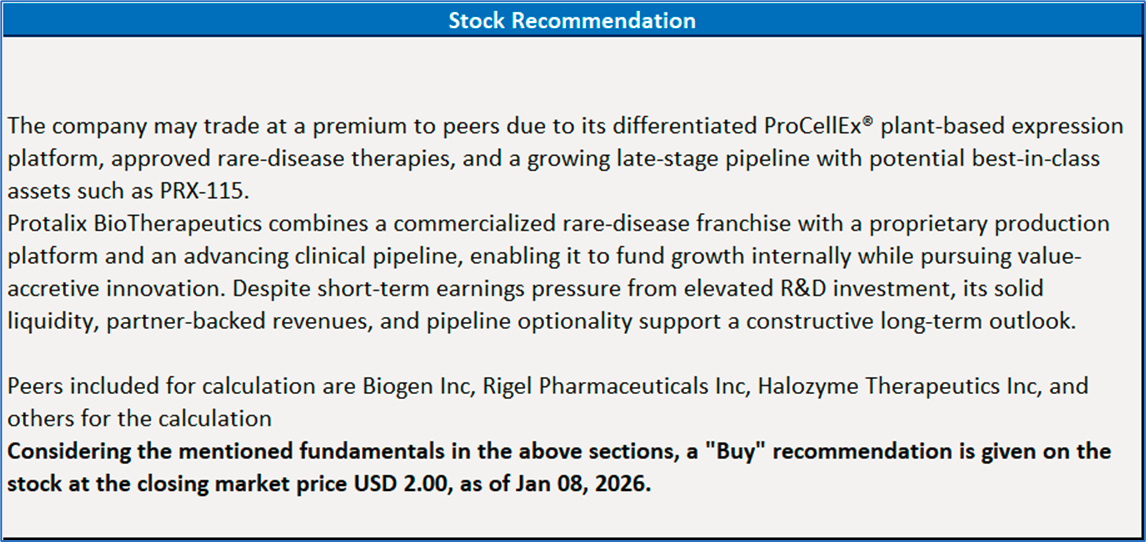
Markets are trading in a highly volatile zone currently due to certain macroeconomic issues and geopolitical tensions prevailing. Therefore, it is prudent to follow a cautious approach while investing.
Note 1: Past performance is not a reliable indicator of future performance.
Note 2: The reference date for all price data, currency, technical indicators, support, and resistance levels is Jan 08, 2026. The reference data in this report has been partly sourced from REFINITIV.
Note 3: Investment decisions should be made depending on an individual's appetite for upside potential, risks, holding duration, and any previous holdings. An 'Exit' from the stock can be considered if the Target Price mentioned as per the Valuation and or the technical levels provided has been achieved and is subject to the factors discussed above.
Note 4: The report publishing date is as per the Pacific Time Zone.
Technical Indicators Defined: -
Support: A level at which the stock prices tend to find support if they are falling, and a downtrend may take a pause backed by demand or buying interest. Support 1 refers to the nearby support level for the stock and if the price breaches the level, then Support 2 may act as the crucial support level for the stock.
Resistance: A level at which the stocks prices tend to find resistance when they are rising, and an uptrend may take a pause due to profit booking or selling interest. Resistance 1 refers to the nearby resistance level for the stock and if the price surpasses the level, then Resistance 2 may act as the crucial resistance level for the stock.
Stop-loss: It is a level to protect against further losses in case of unfavorable movement in the stock prices.
Past performance is not a reliable indicator of future performance.

 NZ
 UK
 US
 AU
 IND

 CA

 Please wait processing your request...