Section 1: Introduction
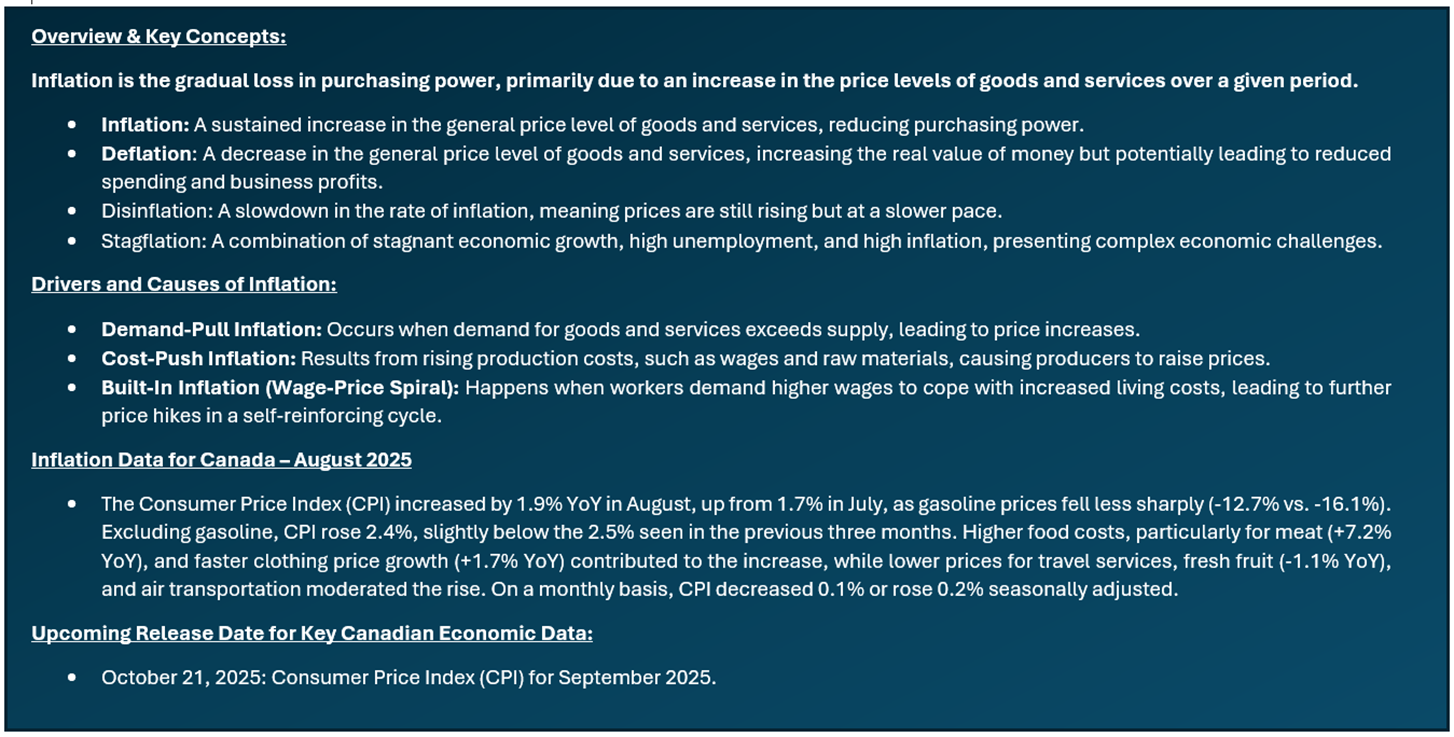
Inflation Report Coverage:
- Inflation report highlights how inflation impacts sectors differently, favouring value and defensive sectors like Energy, Materials, Consumer Staples, Healthcare, Utilities, select Financials, and REITs with inflation-indexed leases, while rate-sensitive sectors like Consumer Discretionary and high-growth Tech typically underperform.
- The report focuses on companies with proven business models, steady financials, high free cash flow, and solid ROE that can pass on costs to customers and protect margins. The aim is to identify stocks that can outperform inflation via capital gains and dividends, supporting diversified sectoral exposure.
Stocks Covered:
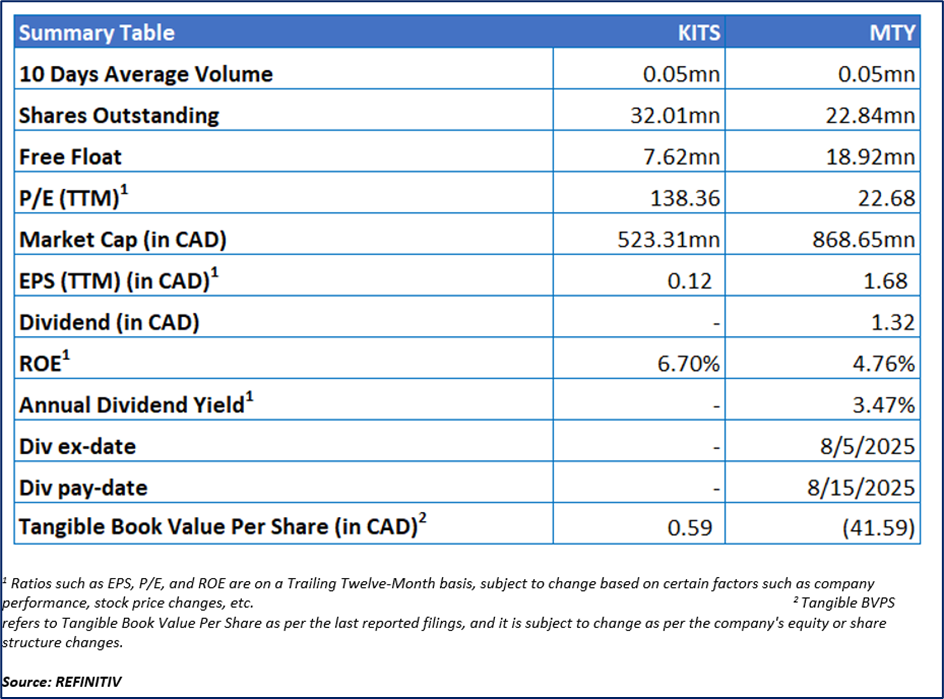
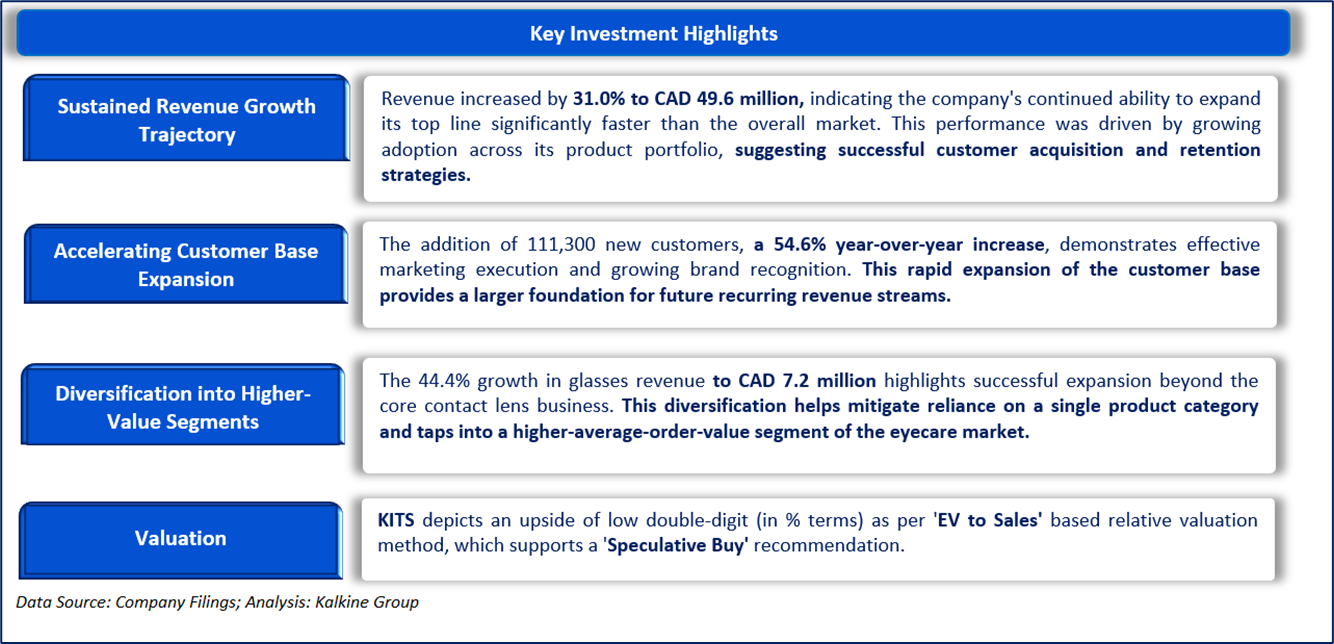
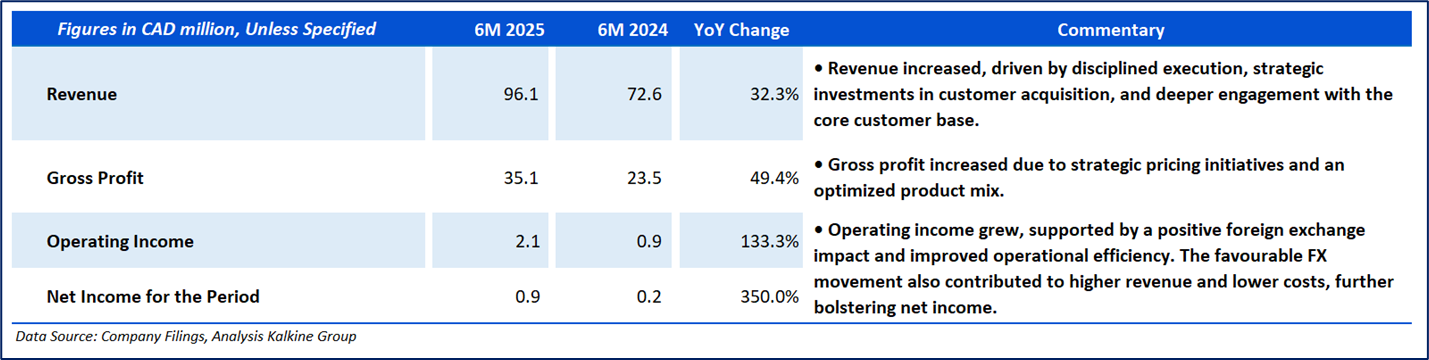
- Kits Eyecare Ltd. (TSX: KITS) reported decent 6M 2025 results, featuring a 32.4% revenue increase and a 350% surge in net income. This profitability supports shareholder returns via dividends and buybacks. The company's unique multinational model, integration synergies, and reaffirmed guidance underpin its path for sustainable growth.
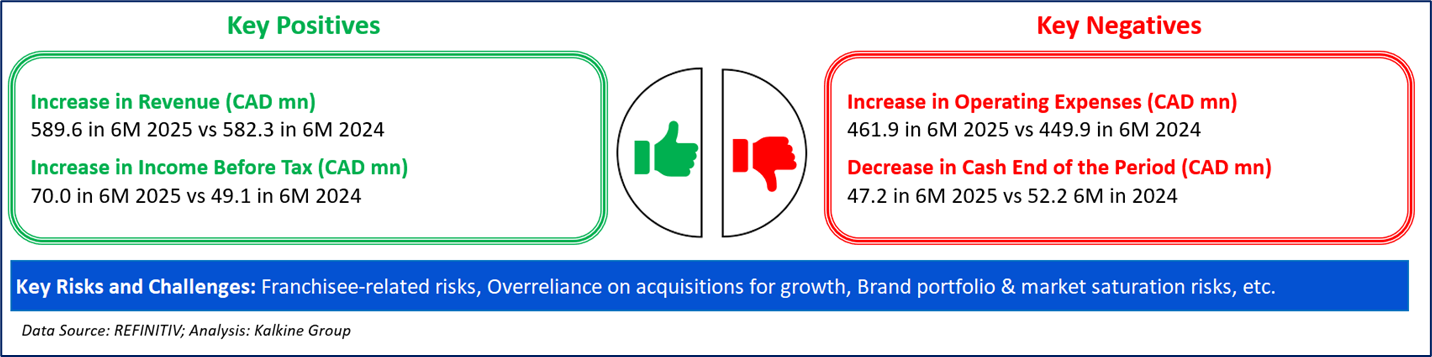
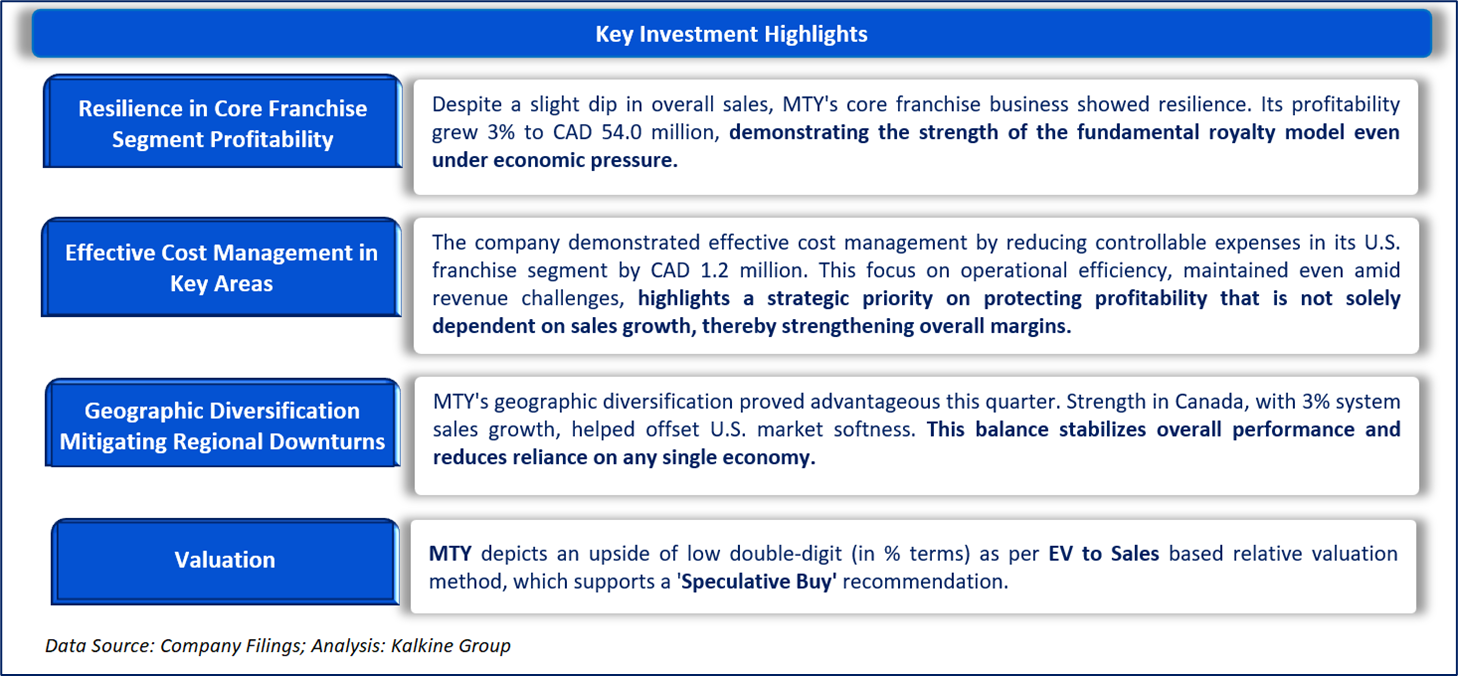
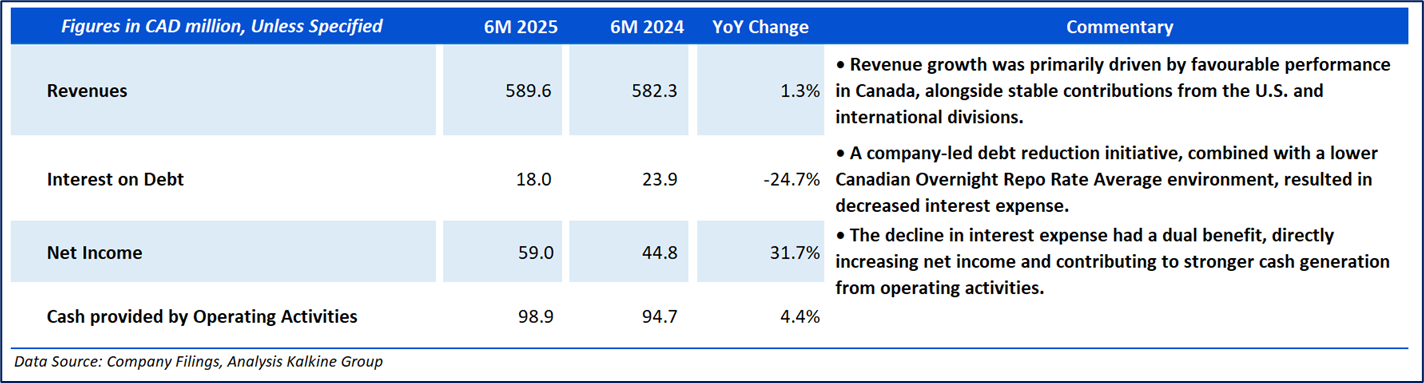
- MTY Food Group Inc. (TSX: MTY) reported decent 6M 2025 results, achieving sales over CAD 500 million and Net Income of nearly CAD 98.9 million. The company demonstrated resilience and effective cost control in the face of ongoing inflationary pressures.
Section 2: Company Overview
Kits Eyecare Ltd. (TSX: KITS) is an online retailer of contact lenses and eyewear. The company's contact lens partners include Acuvue, Alcon, Bausch & Lomb, Biofinity, CooperVision, and Dailies, and glasses partners include Oakley, Prive Revaux, Ray-Ban, and Tom Ford, which enables us to offer our customers best-in-class brands and products in eye care.
Kalkine’s Inflation Report covers the Investment Highlights, Key Financial Metrics, Risks, Technical Analysis along with the Valuation, Target Price, and Recommendation on the stock.

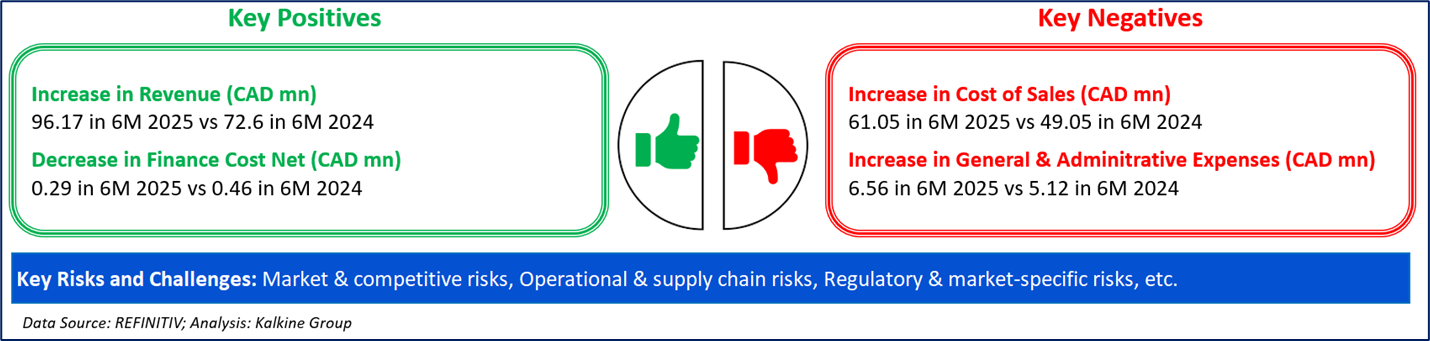
Section3: Financial Highlights

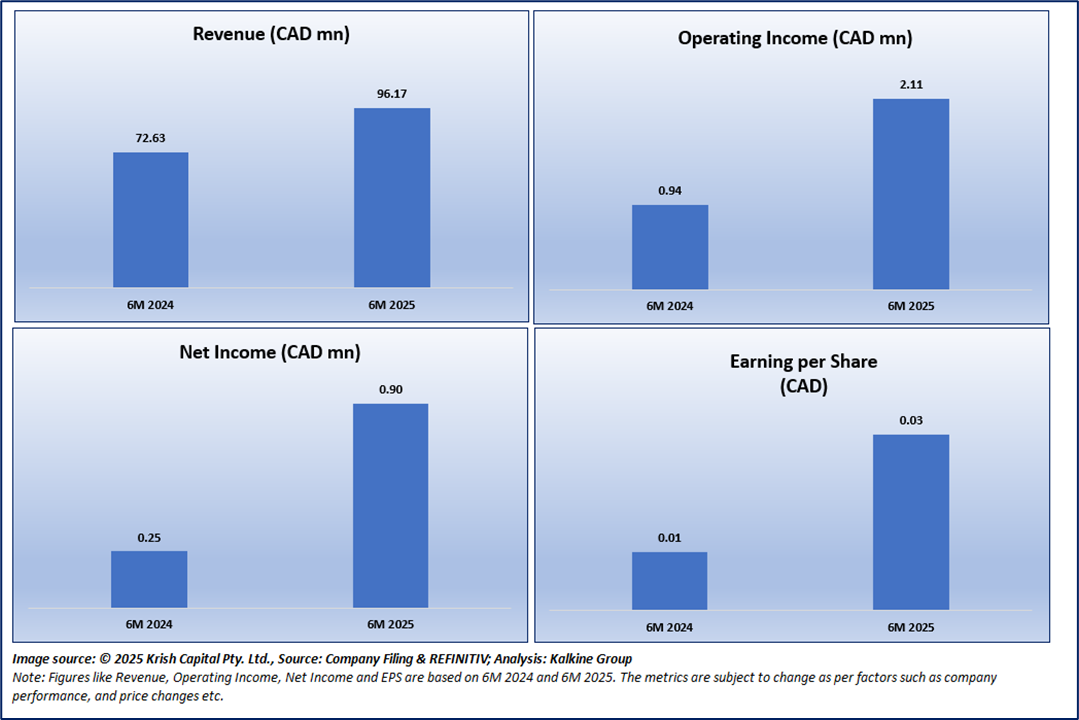
Section 4: Key Metrics
Below chart depicts the change in Revenues, Operating Income, Net Income, Earning per share and of the Company for 6M 2024 and 6M 2025.
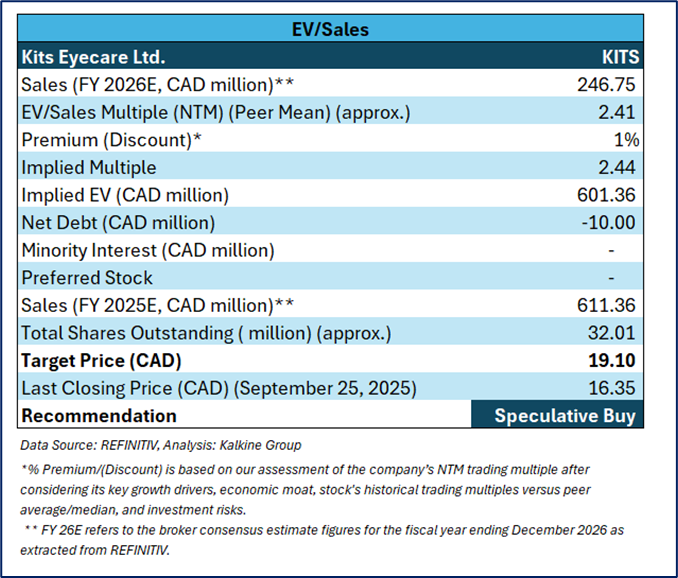
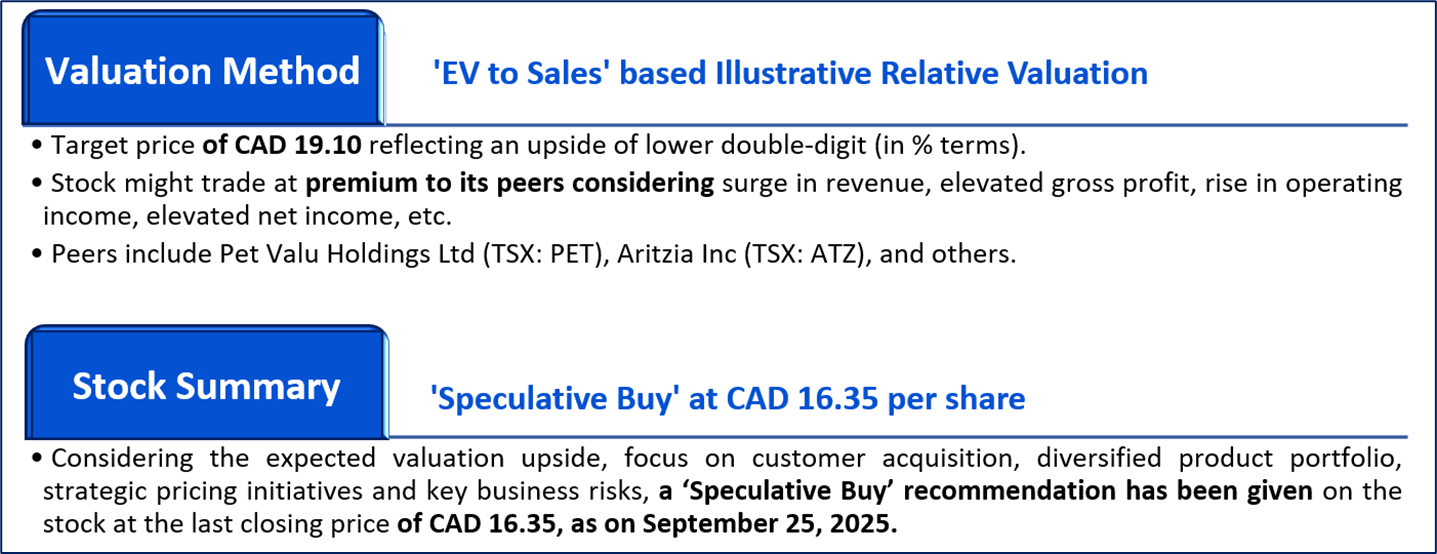
Section 5: Stock Recommendation Summary

Valuation Methodology: EV to Sales Multiple Based Relative Valuation (Illustrative):


The stock has witnessed an upside of ~3.08% and of ~17.28% over the last 1 week and 3 months respectively. Moreover, it is trading above the average 52-week high price of CAD 17.71 and 52-week low price of CAD 7.13, providing an opportunity to ride the trend.

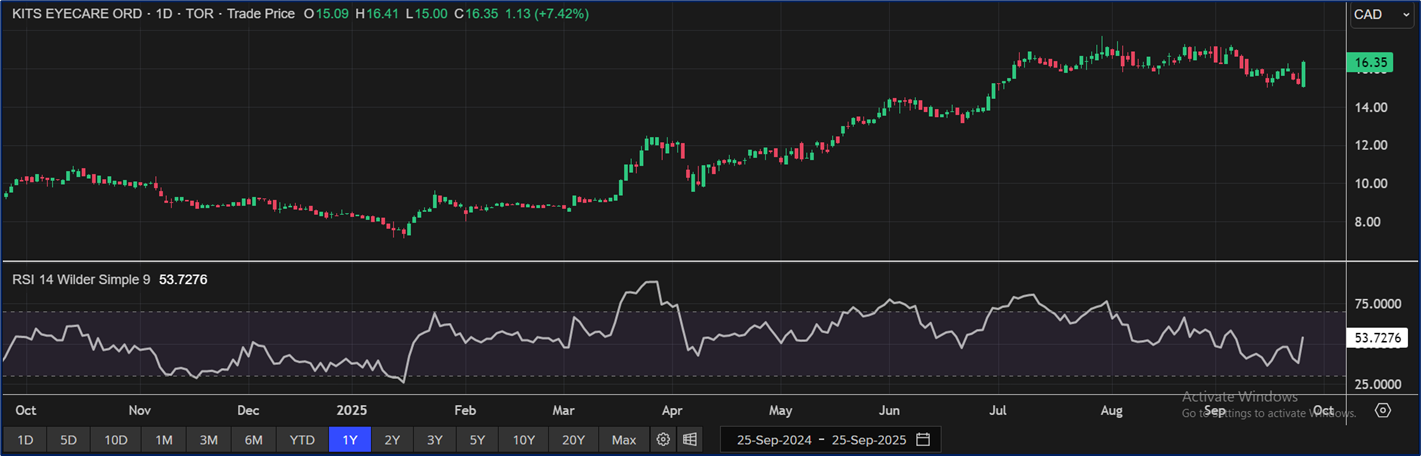
One-Year Technical Price Chart (as of September 25, 2025). Source: REFINITIV, Analysis: Kalkine Group

Section 2: Company Overview
MTY Food Group Inc. (TSX: MTY) is a franchisor in the quick service and casual dining food industry. Its activities consist of franchising and operating corporate-owned locations as well as the sale of retail products under a multitude of banners. The company's operating segment is based on geographical regions namely Canada and US and International. It generates maximum revenue from Canada. The company brands include Big Smoke Burger, Cafe Depot, Country Style, Croissant Plus, Cultures, Extremepita, Fabrika, Jus Jugo Juice, Koya Japan, ManchuWok, Muffin plus, Valentine, Van Houtte, Shushiman and others.
Kalkine’s Inflation Report covers the Investment Highlights, Key Financial Metrics, Risks, Technical Analysis along with the Valuation, Target Price, and Recommendation on the stock.

Section3: Financial Highlights

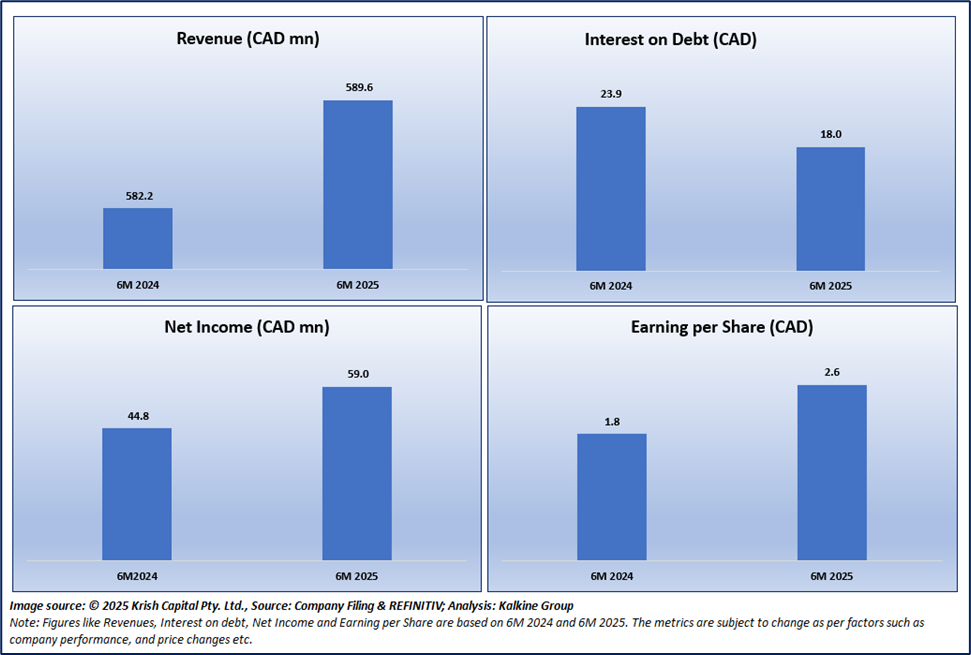
Section 4: Key Metrics
Below chart depicts the change in Revenue, Interest on Debt, Net Income and Earnings per Share are based on 6M 2024 and 6M 2025.
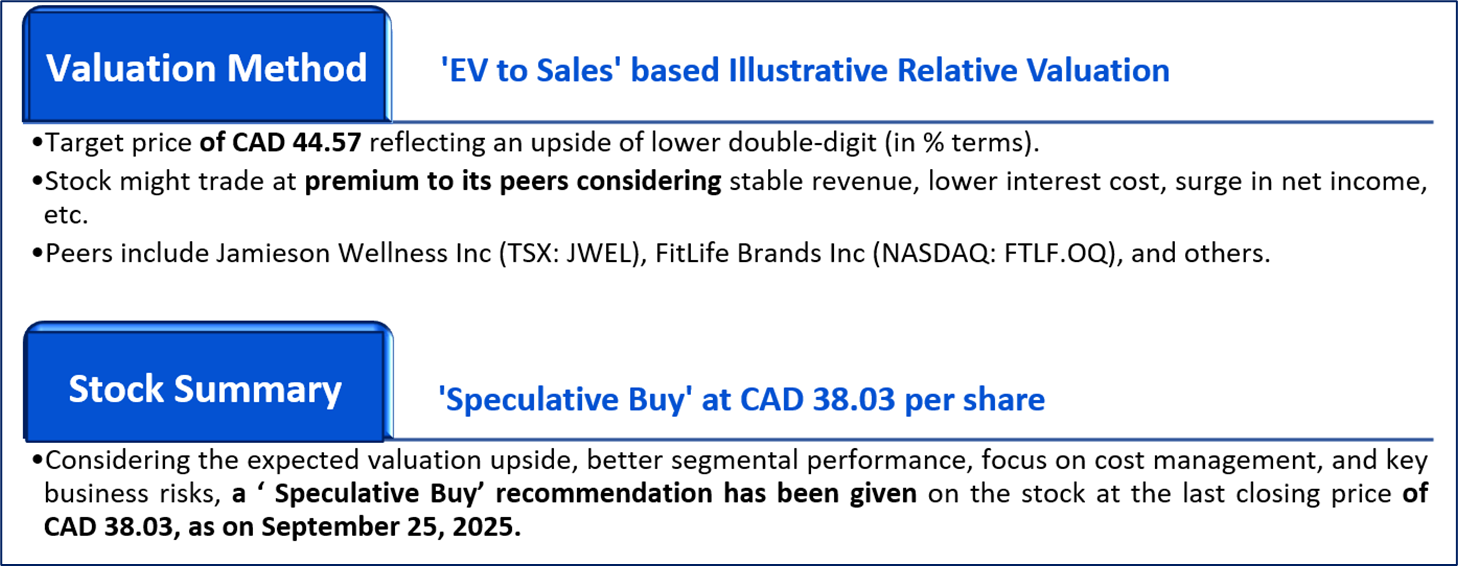
Section 5: Stock Recommendation Summary

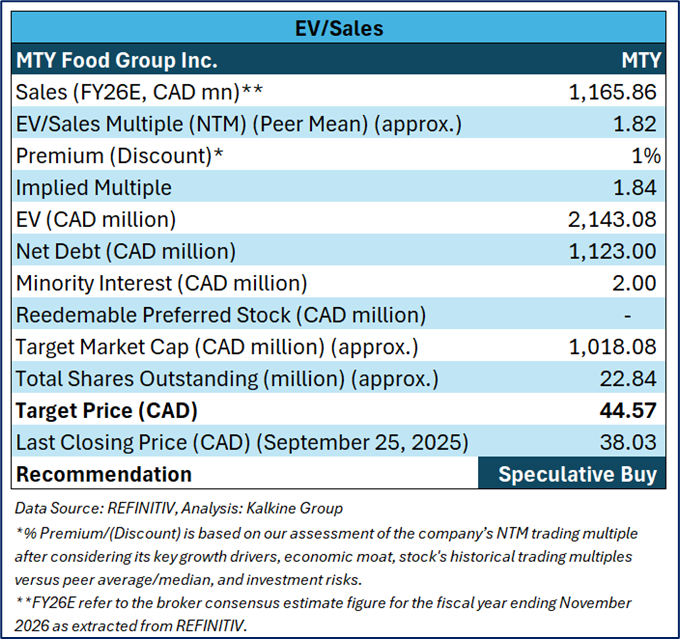
Valuation Methodology: EV to Sales Multiple Based Relative Valuation (Illustrative):


The stock has witnessed a downside of ~0.18% and of ~5.58% over the last 1 week and 3 months respectively. Moreover, it is trading below the average 52-week high price of CAD 53.16 and 52-week low price of CAD 36.79, providing an opportunity to accumulate the stock.

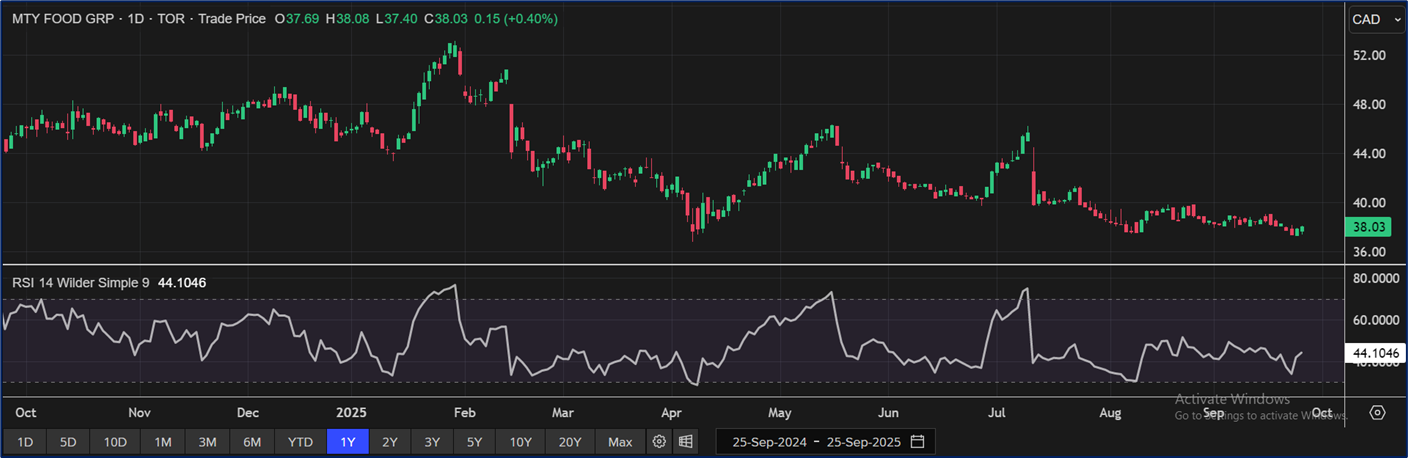
One-Year Technical Price Chart (as of September 25, 2025). Source: REFINITIV, Analysis: Kalkine Group

Note 1: Past performance is not a reliable indicator of future performance.
Note 2: The reference date for all price data, currency, technical indicators, support, and resistance levels is September 25, 2025. The reference data in this report has been partly sourced from REFINITIV.
Note 3: Investment decisions should be made depending on an individual's appetite for upside potential, risks, holding duration, and any previous holdings. An 'Exit' from the stock can be considered if the Target Price mentioned as per the Valuation and or the technical levels provided has been achieved and is subject to the factors discussed above.
Note 4: Dividend Yield may vary as per the stock price movement.
Note 5: Kalkine reports are prepared based on the stock prices captured either from REFINITIV or Trading View. Typically, REFINITIV or Trading View may reflect stock prices with a delay which could be a lag of 25-30 minutes. There can be no assurance that future results or events will be consistent with the information provided in the report. The information is subject to change without any prior notice.
Technical Indicators Defined: -
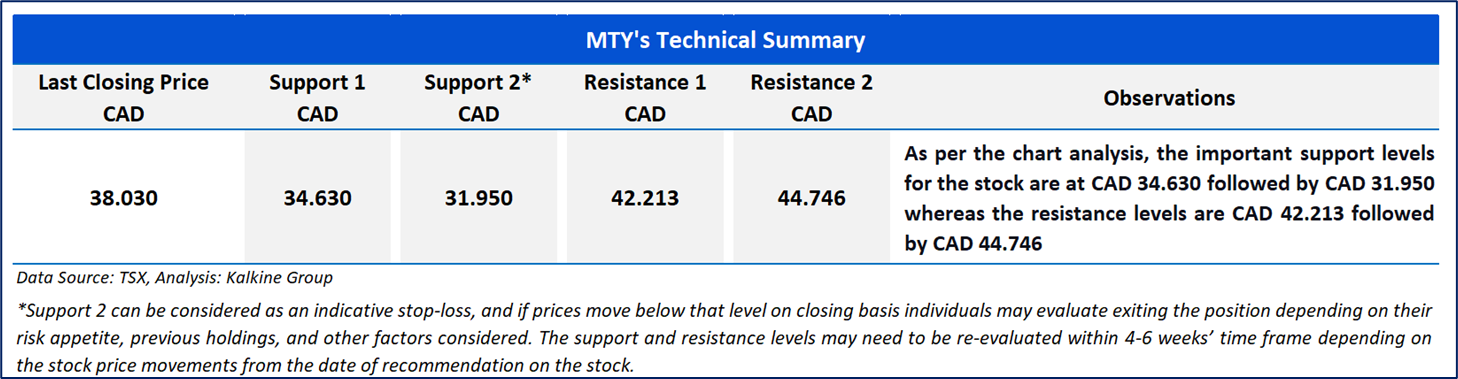
Support: A level at which the stock prices tend to find support if they are falling, and a downtrend may take a pause backed by demand or buying interest.
Resistance: A level at which the stock prices tend to find resistance when they are rising, and the uptrend may take a pause due to profit booking or selling interest.
Stop-loss: In general, it is a level to protect further losses in case of any unfavourable movement in the stock prices.
Past performance is not a reliable indicator of future performance.

 Please wait processing your request...