Section 1: Introduction
Inflation Report Coverage:
- Inflation report highlights how inflation impacts sectors differently, favoring value and defensive sectors like Energy, Materials, Consumer Staples, Healthcare, Utilities, select Financials, and REITs with inflation-indexed leases, while rate-sensitive sectors like Consumer Discretionary and high-growth Tech typically underperform.
- The report focuses on companies with proven business models, steady financials, high free cash flow, and solid ROE that can pass on costs to customers and protect margins. The aim is to identify stocks that can outperform inflation via capital gains and dividends, supporting diversified sectoral exposure.
Stocks Covered:
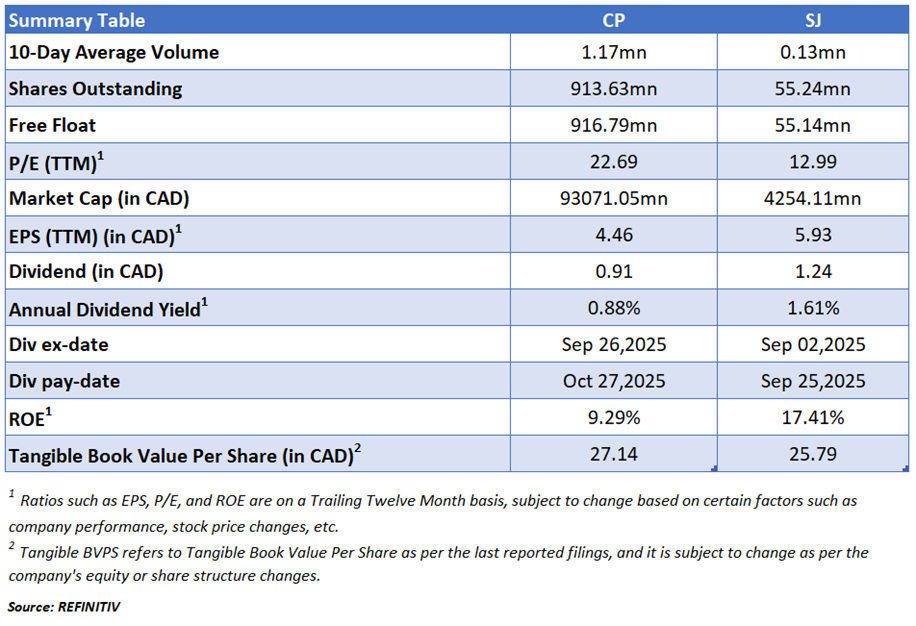
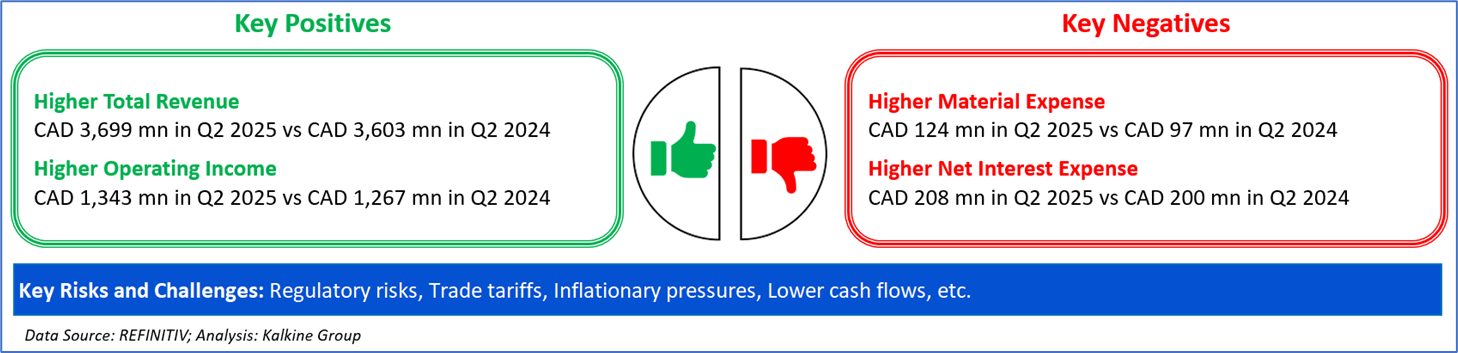
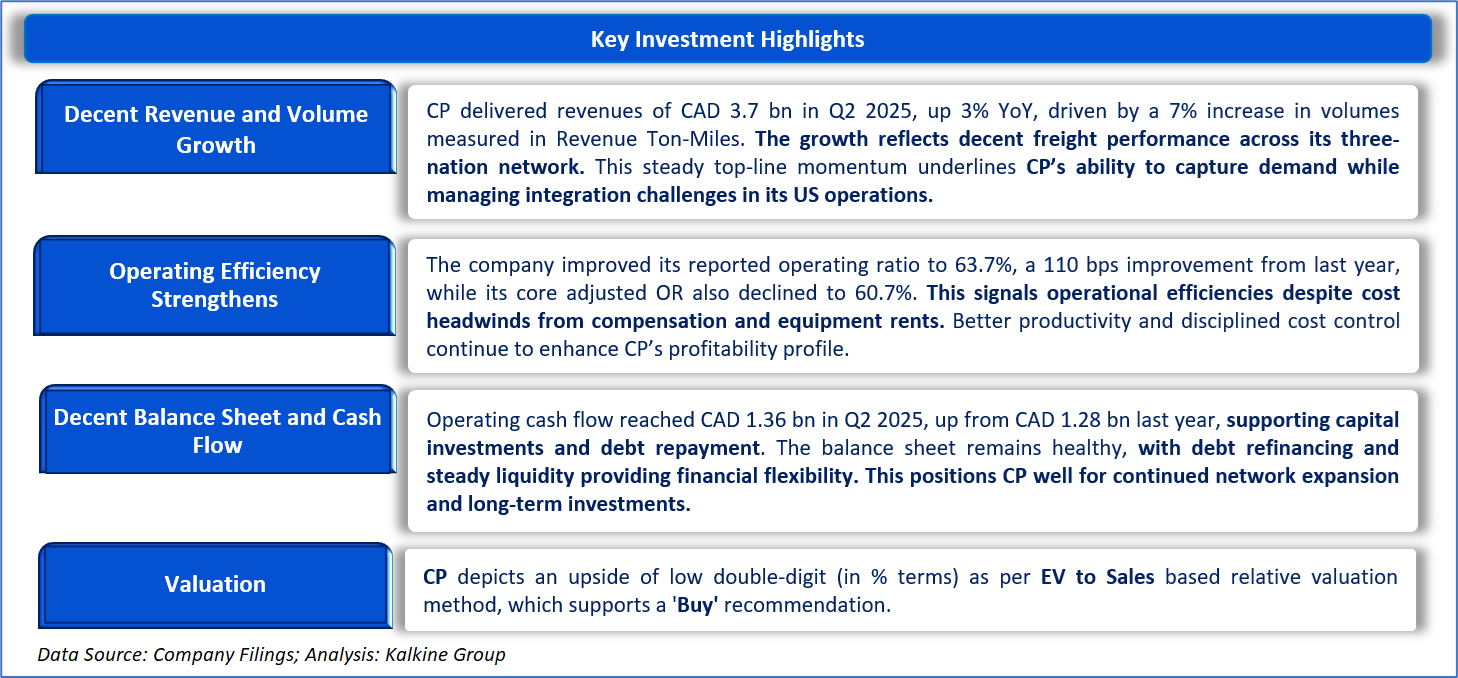
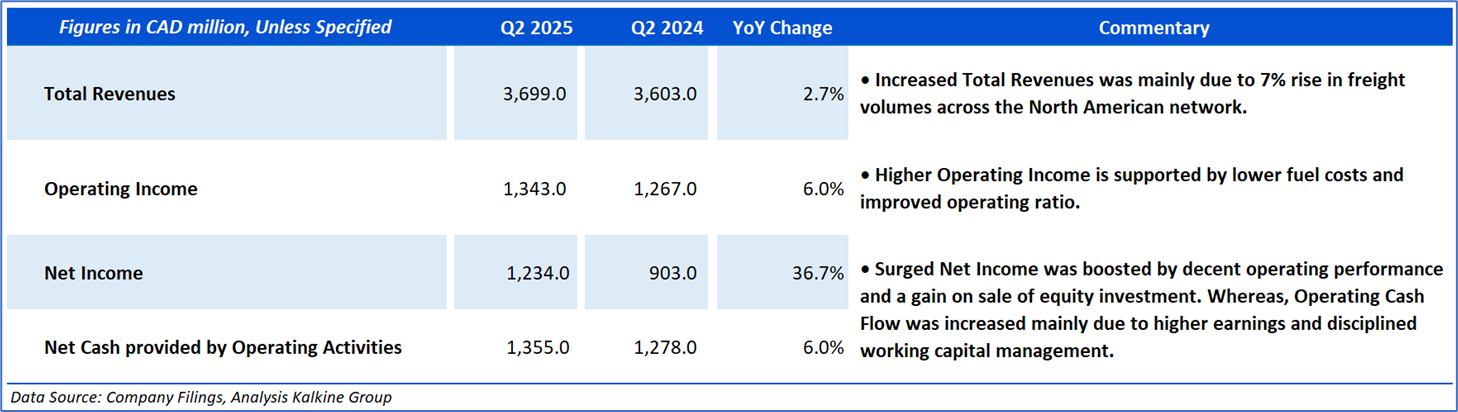
- Canadian Pacific Kansas City limited (TSX: CP) delivered healthy Q2 2025 results with revenue up 3% and volumes rising 7%. Operating ratio improved, net income jumped 37%, and cash flow increased by 6%, supporting dividends and buybacks. Its unique three-nation network, integration synergies, and reaffirmed guidance position CP for sustainable growth and long-term shareholder value.
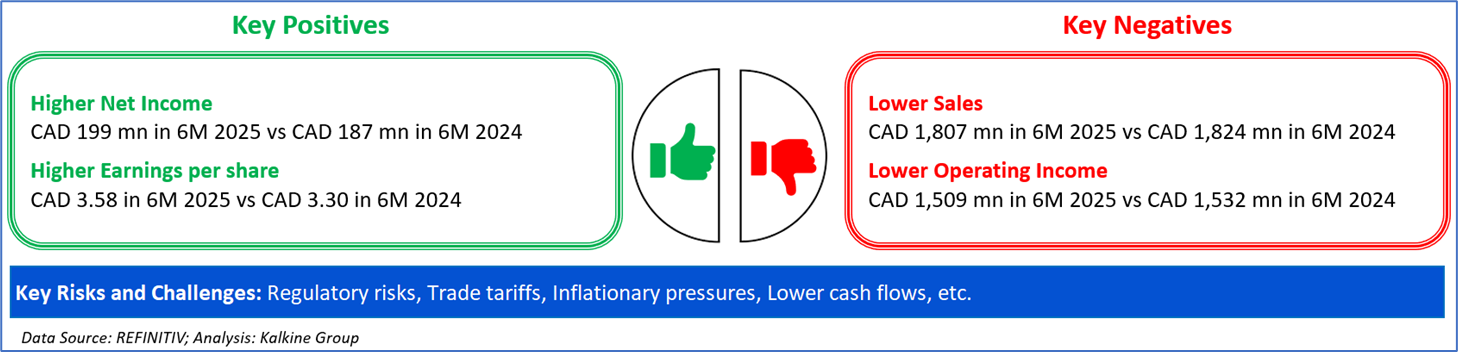
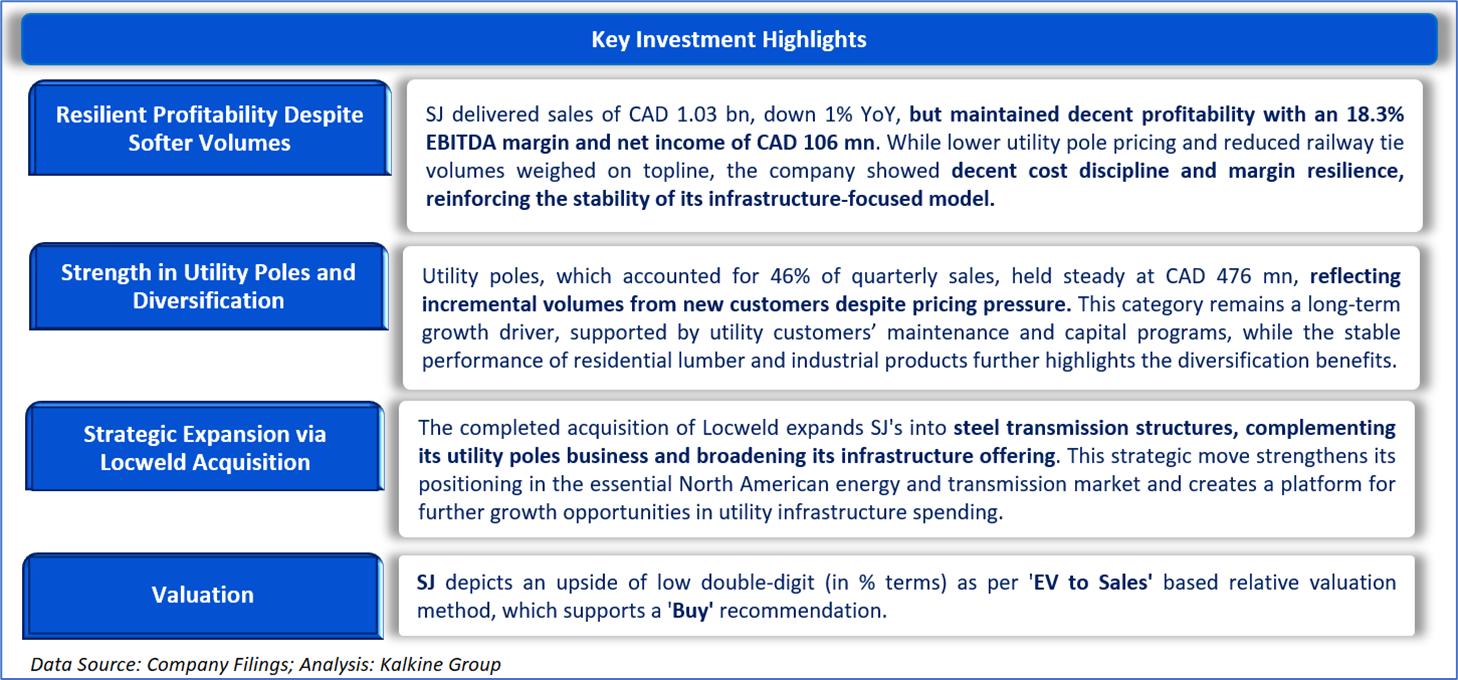
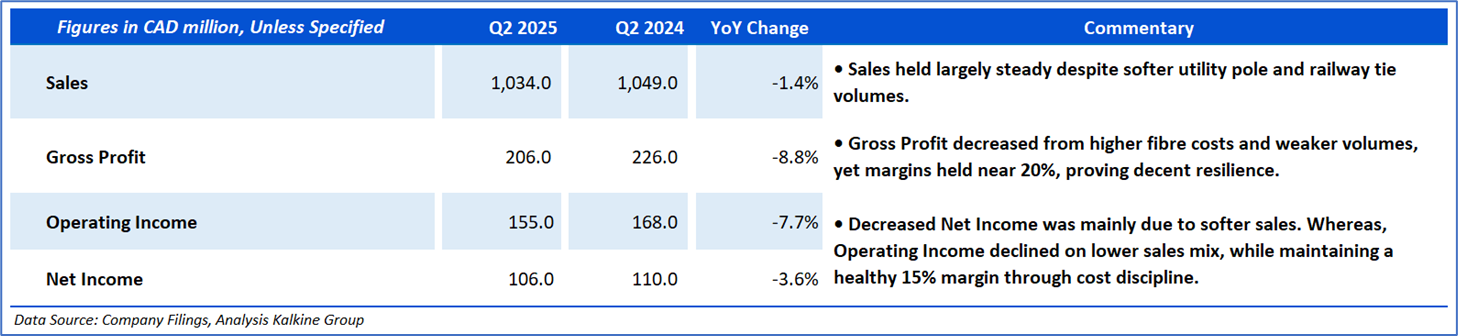
- Stella-Jones Inc. (TSX: SJ) delivered resilient Q2 2025 results with sales above CAD 1 bn and margins holding near 18%, despite softer utility pole pricing and lower railway tie volumes. The Locweld acquisition expands its offering into steel transmission structures, reinforcing its role in critical infrastructure markets. Backed by nearly CAD 700 mn in liquidity, improving leverage, and consistent shareholder returns, Stella-Jones remains a stable, infrastructure-linked play with long-term growth supported by utility grid and rail investment.
Section 2: Company Overview
Canadian Pacific Kansas City Limited (TSX: CP) is a CAD 8 billion Class-1 railroads operating on more than 12,500 miles of track across most of Canada and into parts of the Midwestern and Northeastern United States. It is the second smallest Class I railroad by revenue and route miles. In 2021, CP hauled shipments of grain (22% of freight revenue), intermodal containers (22%), energy products (like crude and frac sand), chemicals, and plastics (20%) coal (8%), fertilizer and potash (10%), automotive products (5%), and a diverse mix of other merchandise.
Kalkine’s Inflation Report covers the Investment Highlights, Key Financial Metrics, Risks, Technical Analysis along with the Valuation, Target Price, and Recommendation on the stock.

Section3: Financial Highlights

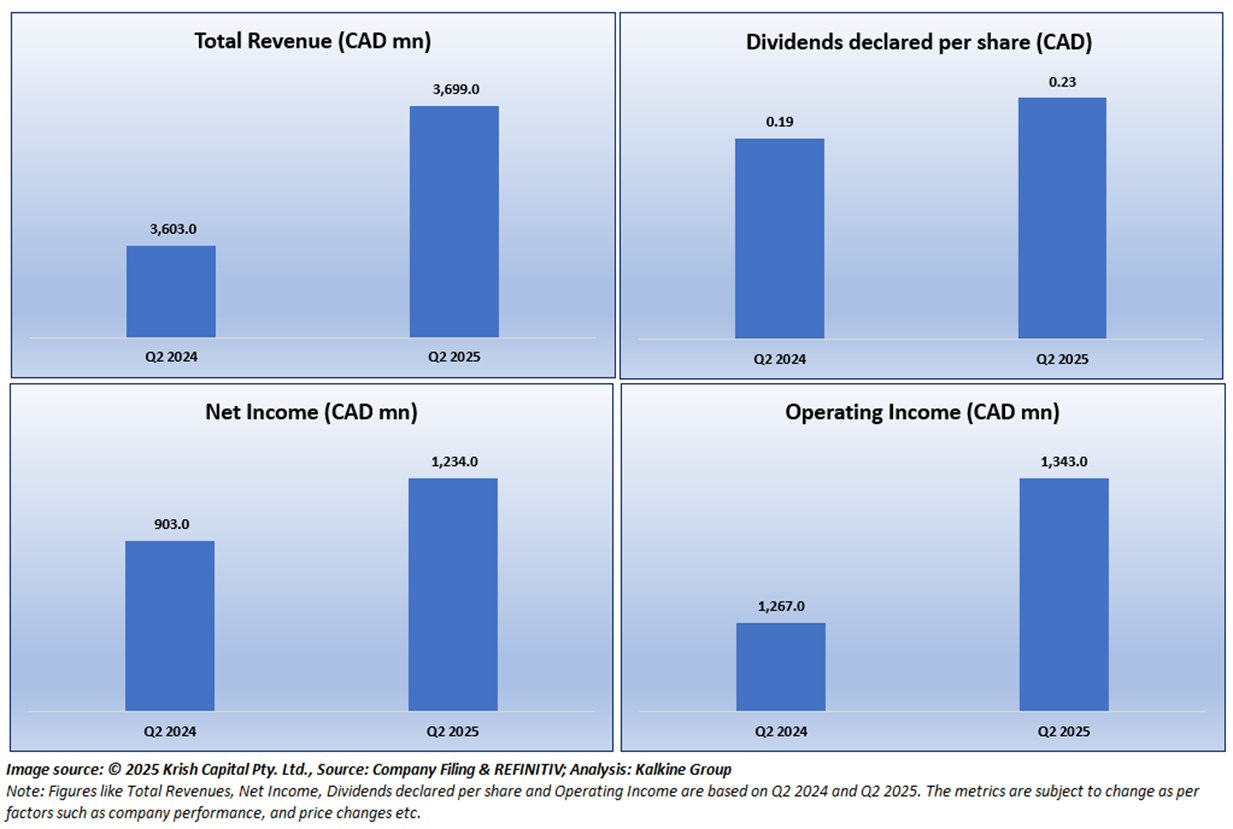
Section 4: Key Metrics
Below chart depicts the change in Total Revenues, Net Income, Dividends declared per share and Operating Income of the Company for Q2 2024 and Q2 2025.
Section 5: Stock Recommendation Summary

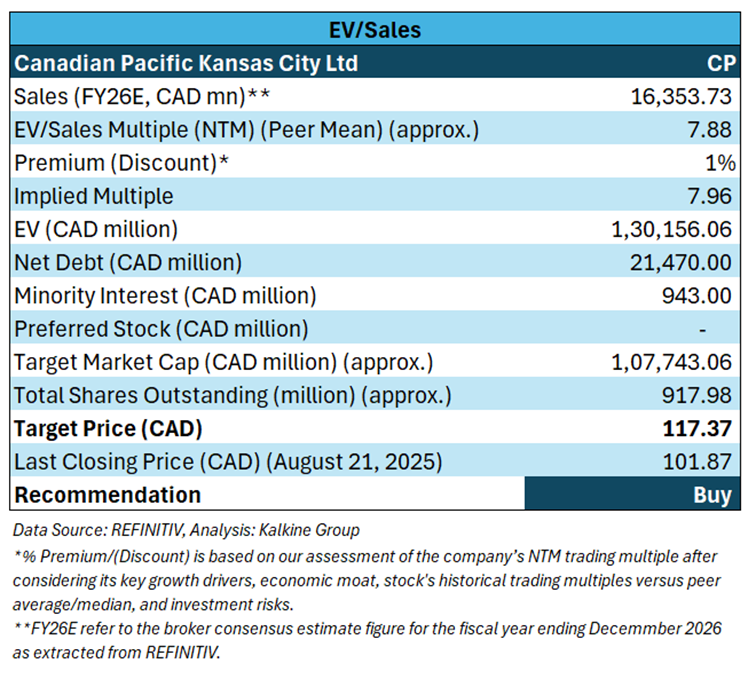
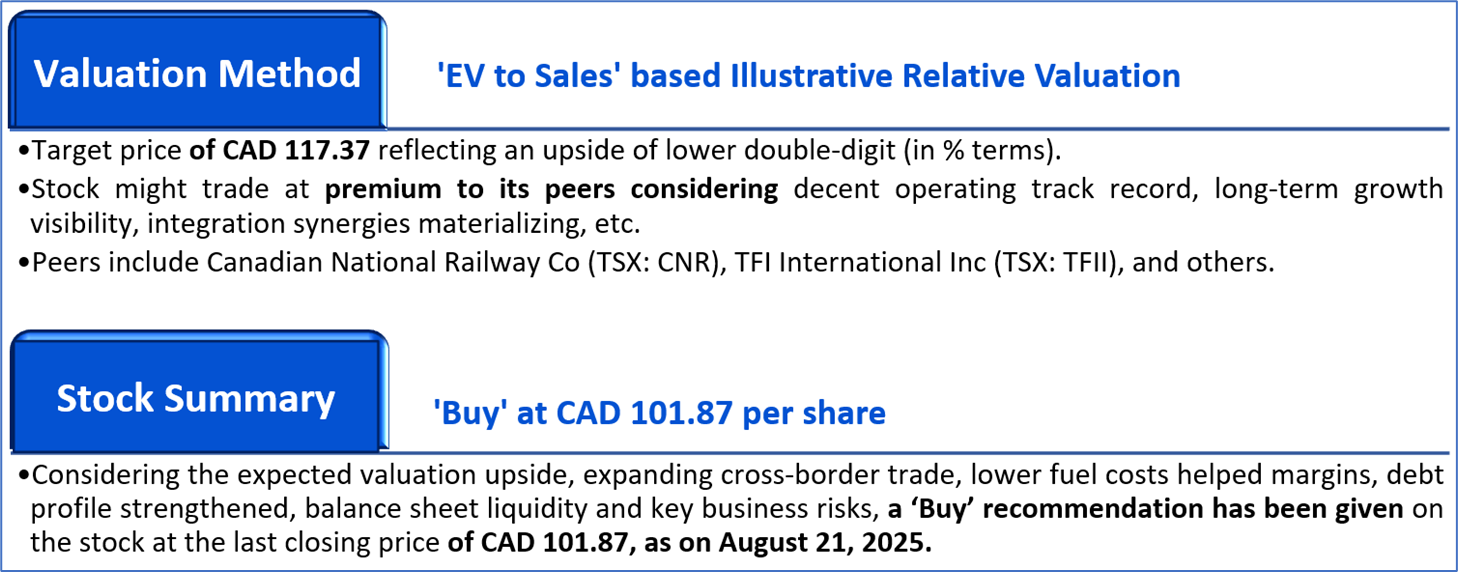
Valuation Methodology: EV to Sales Multiple Based Relative Valuation (Illustrative):


The stock has witnessed a downside of ~0.15% and ~8.61% over the last 1 week and 3 months respectively. Moreover, it is trading below the average 52-week high price of CAD 119.20 and 52-week low price of CAD 94.60, providing an opportunity to accumulate the stock.

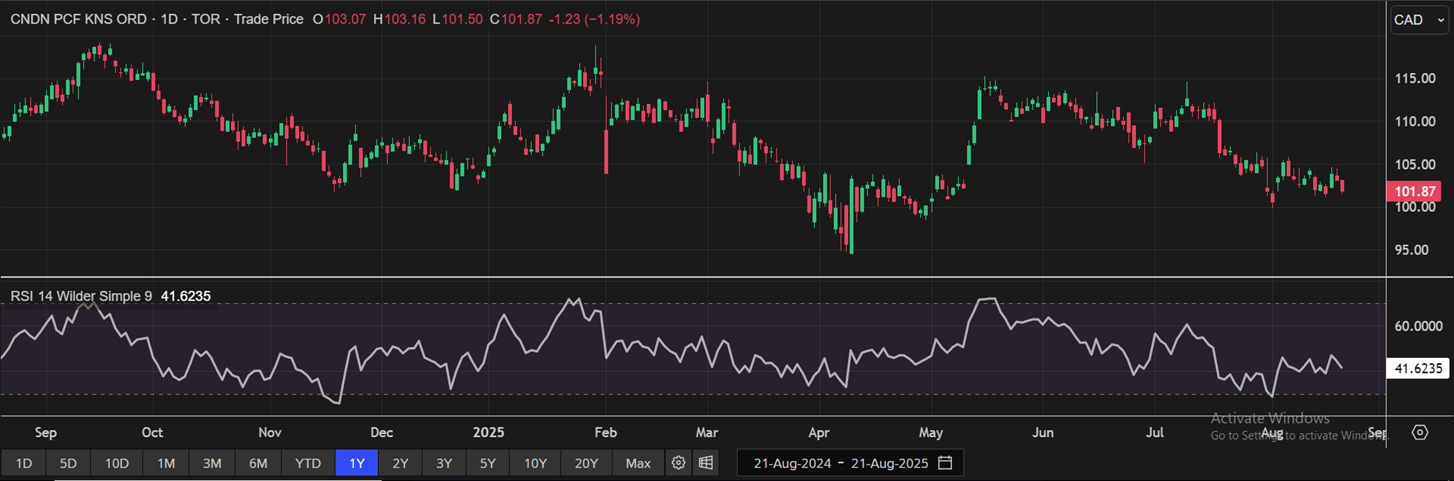
One-Year Technical Price Chart (as of August 21, 2025). Source: REFINITIV, Analysis: Kalkine Group

Section 2: Company Overview
Stella-Jones Inc. (TSX: SJ) produces and sells lumber and wood products. The company operates in two segments: Pressure-treated wood, which includes utility poles, railway ties, residential lumber, and industrial products; and Logs & Lumber segment comprises of the sales of logs harvested in the course of the company's procurement process that is determined to be unsuitable for use as utility poles, it also includes the sale of excess lumber to local home-building markets. The vast majority of its revenue comes from the Pressure-treated wood segment. Its geographical segments are the United States and Canada, of which the majority of its revenue is derived from the United States.
Kalkine’s Inflation Report covers the Investment Highlights, Key Financial Metrics, Risks, Technical Analysis along with the Valuation, Target Price, and Recommendation on the stock.

Section3: Financial Highlights

Section 4: Key Metrics
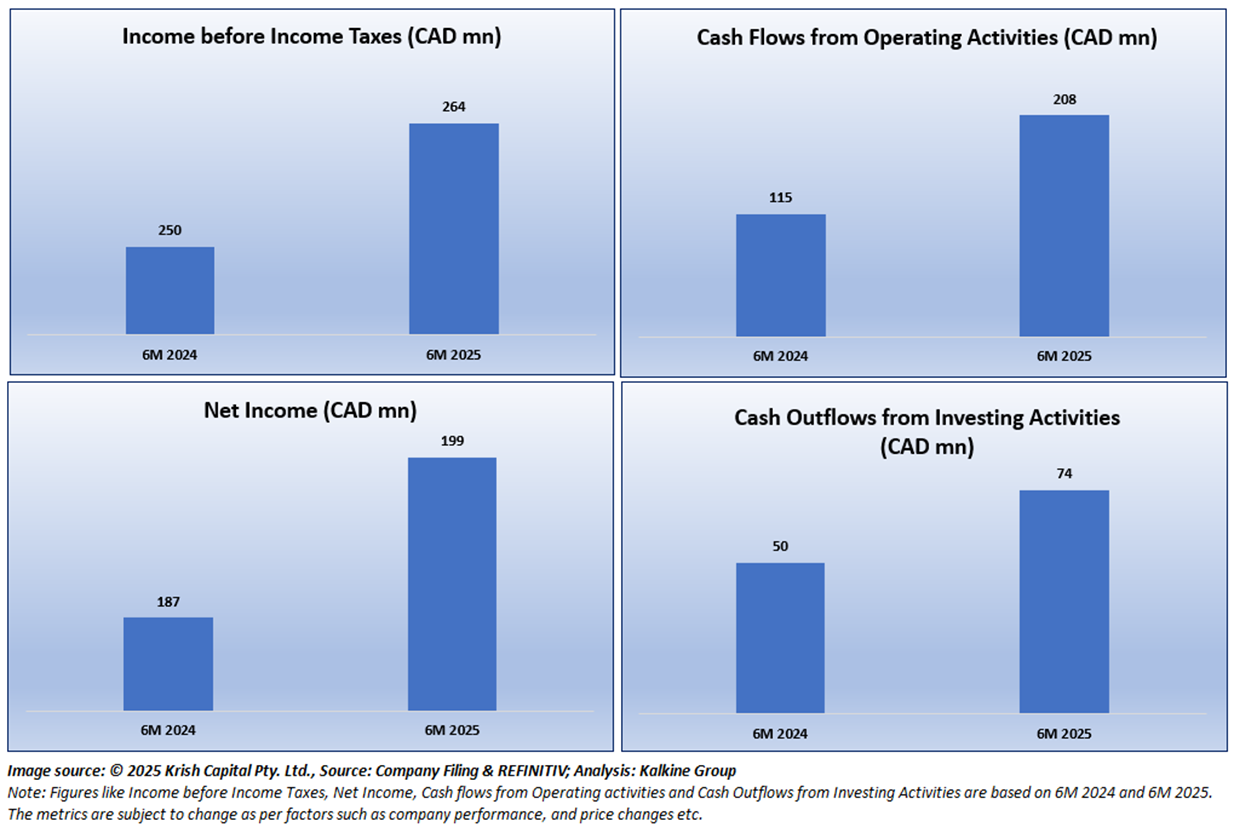
Below chart depicts the change in Income before Income Taxes, Net Income, Cash flows from Operating activities and Cash Outflows from Investing Activities are based on 6M 2024 and 6M 2025.
Section 5: Stock Recommendation Summary

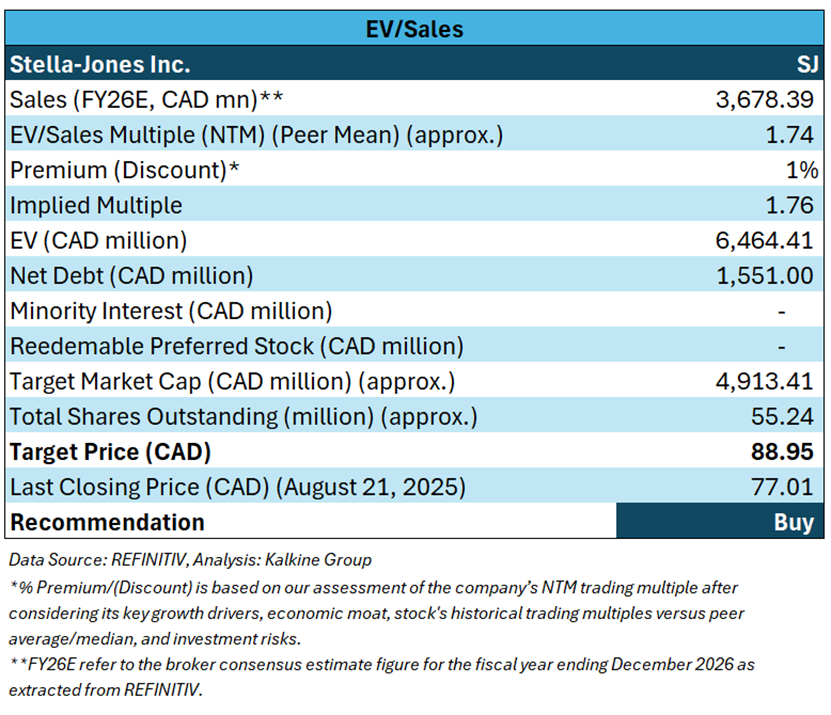
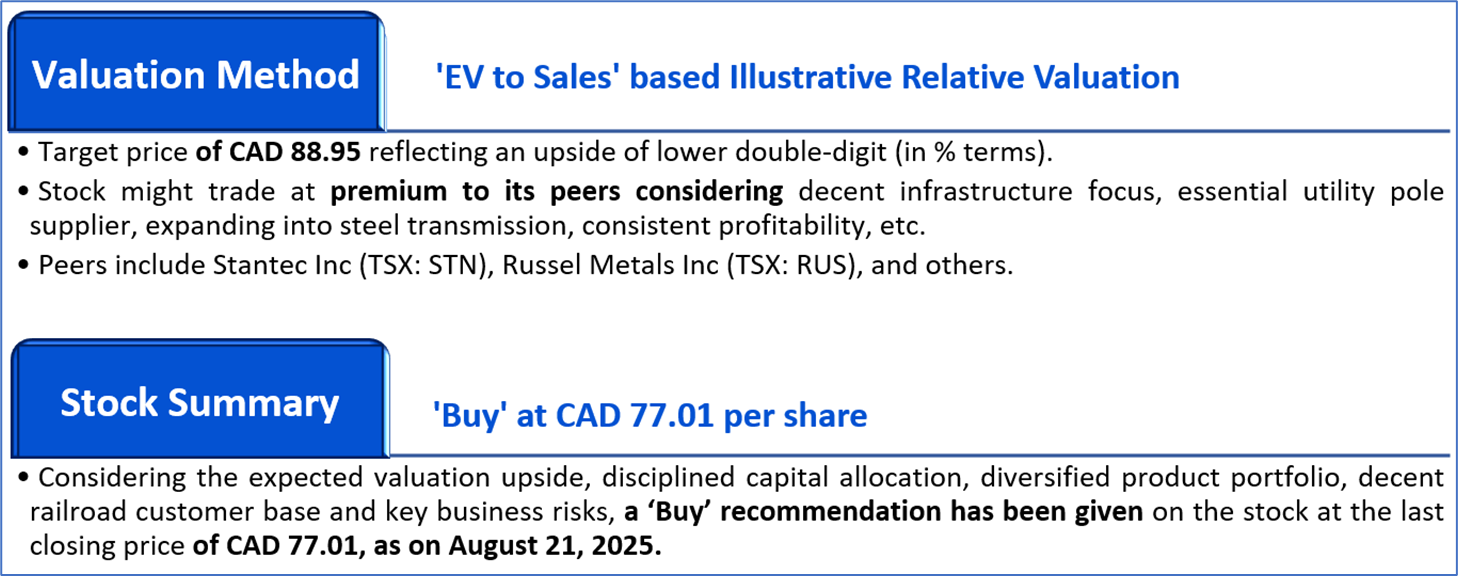
Valuation Methodology: EV to Sales Multiple Based Relative Valuation (Illustrative):


The stock has witnessed a downside of ~0.63% and an upside of ~2.42% over the last 1 week and 3 months respectively. Moreover, it is trading below the average 52-week high price of CAD 94.74 and 52-week low price of CAD 62.26, providing an opportunity to accumulate the stock.

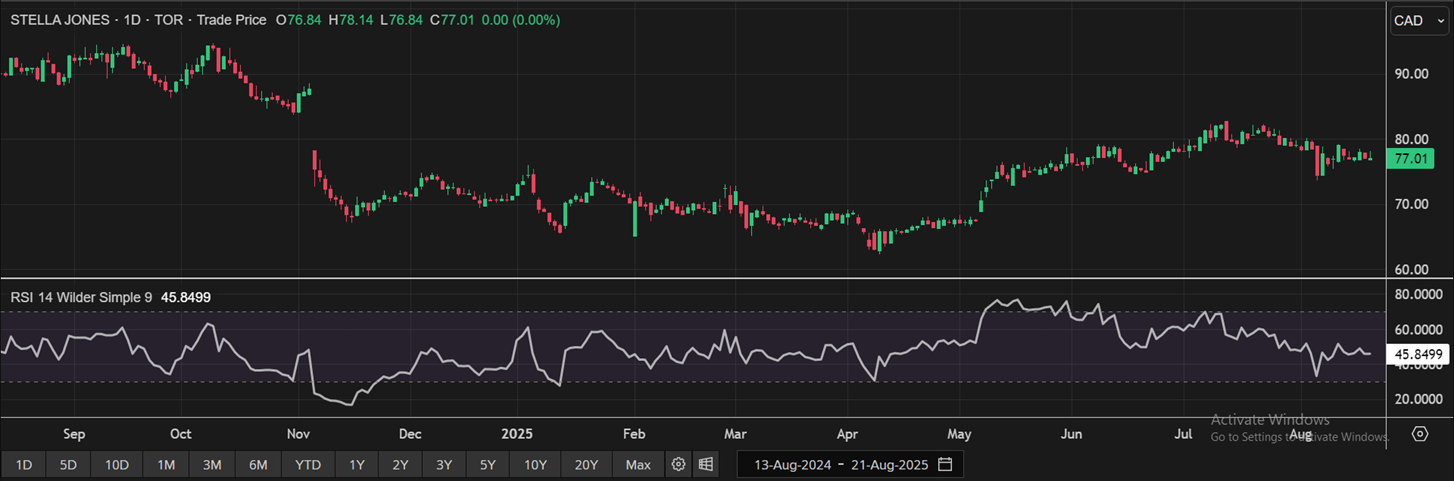
One-Year Technical Price Chart (as of August 21, 2025). Source: REFINITIV, Analysis: Kalkine Group

Note 1: Past performance is not a reliable indicator of future performance.
Note 2: The reference date for all price data, currency, technical indicators, support, and resistance levels is August 21, 2025. The reference data in this report has been partly sourced from REFINITIV.
Note 3: Investment decisions should be made depending on an individual's appetite for upside potential, risks, holding duration, and any previous holdings. An 'Exit' from the stock can be considered if the Target Price mentioned as per the Valuation and or the technical levels provided has been achieved and is subject to the factors discussed above.
Note 4: Dividend Yield may vary as per the stock price movement.
Note 5: Kalkine reports are prepared based on the stock prices captured either from REFINITIV or Trading View. Typically, REFINITIV or Trading View may reflect stock prices with a delay which could be a lag of 25-30 minutes. There can be no assurance that future results or events will be consistent with the information provided in the report. The information is subject to change without any prior notice.
Technical Indicators Defined: -
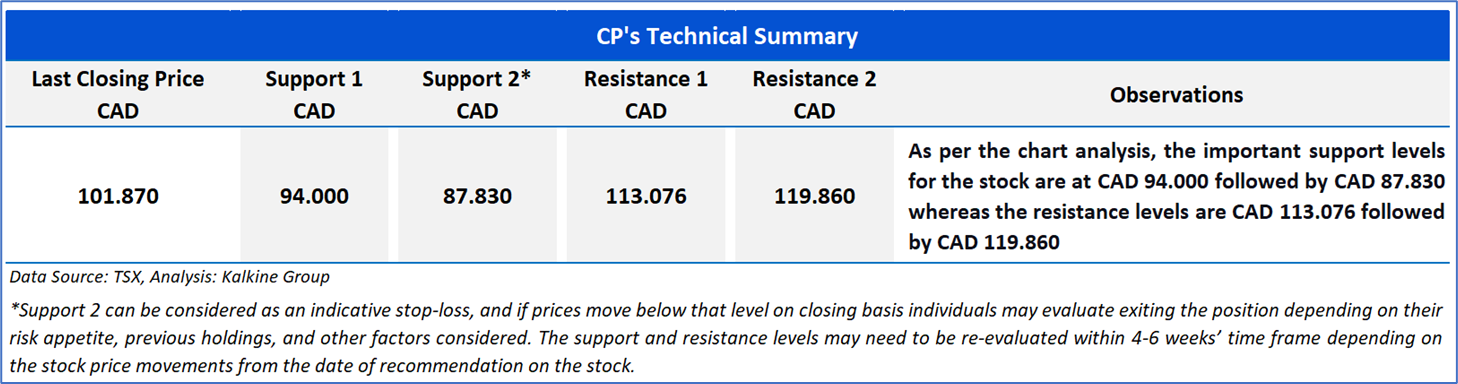
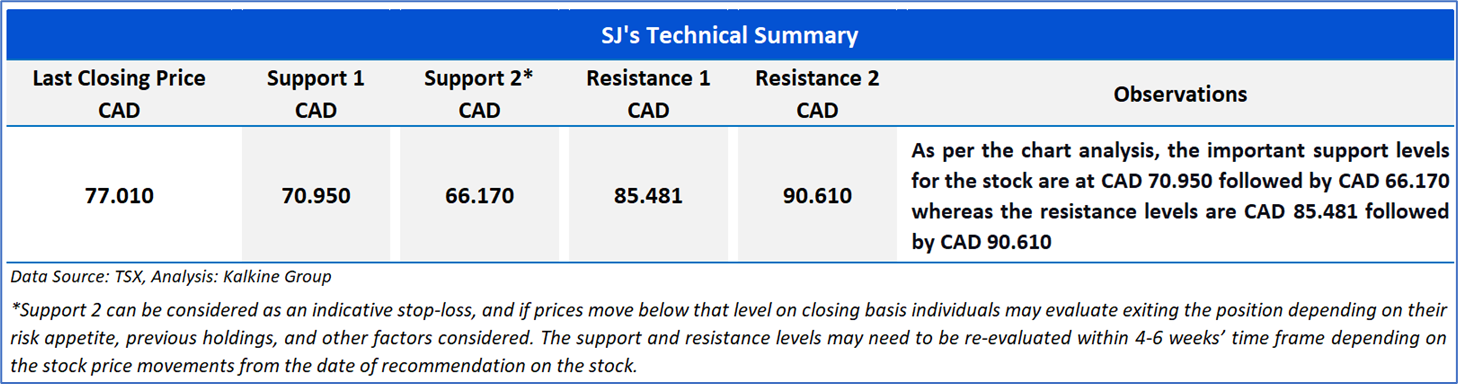
Support: A level at which the stock prices tend to find support if they are falling, and a downtrend may take a pause backed by demand or buying interest.
Resistance: A level at which the stock prices tend to find resistance when they are rising, and the uptrend may take a pause due to profit booking or selling interest.
Stop-loss: In general, it is a level to protect further losses in case of any unfavourable movement in the stock prices.
Past performance is not a reliable indicator of future performance.

 Please wait processing your request...