Section 1: Introduction
Inflation Report Coverage:
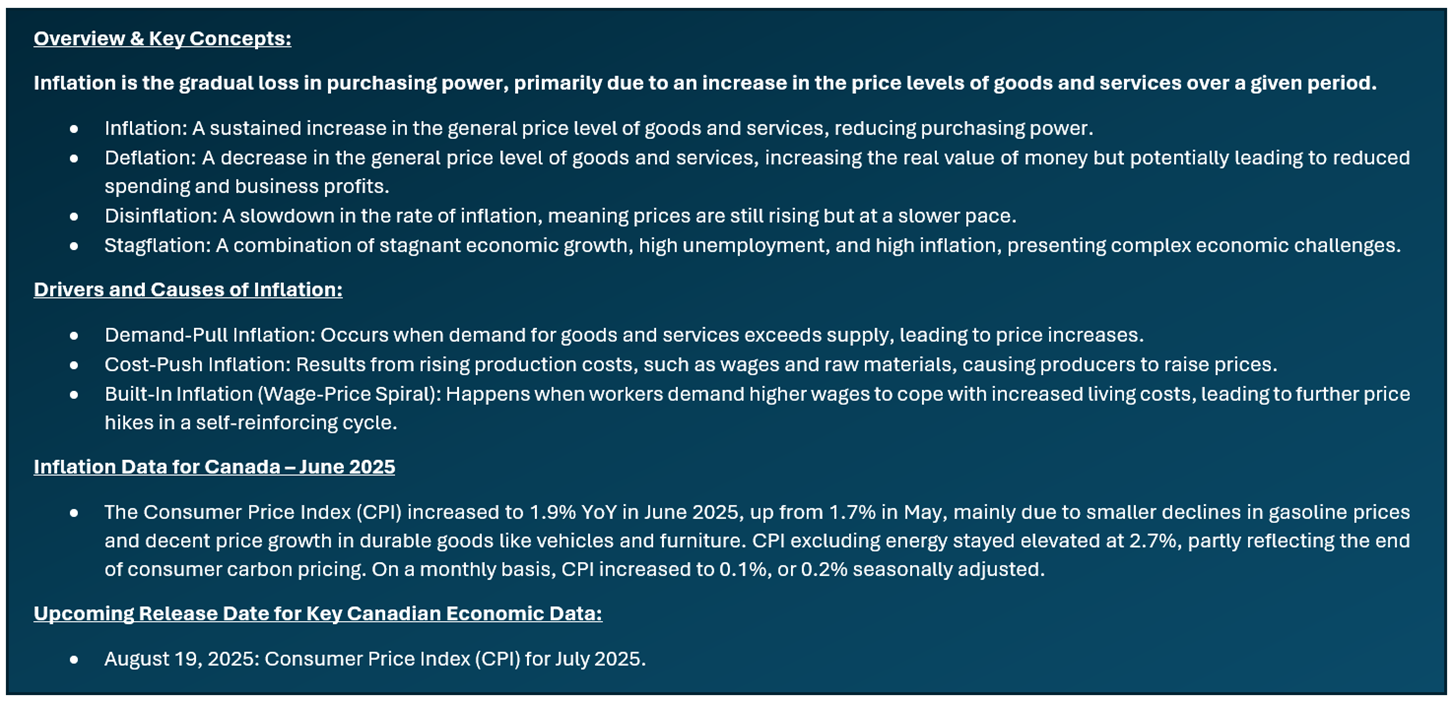
- Inflation report highlights how inflation impacts sectors differently, favoring value and defensive sectors like Energy, Materials, Consumer Staples, Healthcare, Utilities, select Financials, and REITs with inflation-indexed leases, while rate-sensitive sectors like Consumer Discretionary and high-growth Tech typically underperform.
- The report focuses on companies with proven business models, steady financials, high free cash flow, and solid ROE that can pass on costs to customers and protect margins. The aim is to identify stocks that can outperform inflation via capital gains and dividends, supporting diversified sectoral exposure.
Stocks Covered:
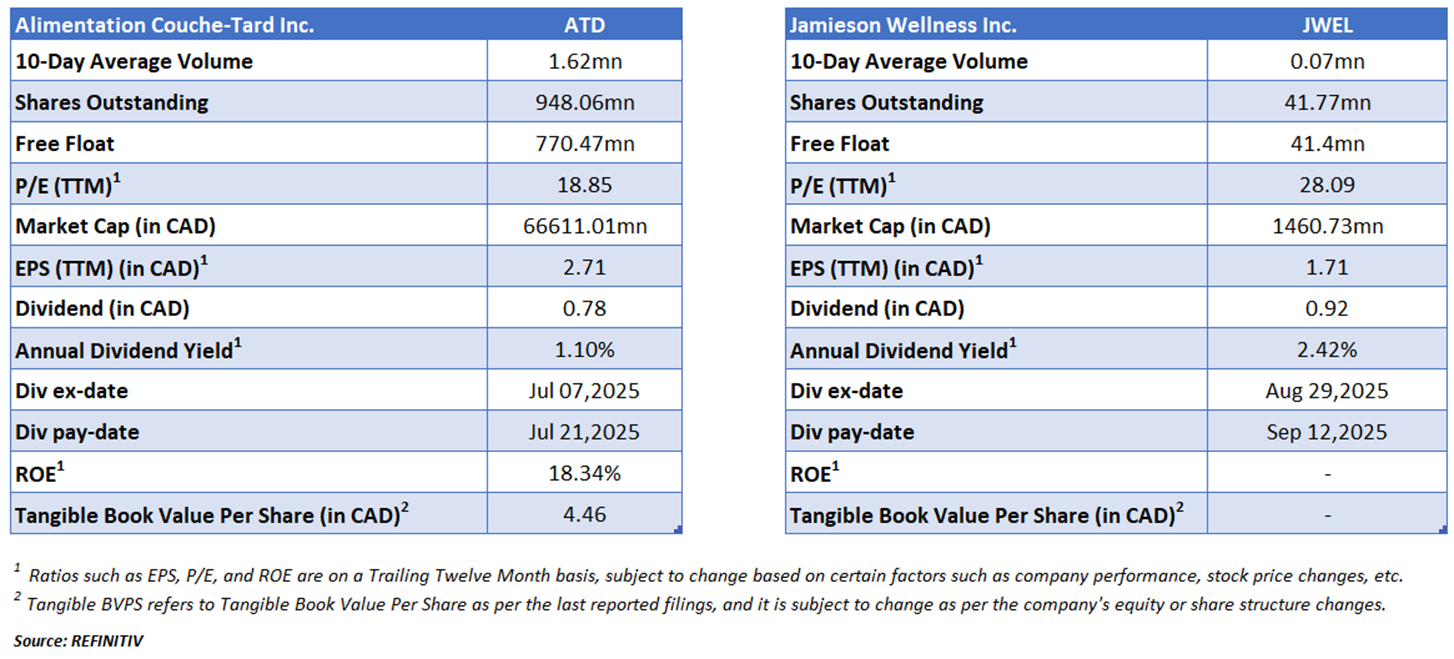
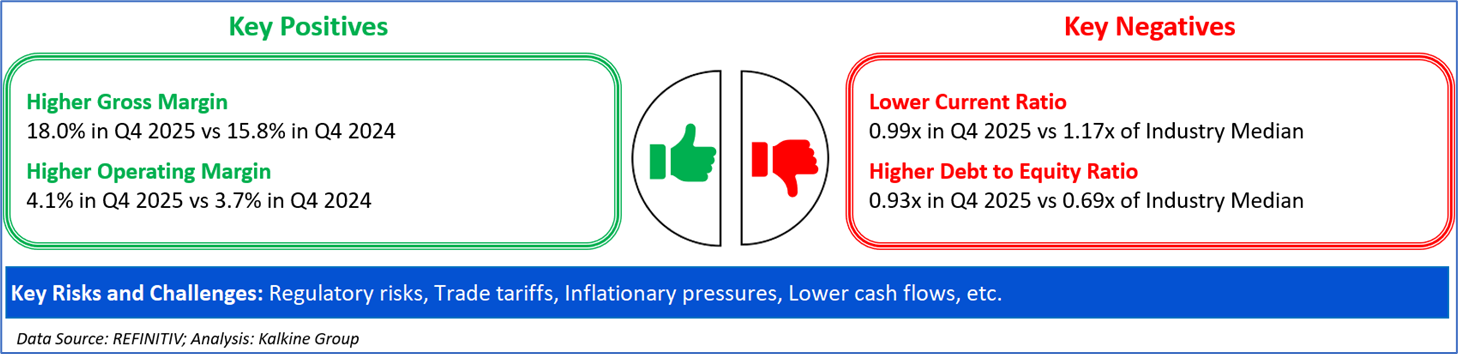
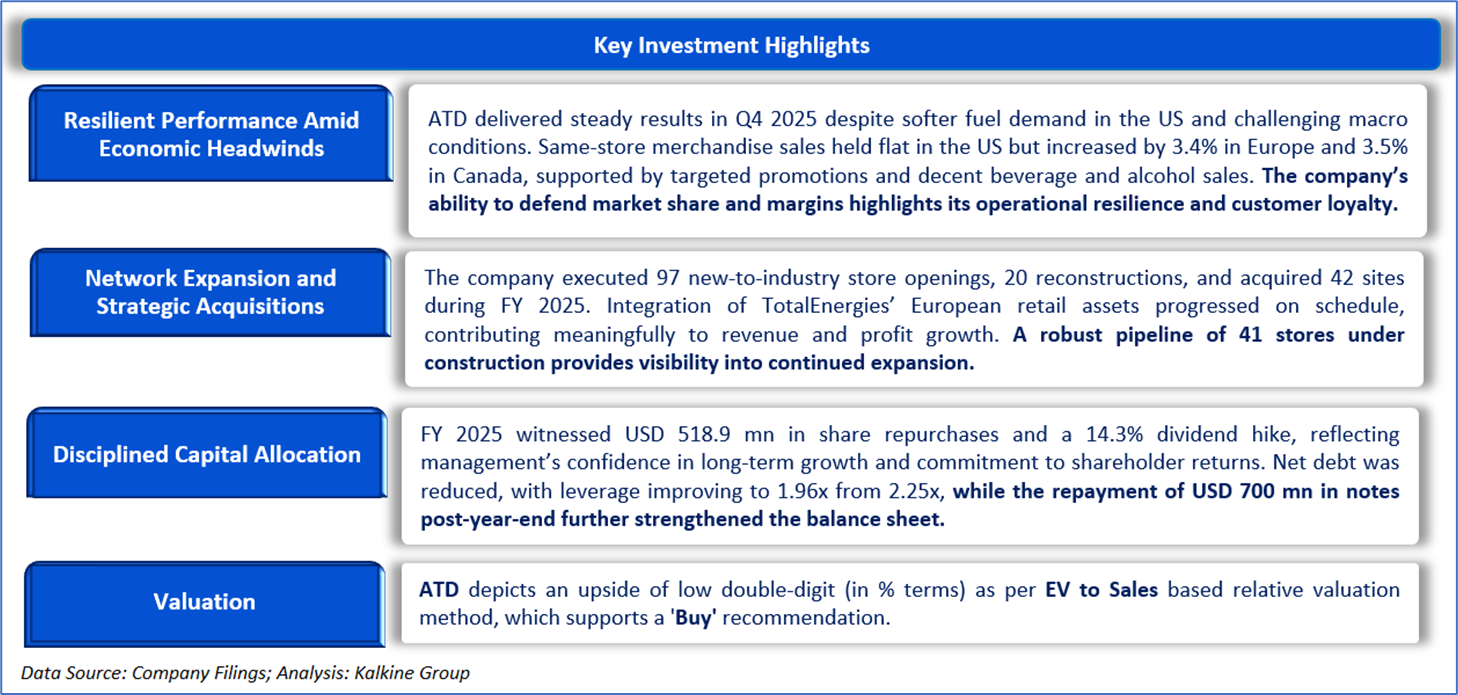
- Alimentation Couche-Tard (TSX: ATD) demonstrates resilience amid challenging economic and geopolitical conditions, supported by healthy performance in Canada and Europe despite softness in the U.S. Its broad global footprint, disciplined cost control, and strategic acquisitions like TotalEnergies assets drive steady revenue growth and margin improvement. The company’s focus on customer value, network expansion, and fuel margin optimization underpins decent free cash flow generation. With a history of share buybacks and dividend increases, ATD offers a stable, cash-generative business with long-term growth potential.
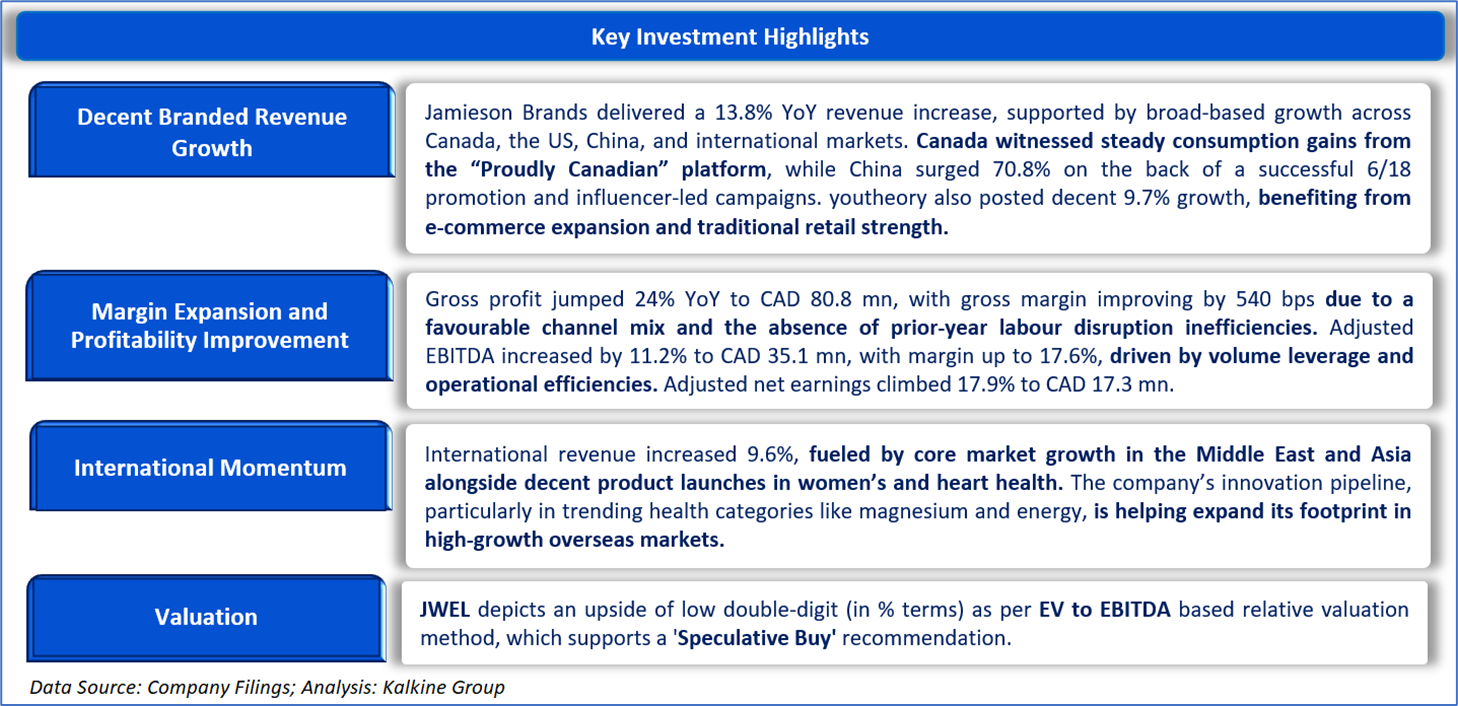
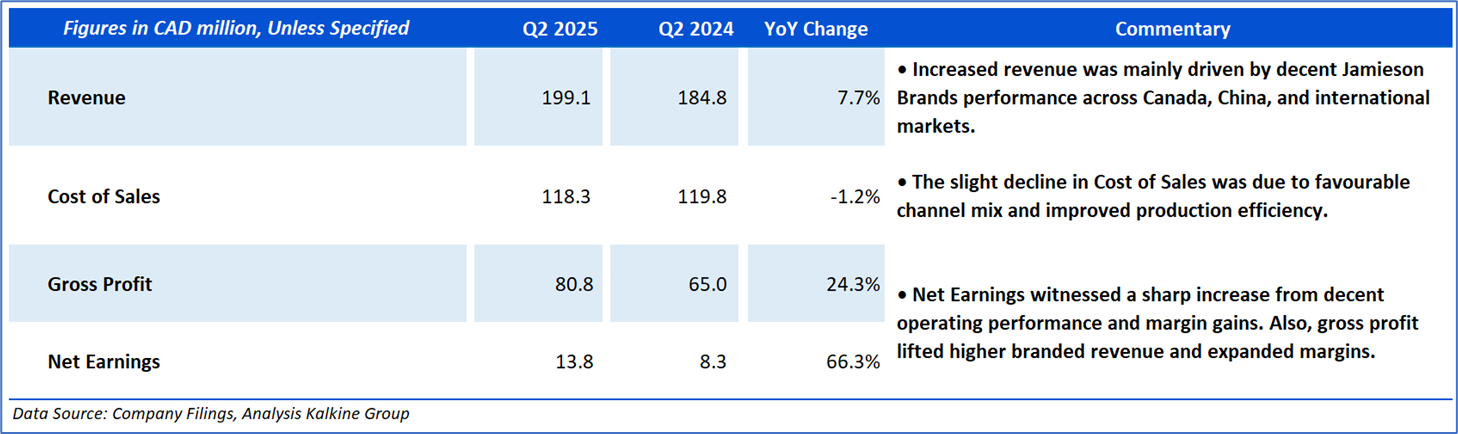
- Jamieson Wellness Inc. (TSX: JWEL) is demonstrating healthy momentum through robust branded revenue growth, led by a standout 70% surge in China and steady gains in Canada and the U.S. Efficient operations and a favourable product mix have boosted margins significantly, while a healthy innovation pipeline in trending health categories supports sustained demand. The company’s healthy cash flow, growing dividend, and share buyback program reinforce its financial strength. With a trusted brand presence in over 50 countries and an upgraded outlook for 2025, Jamieson offers a resilient, growth-oriented profile well positioned to capitalize on global wellness trends.
Section 2: Company Overview
Alimentation Couche-Tard Inc (TSX: ATD) operates a network of convenience stores across North America, Ireland, Scandinavia, Poland, the Baltics, and Russia. The company primarily generates income through the sale of tobacco products, groceries, beverages, fresh food, quick service restaurants, car wash services, other retail products and services, road transportation fuel, stationary energy, marine fuel, and chemicals. In addition, the company operates more stores under the Circle K banner in other countries such as China, Egypt, and Malaysia. Its operation is geographically divided into U.S., Europe, and Canada. Revenue from external customers fall mainly into three categories: merchandise and services, road transportation fuel, and other.
Kalkine’s Inflation Report covers the Investment Highlights, Key Financial Metrics, Risks, Technical Analysis along with the Valuation, Target Price, and Recommendation on the stock.

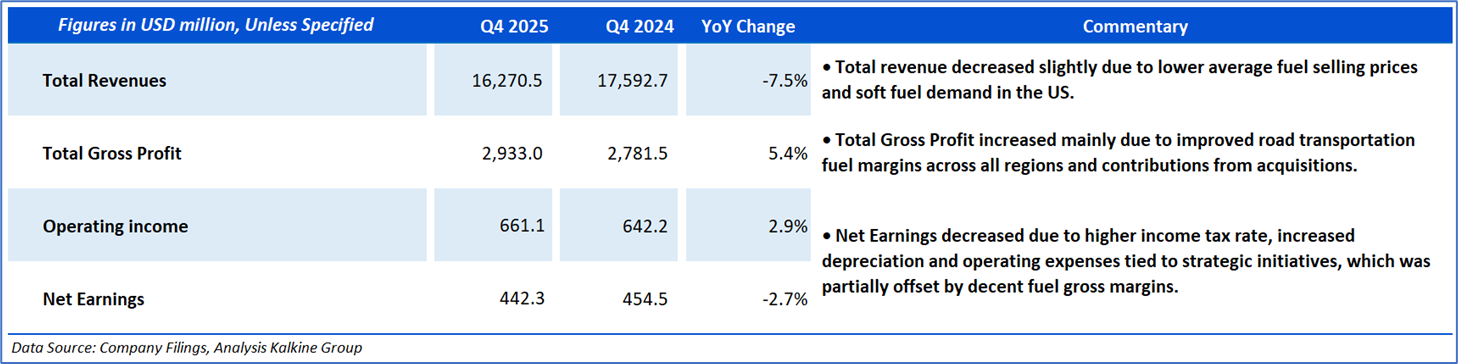
Section3: Financial Highlights

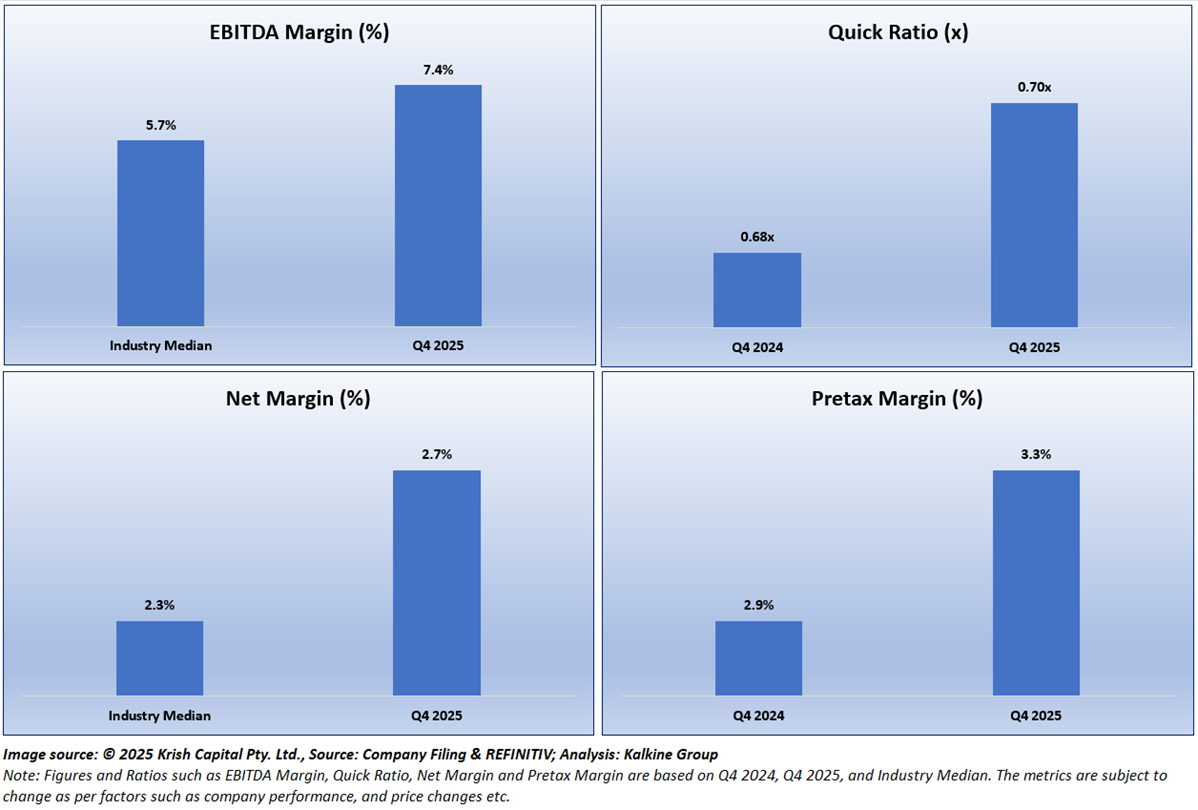
Section 4: Key Metrics
Below chart depicts the change in EBITDA Margin, Quick Ratio, Net Margin and Pretax Margin of the Company for Q4 2024, Q4 2025, and Industry Median.
Section 5: Stock Recommendation Summary

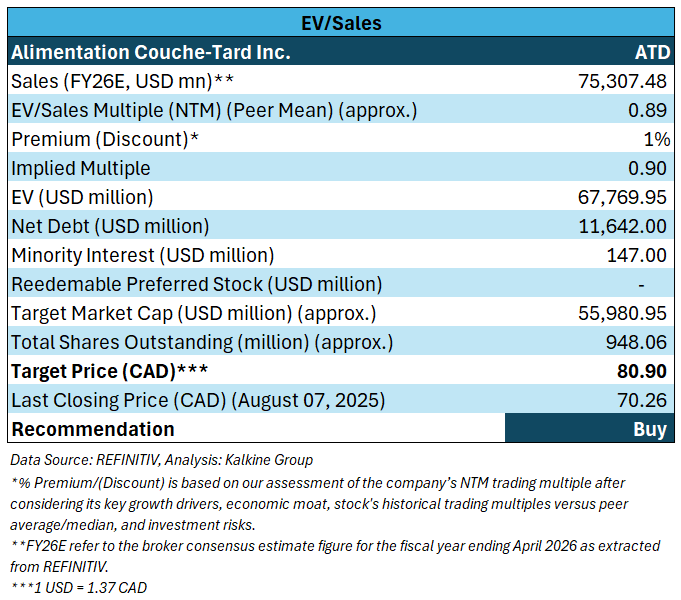
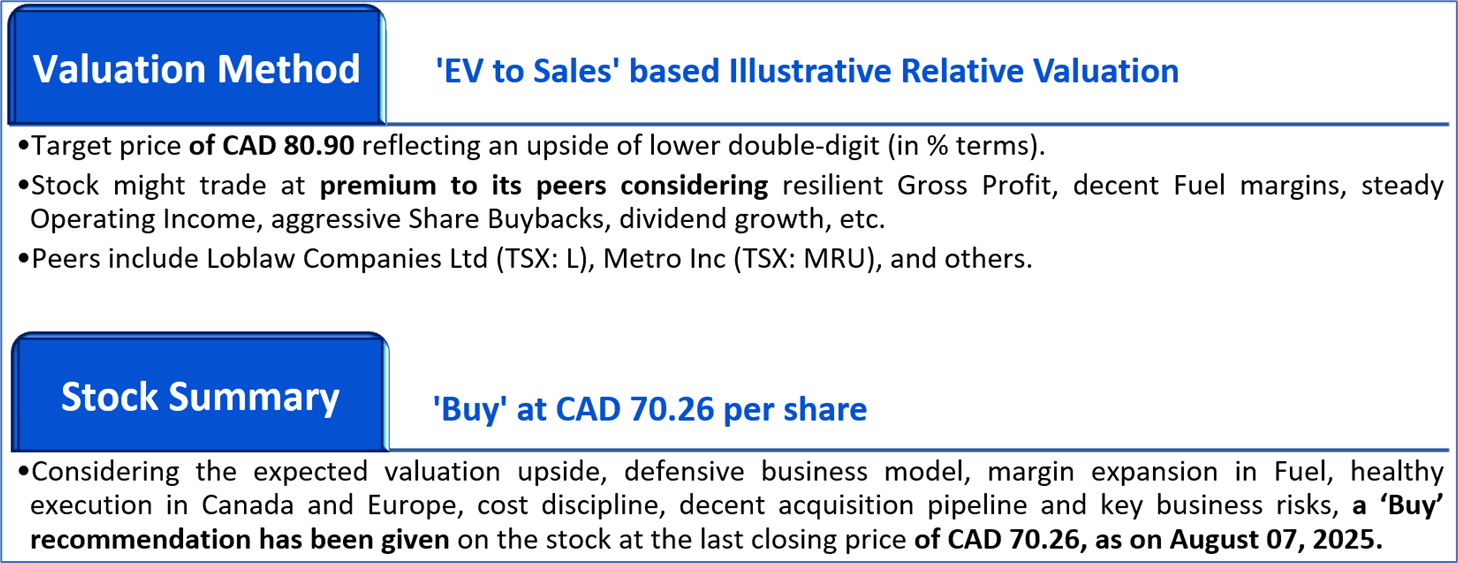
Valuation Methodology: EV to Sales Based Relative Valuation (Illustrative):


The stock has witnessed a downside of ~2.41% and an upside of ~0.91% over the last 1 week and 3 months respectively. Moreover, it is trading below the average 52-week high price of CAD 84.16 and 52-week low price of CAD 65.95, providing an opportunity to accumulate the stock.

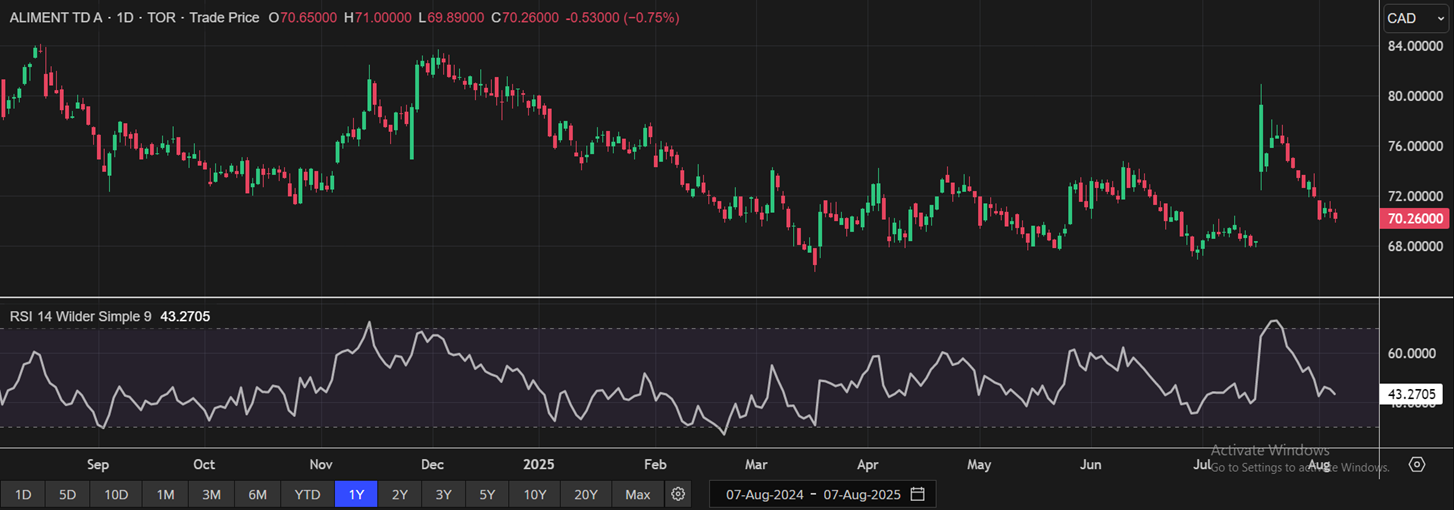
One-Year Technical Price Chart (as of August 07, 2025). Source: REFINITIV, Analysis: Kalkine Group

Section 2: Company Overview
Jamieson Wellness Inc. (TSX: JWEL) is engaged in the manufacturing, distributing, and marketing of branded natural health products, including vitamins, minerals, and supplements. The company operates in two segments: The Jamieson brands and The Strategic Partners. The majority of its revenue comes from the Jamieson brand segment. Some of its brands are Jamieson, Progressive, Precision, and Iron Vegan. Geographically, most of its revenue is derived from the domestic market.
Kalkine’s Inflation Report covers the Investment Highlights, Key Financial Metrics, Risks, Technical Analysis along with the Valuation, Target Price, and Recommendation on the stock.

Section3: Financial Highlights

Section 4: Key Metrics
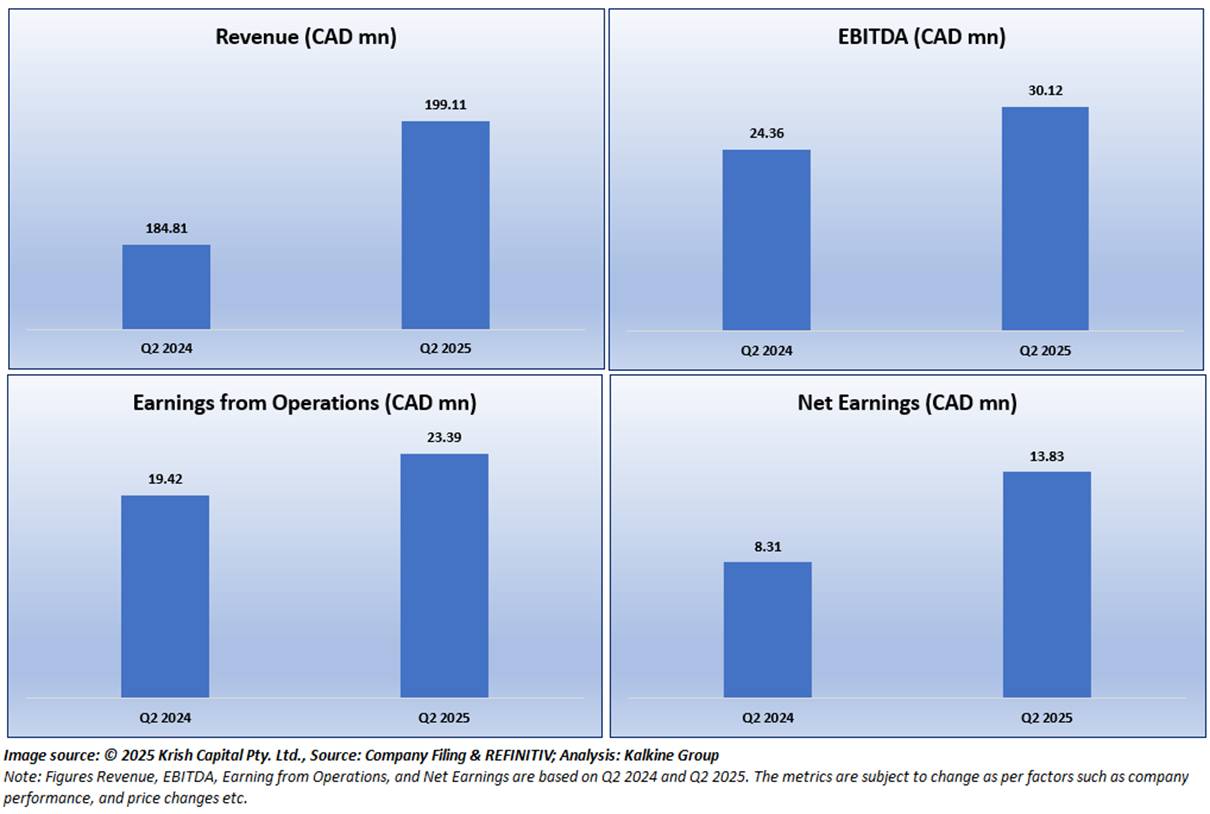
Below chart depicts the change in Revenue, EBITDA, Earning from Operations, and Net Earnings are based on Q2 2024 and Q2 2025.
Section 5: Stock Recommendation Summary

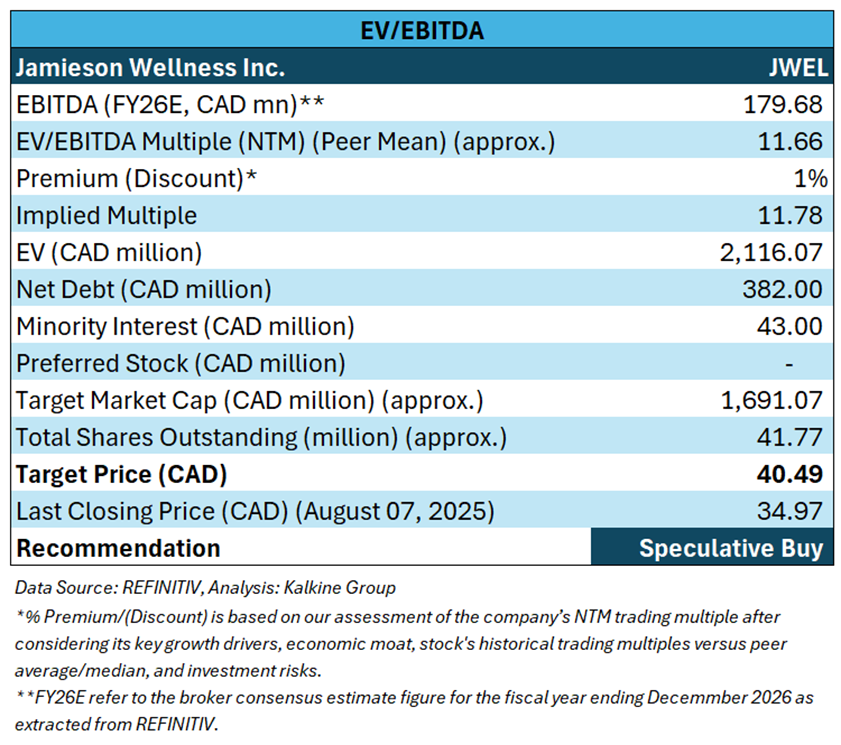
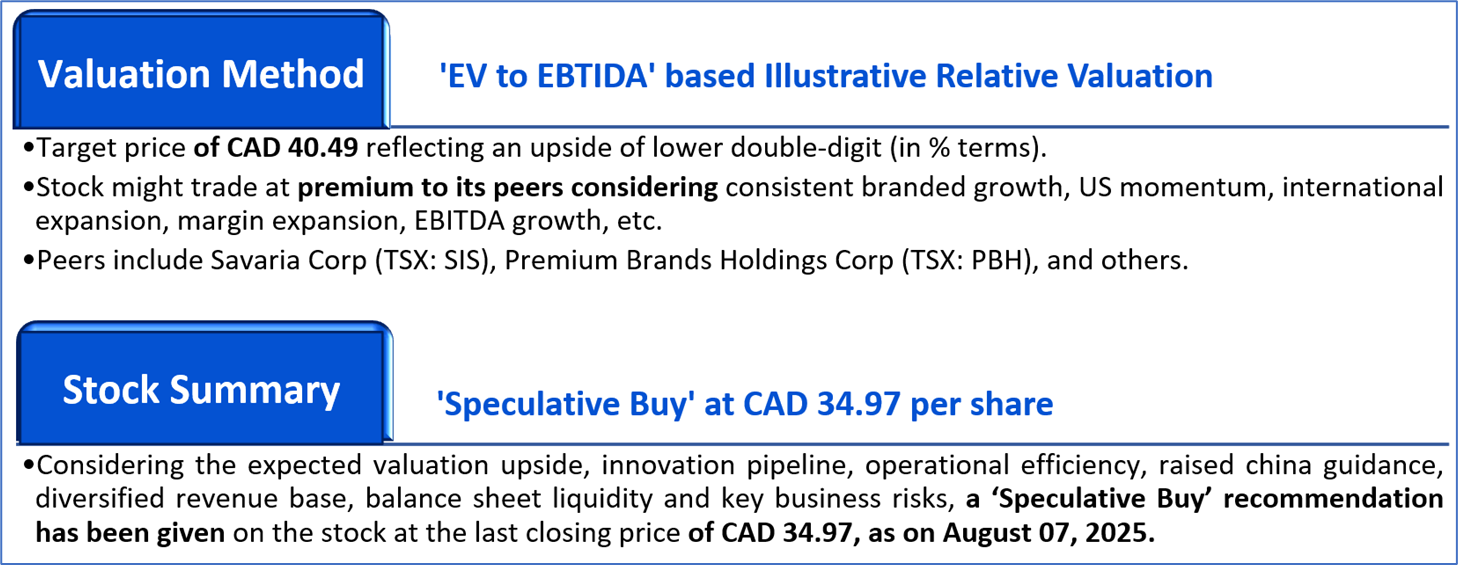
Valuation Methodology: EV to EBITDA Based Relative Valuation (Illustrative):


The stock has witnessed an upside of ~3.95% and ~10.00% over the last 1 week and 3 months respectively. Moreover, it is trading above the average 52-week high price of CAD 38.20 and 52-week low price of CAD 27.90, providing an opportunity to ride the trend.

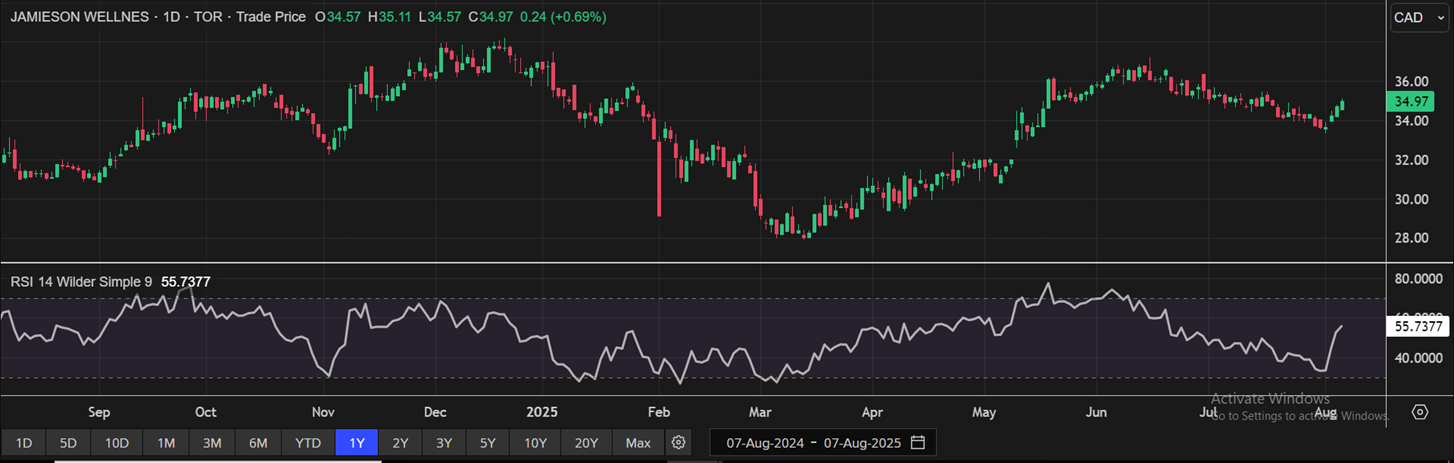
One-Year Technical Price Chart (as of August 07, 2025). Source: REFINITIV, Analysis: Kalkine Group

Note 1: Past performance is not a reliable indicator of future performance.
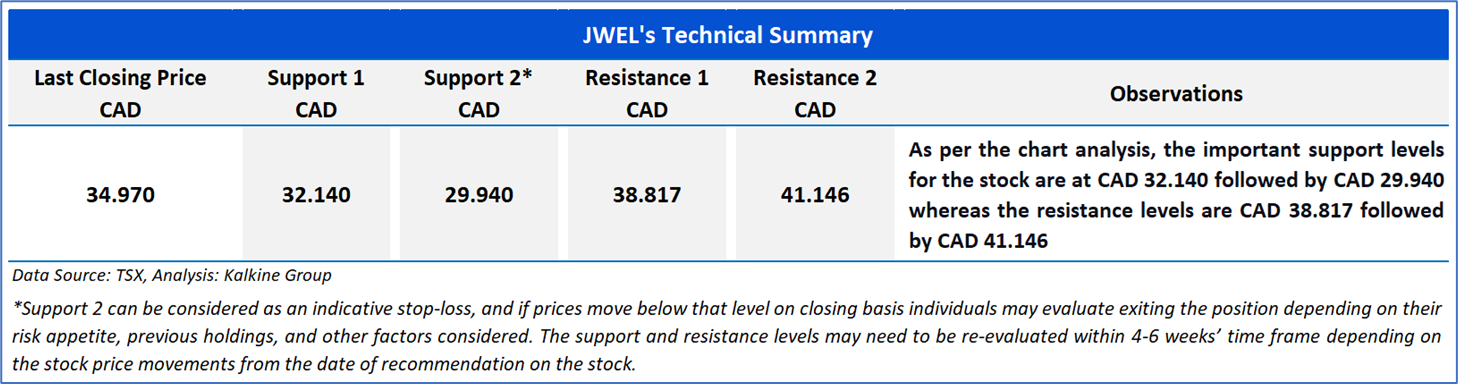
Note 2: The reference date for all price data, currency, technical indicators, support, and resistance levels is August 07, 2025. The reference data in this report has been partly sourced from REFINITIV.
Note 3: Investment decisions should be made depending on an individual's appetite for upside potential, risks, holding duration, and any previous holdings. An 'Exit' from the stock can be considered if the Target Price mentioned as per the Valuation and or the technical levels provided has been achieved and is subject to the factors discussed above.
Note 4: Dividend Yield may vary as per the stock price movement.
Note 5: Kalkine reports are prepared based on the stock prices captured either from REFINITIV or Trading View. Typically, REFINITIV or Trading View may reflect stock prices with a delay which could be a lag of 25-30 minutes. There can be no assurance that future results or events will be consistent with the information provided in the report. The information is subject to change without any prior notice.
Technical Indicators Defined: -
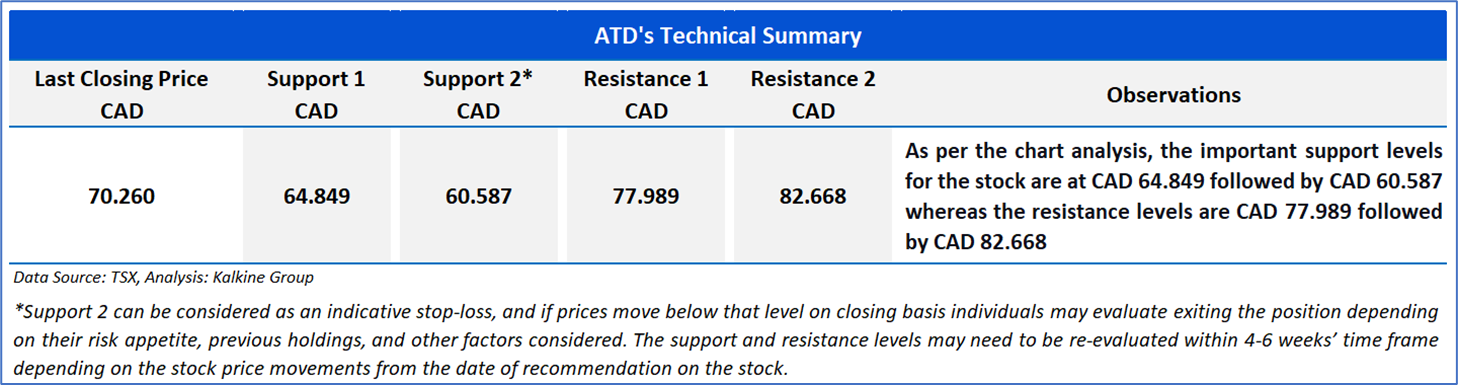
Support: A level at which the stock prices tend to find support if they are falling, and a downtrend may take a pause backed by demand or buying interest.
Resistance: A level at which the stock prices tend to find resistance when they are rising, and the uptrend may take a pause due to profit booking or selling interest.
Stop-loss: In general, it is a level to protect further losses in case of any unfavourable movement in the stock prices.
Past performance is not a reliable indicator of future performance.

 Please wait processing your request...