Section 1: Company Overview and Fundamentals
1.1 Company Overview:
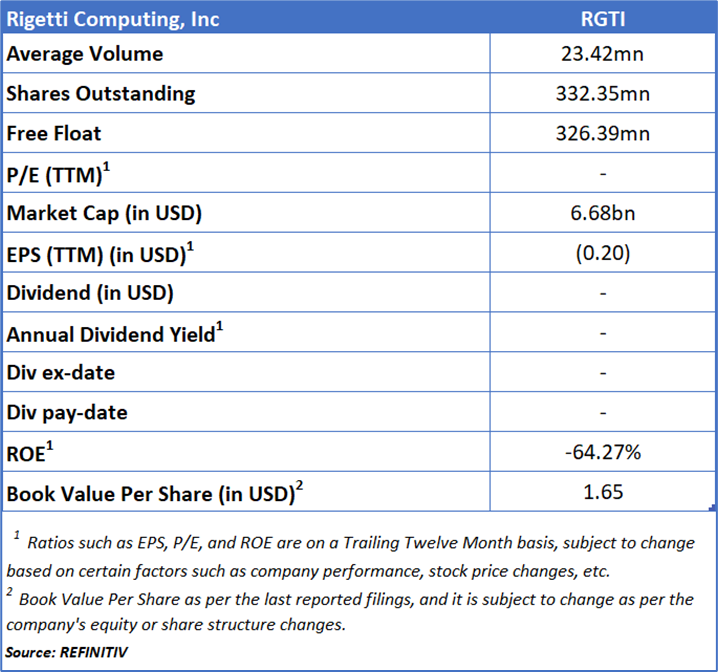
Rigetti Computing, Inc (NASDAQ: RGTI) is a full-stack quantum computing company that develops and operates superconducting quantum computers for enterprise, government, and research customers. The company provides cloud-based quantum computing access through its Rigetti Quantum Cloud Services (QCS) and QCaaS platforms, enabling integration with public, private, and hybrid cloud environments. Rigetti also designs and manufactures quantum processing units (QPUs) and related components in-house at its Fab-1 quantum device manufacturing facility, supporting scalable quantum computing systems through its proprietary multi-chip architecture.
Kalkine’s Diversified Opportunities Report covers the Company Overview, Key positives & negatives, Investment summary, Key investment metrics, Top 10 shareholding, Business updates and insights into company recent financial results, Key Risks & Outlook, Price performance and technical summary, Target Price, and Recommendation on the stock.
Stock Performance:
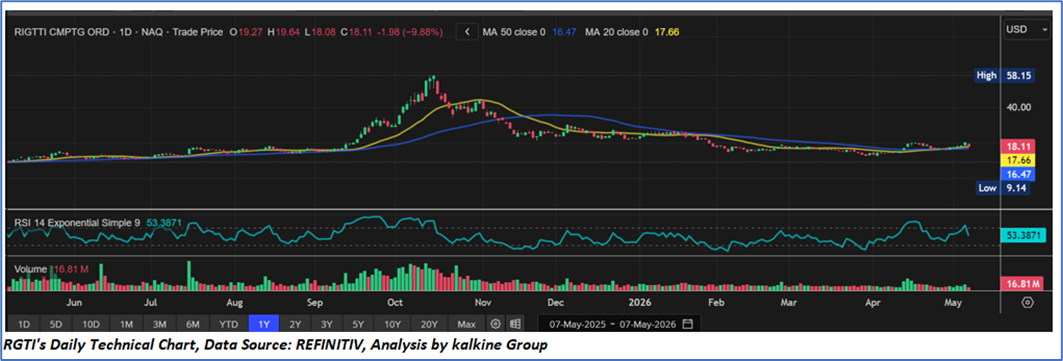
- Rigetti Computing appears to be stabilizing after an extended corrective phase that followed its sharp rally in late 2025.
- The stock is currently trading above both the 20-day and 50-day moving averages, indicating improving short-term momentum and gradual strengthening in trend structure.
- The narrowing gap between the moving averages and recent price consolidation suggest that selling pressure has moderated, while buyers are attempting to regain control near current levels.
- The RSI is positioned around 53, reflecting strengthening bullish momentum without entering deeply overbought territory, which may support additional near-term upside potential.
- Trading volumes remain relatively moderate compared with the earlier high-volatility period, indicating that the recent recovery is developing in a more controlled manner.
- Despite the recent improvement, the stock continues to trade well below its prior peak near USD 58, implying that a stronger long-term trend reversal would require a decisive breakout above key resistance levels.
- Overall, the emergence of a higher-lows structure and improving momentum indicators point toward a constructive near-term outlook, although failure to sustain above current support levels could lead to renewed consolidation pressure.
1.2 The Key Positives, Negatives, and Investment summary
1.3 Top 10 shareholders:
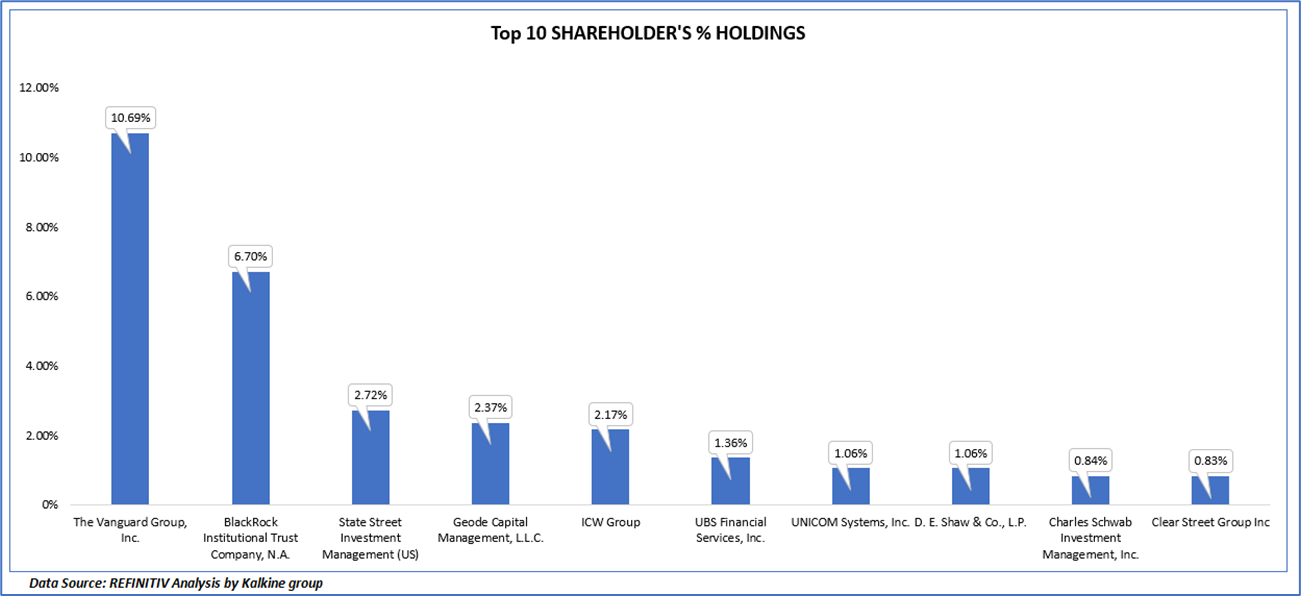
The top 10 shareholders together form ~ 29.82% of the total shareholding, signifying concentrated shareholding. The Vanguard Group, Inc. and BlackRock Institutional Trust Company, N.A. are the biggest shareholders, holding the maximum stake in the company at 10.69% and 6.70%, respectively.
1.4 Key Metrics:
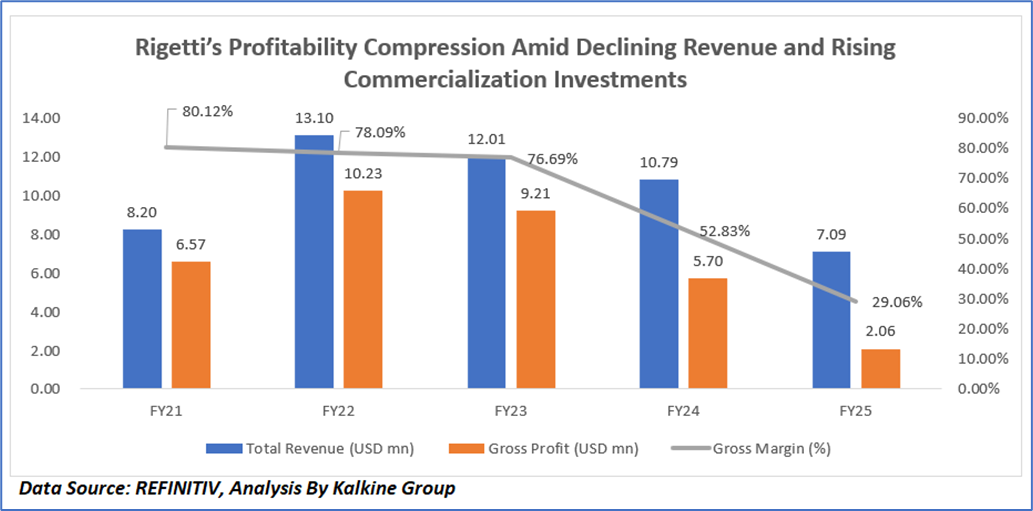
Rigetti’s Profitability Compression Amid Declining Revenue and Rising Commercialization Investments
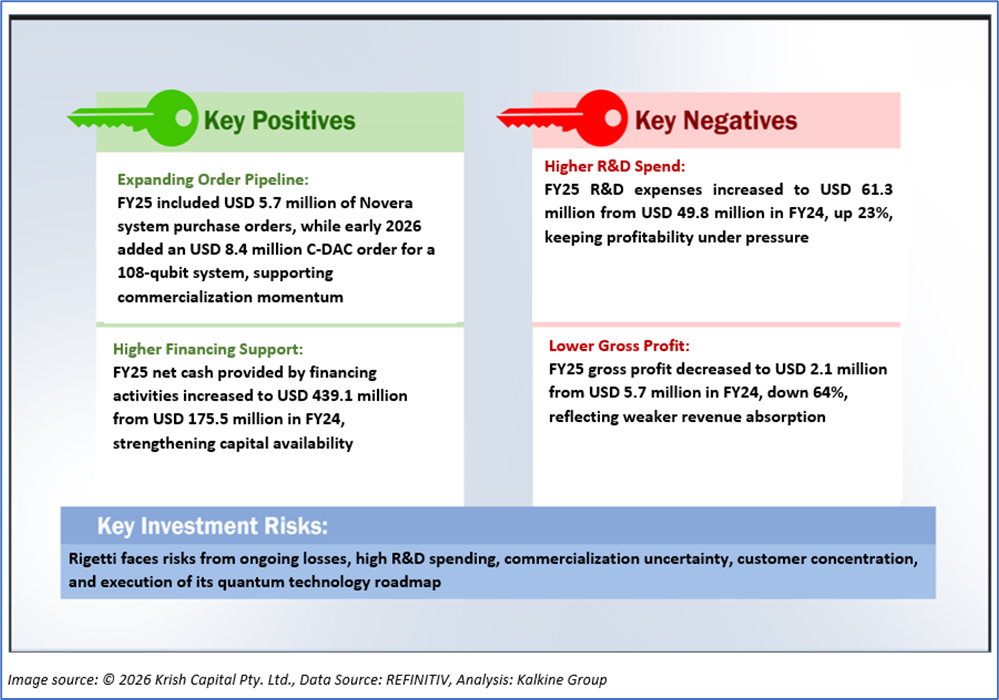
- Rigetti’s financial performance over FY21–FY25 reflects a transition from early commercialization momentum toward a more investment-intensive scaling phase within the quantum computing industry. Revenue increased from USD 8.20 million in FY21 to USD 13.10 million in FY22, driven by collaborative research contracts, technology development agreements, and rising interest in quantum computing applications, before declining to USD 12.01 million in FY23, USD 10.79 million in FY24, and USD 7.09 million in FY25 due to weaker research and professional services revenue, variability in government and enterprise contracts, and timing-related fluctuations in quantum system and Novera product sales.
- Gross profit followed a similar pattern, rising from USD 6.57 million in FY21 to USD 10.23 million in FY22 before declining steadily to USD 9.21 million in FY23, USD 5.70 million in FY24, and USD 2.06 million in FY25 as lower revenue absorption, higher infrastructure costs, and continued investments in quantum hardware and cloud platform development weighed on profitability.
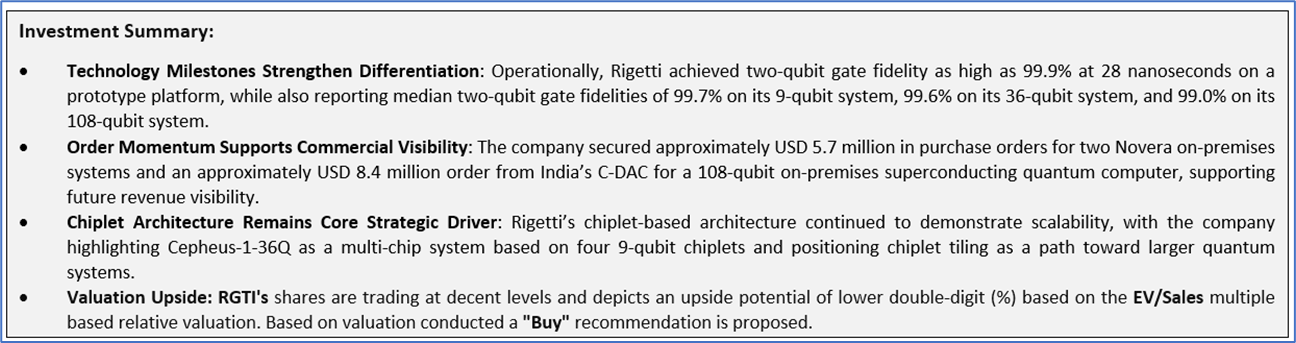
- Consequently, gross margin compressed from 80.12% in FY21 to 78.09% in FY22 and 76.69% in FY23, before falling sharply to 52.83% in FY24 and 29.06% in FY25, reflecting increasing R&D spending, chip fabrication costs, manufacturing scale-up initiatives, and commercialization efforts, alongside reduced contribution from higher-margin collaborative contracts and limited Novera sales. Overall, the trend underscores Rigetti’s shift from an R&D-focused company toward broader commercialization and deployment of scalable quantum systems, with near-term financial pressure offset by continued technological progress in chiplet architecture, gate fidelity improvements, and expanding on-premises system orders.
Section 2: Business Updates and Corporate Business Highlights
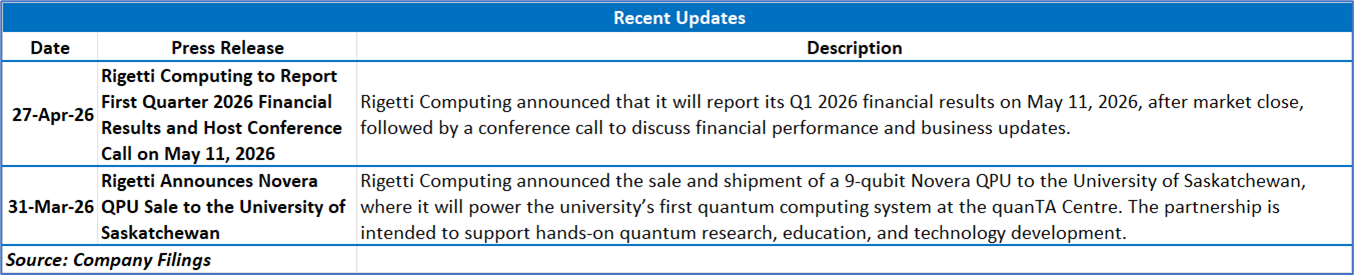
2.1 Recent Business Updates
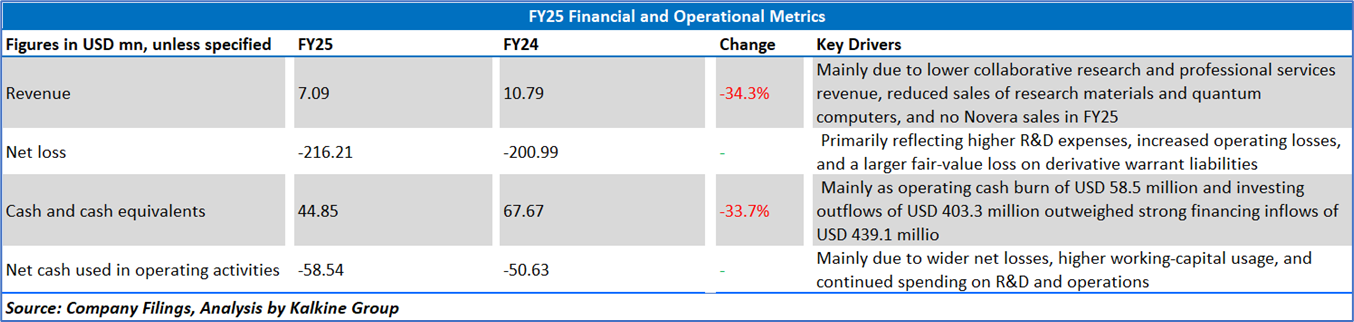
2.2 Insights of FY25:
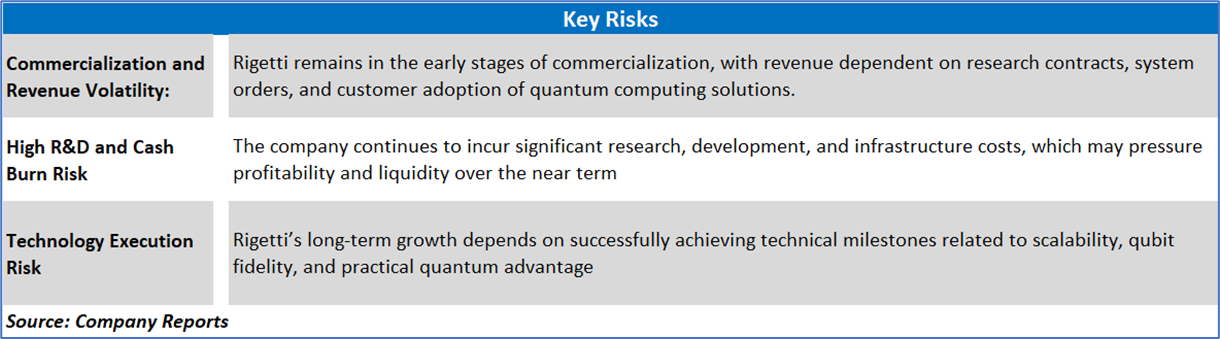
Section 3: Key Risks & Outlook
Section 4: Stock Recommendation Summary:
4.1 Price Performance and Technical Summary:
Stock Performance:
- Rigetti Computing appears to be stabilizing after an extended corrective phase that followed its sharp rally in late 2025.
- The stock is currently trading above both the 20-day and 50-day moving averages, indicating improving short-term momentum and gradual strengthening in trend structure.
- The narrowing gap between the moving averages and recent price consolidation suggest that selling pressure has moderated, while buyers are attempting to regain control near current levels.
- The RSI is positioned around 53, reflecting strengthening bullish momentum without entering deeply overbought territory, which may support additional near-term upside potential.
- Trading volumes remain relatively moderate compared with the earlier high-volatility period, indicating that the recent recovery is developing in a more controlled manner.
- Despite the recent improvement, the stock continues to trade well below its prior peak near USD 58, implying that a stronger long-term trend reversal would require a decisive breakout above key resistance levels.
- Overall, the emergence of a higher-lows structure and improving momentum indicators point toward a constructive near-term outlook, although failure to sustain above current support levels could lead to renewed consolidation pressure.
4.2 Fundamental Valuation
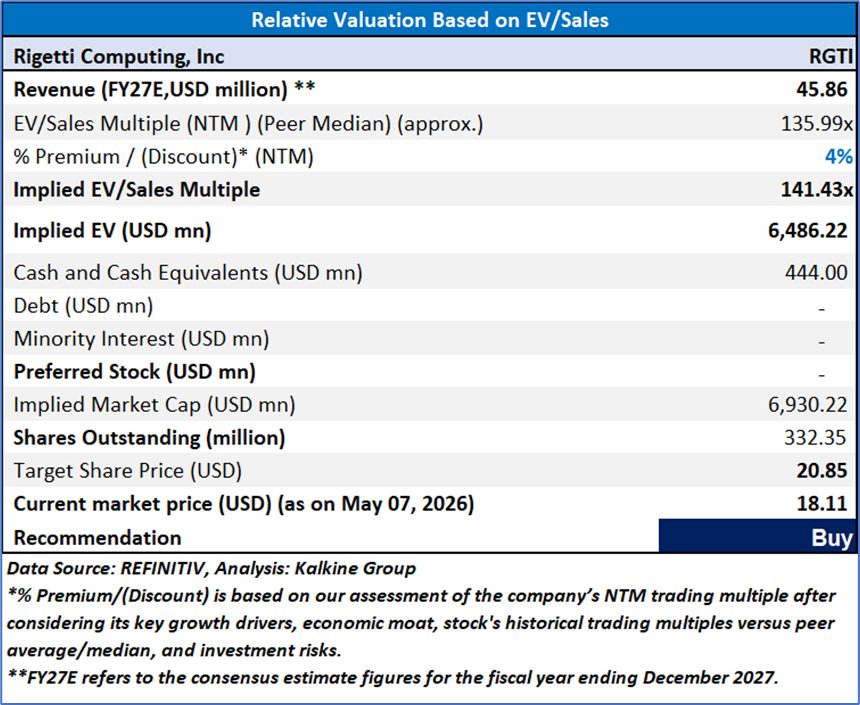
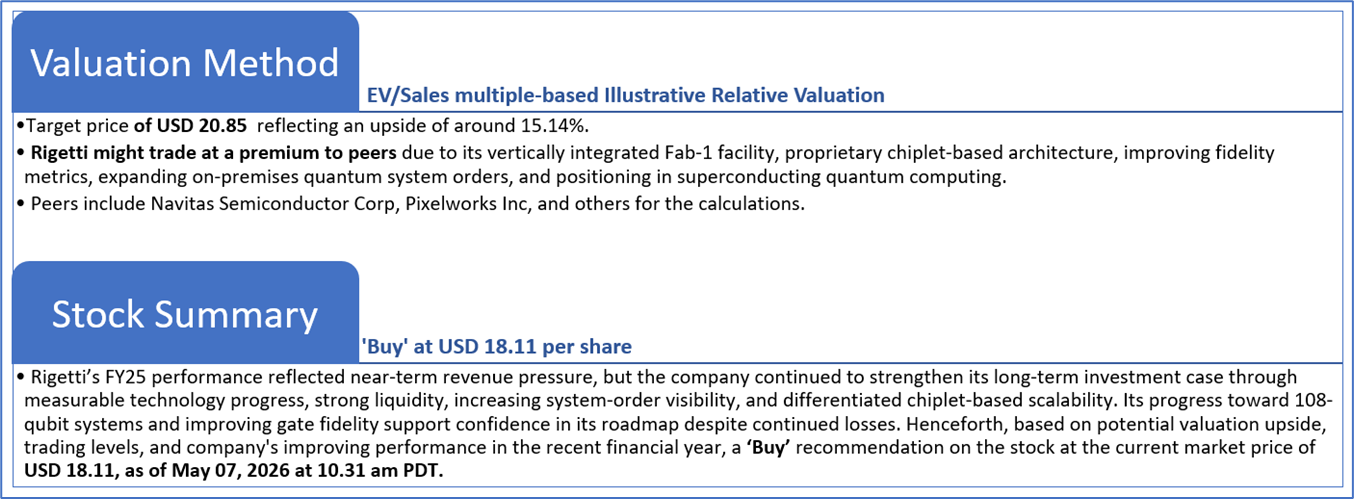
Valuation Methodology: EV/Sales Multiple Based Relative Valuation
Markets are trading in a highly volatile zone currently due to certain macroeconomic issues and geopolitical tensions prevailing. Therefore, it is prudent to follow a cautious approach while investing.
Note 1: Past performance is not a reliable indicator of future performance.
Note 2: The reference date for all price data, currency, technical indicators, support, and resistance levels is May 07, 2026. The reference data in this report has been partly sourced from REFINITIV.
Note 3: Investment decisions should be made depending on an individual's appetite for upside potential, risks, holding duration, and any previous holdings. An 'Exit' from the stock can be considered if the Target Price mentioned as per the Valuation and or the technical levels provided has been achieved and is subject to the factors discussed above.
Note 4: The report publishing date is as per the Pacific Time Zone.
Technical Indicators Defined: -
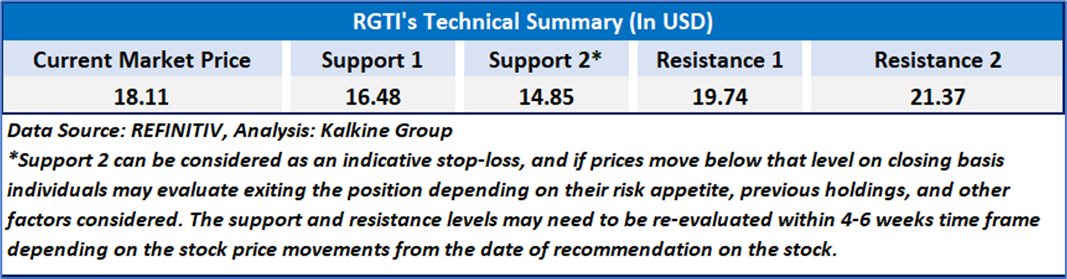
Support: A level at which the stock prices tend to find support if they are falling, and a downtrend may take a pause backed by demand or buying interest. Support 1 refers to the nearby support level for the stock and if the price breaches the level, then Support 2 may act as the crucial support level for the stock.
Resistance: A level at which the stock prices tend to find resistance when they are rising, and an uptrend may take a pause due to profit booking or selling interest. Resistance 1 refers to the nearby resistance level for the stock and if the price surpasses the level, then Resistance 2 may act as the crucial resistance level for the stock.
Stop-loss: It is a level to protect against further losses in case of unfavorable movement in the stock prices.
Past performance is not a reliable indicator of future performance.

 NZ
 UK
 US
 AU
 IND

 CA

 Please wait processing your request...