Section 1: Company Overview and Fundamentals
Company Overview:
Riot Platforms, Inc. (NASDAQ: RIOT) is a Bitcoin mining and digital infrastructure company. The Company has Bitcoin mining operations in central Texas and Kentucky, and electrical engineering and fabrication operations in Denver, Colorado, and Houston, Texas. It operates a Bitcoin-driven infrastructure platform. Its segments include Bitcoin Mining and Engineering.
Kalkine’s American Tech Report covers the Company Overview, Key positives & negatives, Investment summary, Key investment metrics, Top 10 shareholding, Business updates and insights into company recent financial results, Key Risks & Outlook, Price performance and technical summary, Target Price, and Recommendation on the stock.
Price Performance & Technical Analysis:
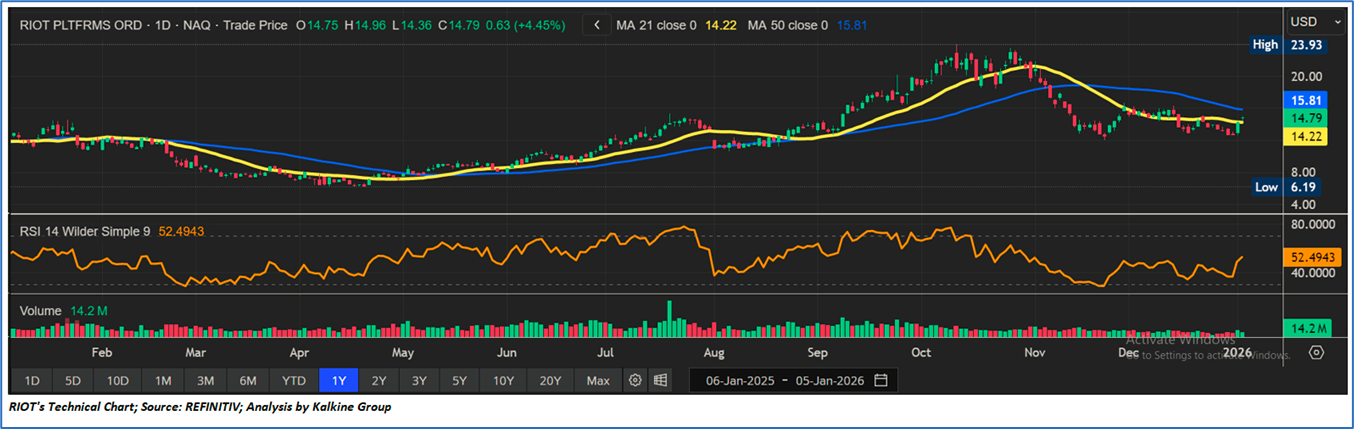
- Trend Structure and Price Action: Riot Platforms, Inc. show signs of stabilization after a corrective decline from its October peak near USD 23.9. Recent price action has consolidated in the USD 14.5–15.0 range, suggesting base-building behavior, although the broader trend remains neutral to mildly bearish.
- Moving Averages and Momentum: The stock is trading slightly above its 21-day moving average (~USD 14.2) but remains below the 50-day moving average (~USD 15.8), indicating short-term stabilization within a constrained medium-term trend. The RSI near 52 reflects neutral momentum, consistent with consolidation rather than a confirmed trend reversal.
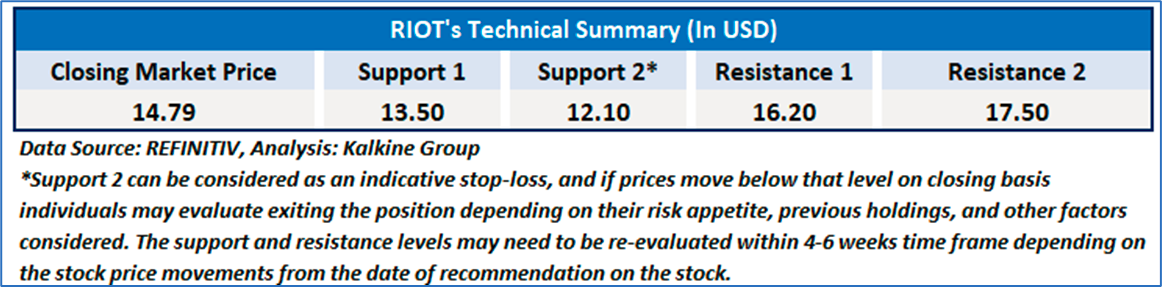
- Volume, Support–Resistance, and Outlook: Subdued volumes indicate limited conviction in the recent rebound. Key support lies around USD 13.5–14.0, while resistance is concentrated near USD 15.8–16.0 and then USD 20–21. Overall, the technical outlook remains range-bound, with upside confirmation dependent on a sustained breakout above resistance with stronger volume.
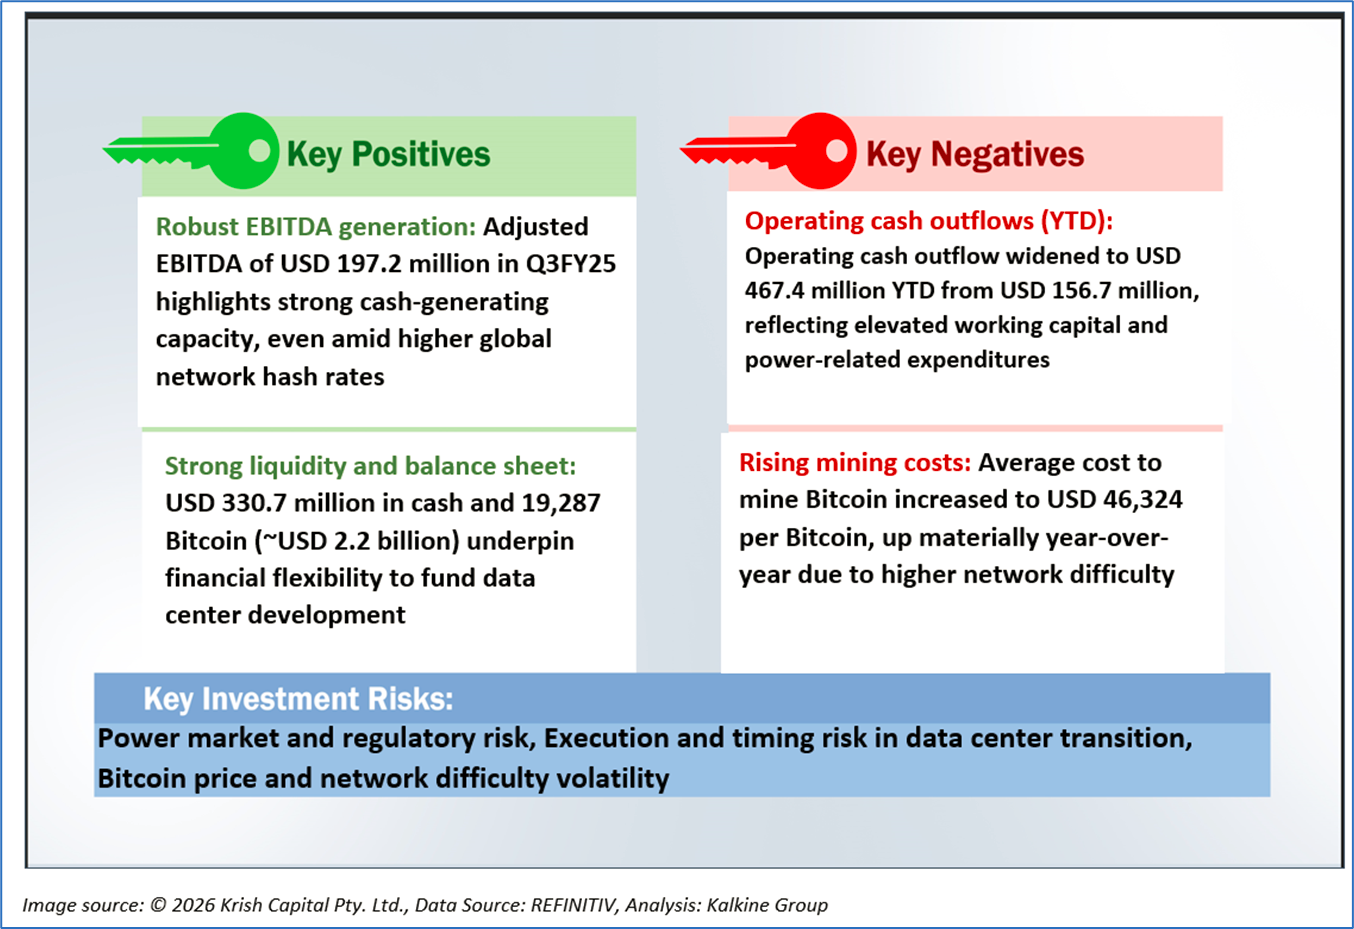
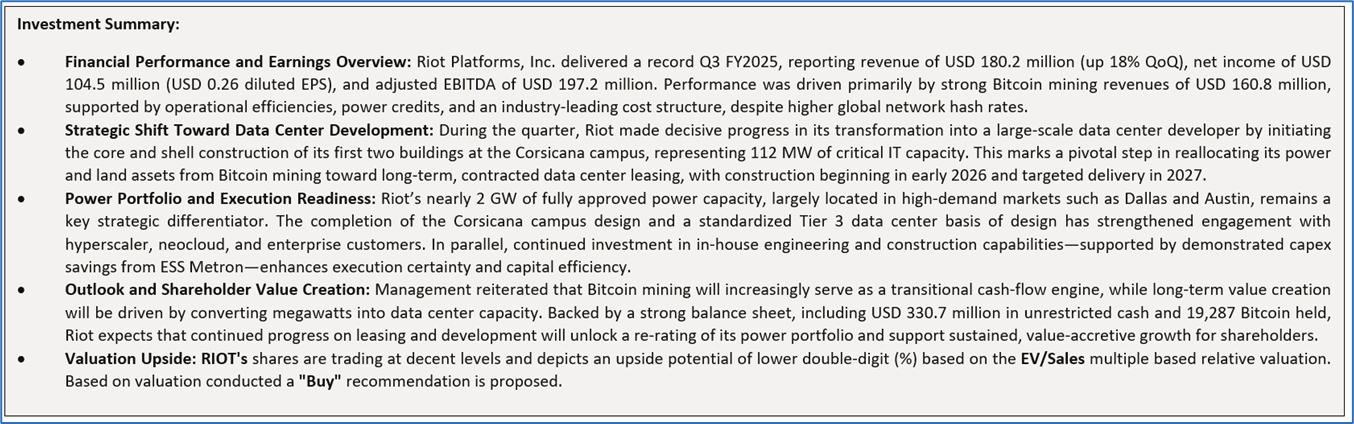
1.2 The Key Positives, Negatives, and Investment summary
1.3 Top 10 shareholders:
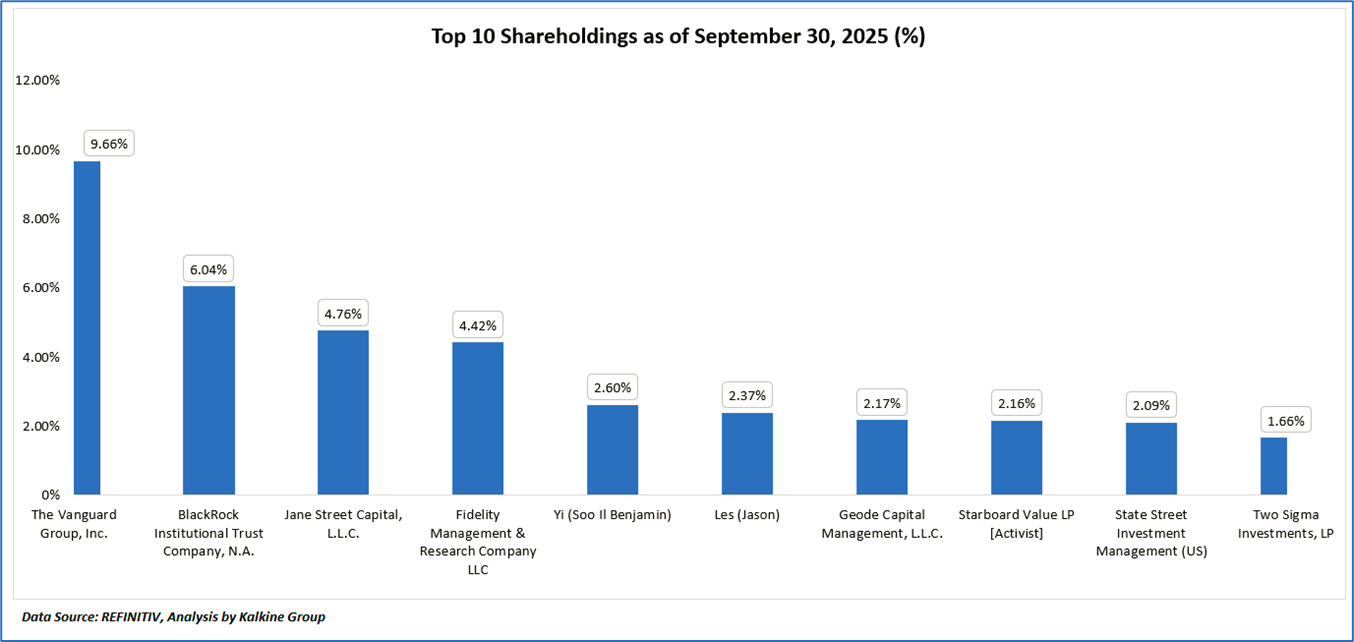
The top 10 shareholders together form ~37.91% of the total shareholding, signifying concentrated shareholding. The Vanguard Group, Inc., and BlackRock Institutional Trust Company, N.A. are the biggest shareholders, holding the maximum stake in the company at ~9.66% and ~6.04%, respectively.
1.4 Key Metrics
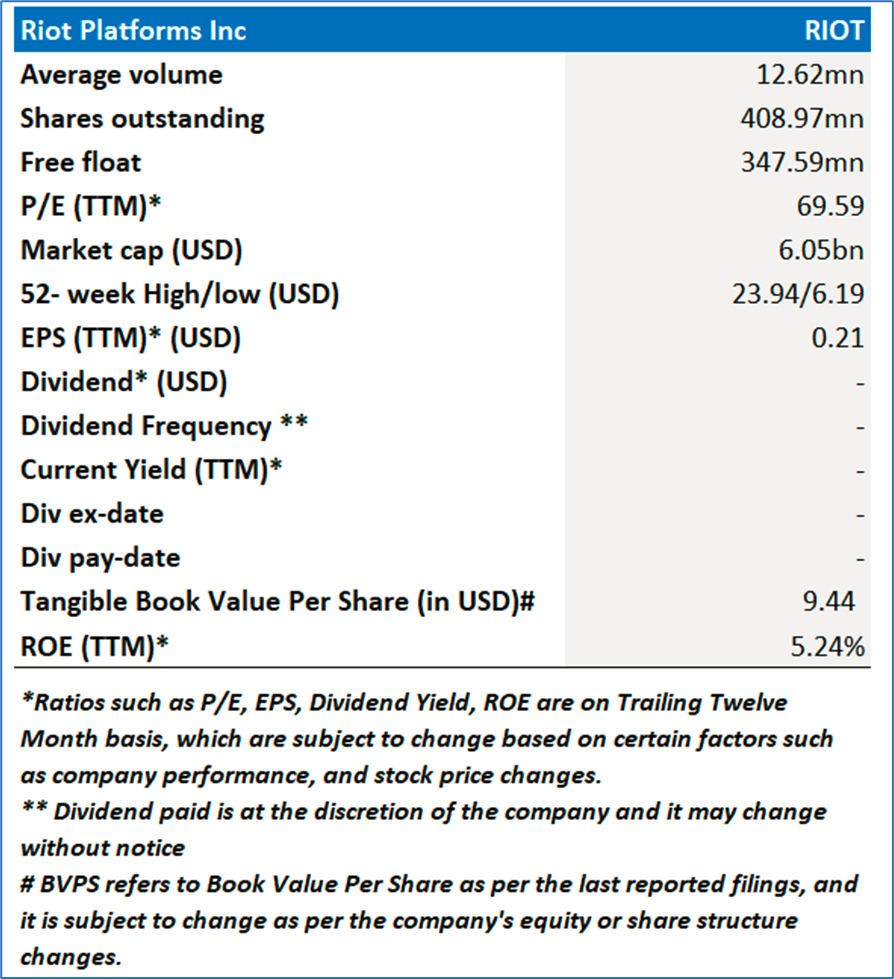
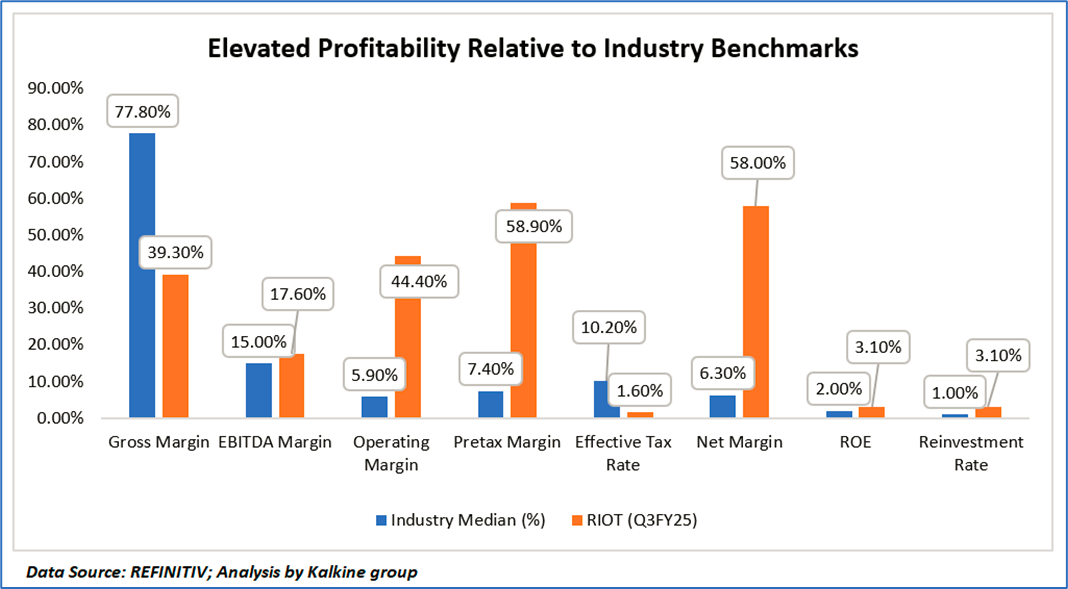
Riot Platforms, Inc. demonstrates markedly superior profitability metrics versus industry medians in Q3 FY2025, with operating, pretax, and net margins of 44.4%, 58.9%, and 58.0%, respectively, significantly outperforming sector norms and reflecting the impact of strong Bitcoin price realization, operating leverage, and gains on digital assets. While gross margin at 39.3% trails the industry median, downstream margins expand materially due to low operating costs, power credits, and limited tax leakage, evidenced by a notably low 1.6% effective tax rate. EBITDA margin of 17.6% exceeds the industry benchmark, indicating resilient core cash profitability, while modestly higher ROE (3.1%) and reinvestment rate (3.1%) versus peers suggest disciplined capital deployment with improving returns. Overall, the margin profile underscores a highly favorable earnings period, albeit one partially influenced by non-operating factors and inherently linked to Bitcoin market dynamics.
Section 2: Business Updates and Financial Highlights
2.1 Recent Updates:
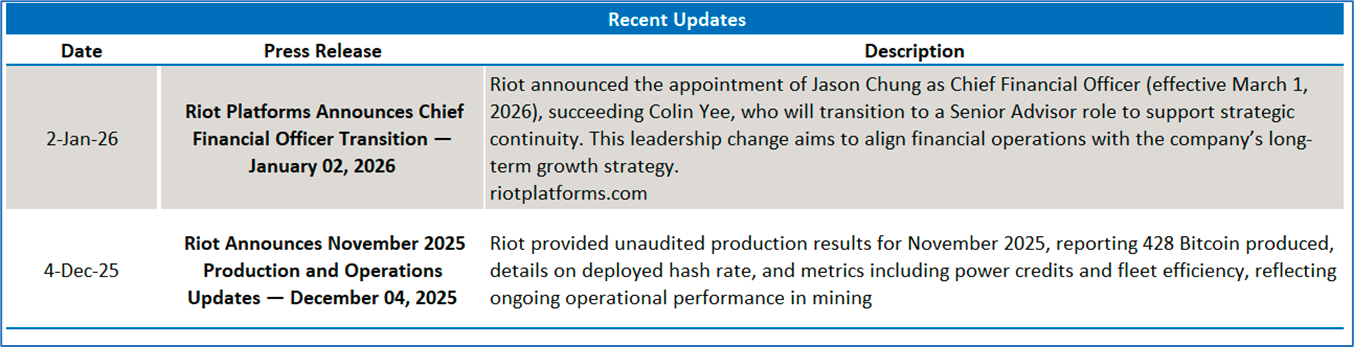
The below picture gives an overview of the recent updates:
2.2 Insights of Q3FY25:
Section 3: Key Risks and Outlook:
Section 4: Stock Recommendation Summary:
4.1 Technical Summary:
Price Performance:
- Trend Structure and Price Action: Riot Platforms, Inc. is showing signs of stabilization after a corrective decline from its October peak near USD 23.9. Recent price action has consolidated in the USD 14.5–15.0 range, suggesting base-building behavior, although the broader trend remains neutral to mildly bearish.
- Moving Averages and Momentum: The stock is trading slightly above its 21-day moving average (~USD 14.2) but remains below the 50-day moving average (~USD 15.8), indicating short-term stabilization within a constrained medium-term trend. The RSI near 52 reflects neutral momentum, consistent with consolidation rather than a confirmed trend reversal.
- Volume, Support–Resistance, and Outlook: Subdued volumes indicate limited conviction in the recent rebound. Key support lies around USD 13.5–14.0, while resistance is concentrated near USD 15.8–16.0 and then USD 20–21. Overall, the technical outlook remains range-bound, with upside confirmation dependent on a sustained breakout above resistance with stronger volume.
4.2 Fundamental Valuation
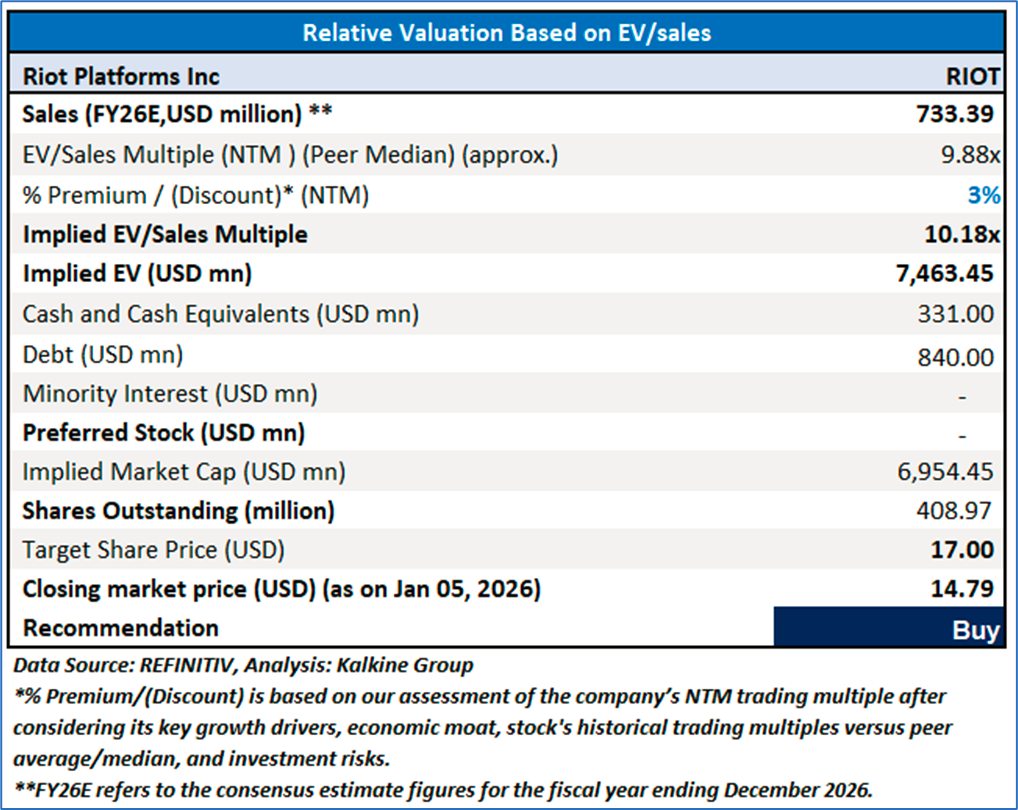
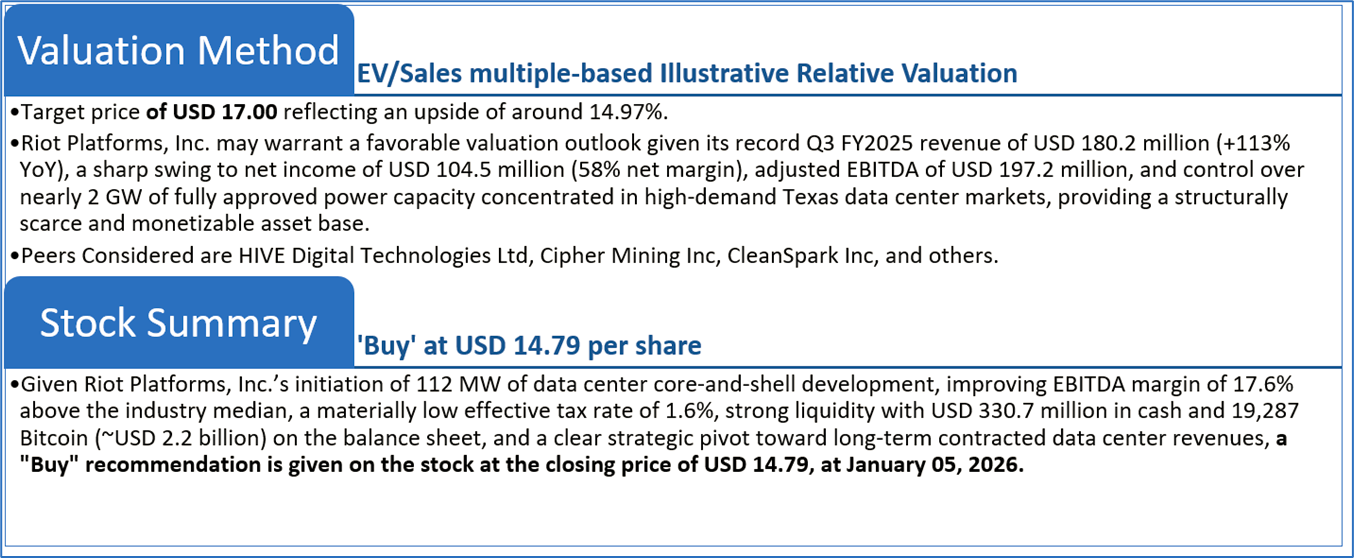
Valuation Methodology: EV/Sales Multiple Based Relative Valuation
Markets are trading in a highly volatile zone currently due to certain macroeconomic issues and geopolitical tensions prevailing. Therefore, it is prudent to follow a cautious approach while investing.
Note 1: Past performance is not a reliable indicator of future performance.
Note 2: The reference date for all price data, currency, technical indicators, support, and resistance levels is January 05, 2026. The reference data in this report has been partly sourced from REFINITIV.
Note 3: Investment decisions should be made depending on an individual's appetite for upside potential, risks, holding duration, and any previous holdings. An 'Exit' from the stock can be considered if the Target Price mentioned as per the Valuation and or the technical levels provided has been achieved and is subject to the factors discussed above.
Note 4: The report publishing date is as per the Pacific Time Zone.
Technical Indicators Defined: -
Support: A level at which the stock prices tend to find support if they are falling, and a downtrend may take a pause backed by demand or buying interest. Support 1 refers to the nearby support level for the stock and if the price breaches the level, then Support 2 may act as the crucial support level for the stock.
Resistance: A level at which the stock prices tend to find resistance when they are rising, and an uptrend may take a pause due to profit booking or selling interest. Resistance 1 refers to the nearby resistance level for the stock and if the price surpasses the level, then Resistance 2 may act as the crucial resistance level for the stock.
Stop-loss: It is a level to protect against further losses in case of unfavorable movement in the stock prices.
Past performance is not a reliable indicator of future performance.

 NZ
 UK
 US
 AU
 IND

 CA

 Please wait processing your request...