Section 1: Introduction
Inflation Report Coverage:
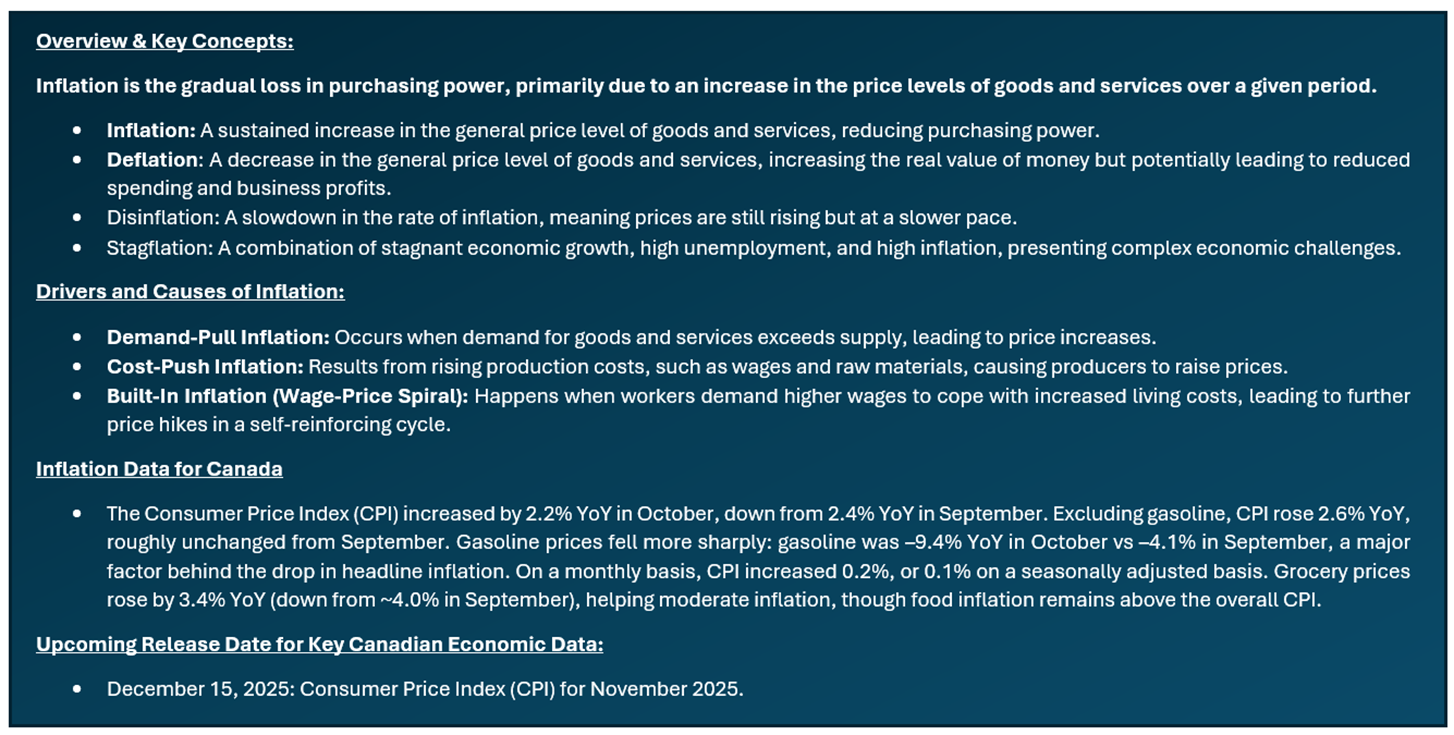
- Inflation report highlights how inflation impacts sectors differently, favoring value and defensive sectors like Energy, Materials, Consumer Staples, Healthcare, Utilities, select Financials, and REITs with inflation-indexed leases, while rate-sensitive sectors like Consumer Discretionary and high-growth Tech typically underperform.
- The report focuses on companies with proven business models, steady financials, high free cash flow, and solid ROE that can pass on costs to customers and protect margins. The aim is to identify stocks that can outperform inflation via capital gains and dividends, supporting diversified sectoral exposure.
Stocks Covered:
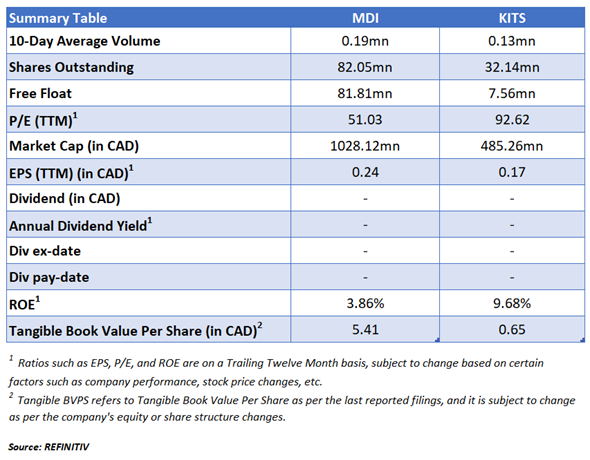
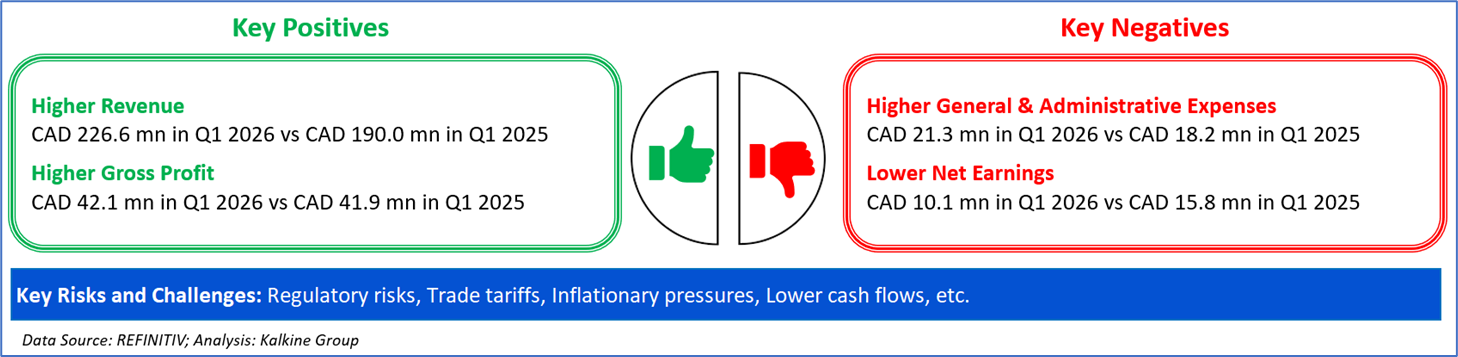
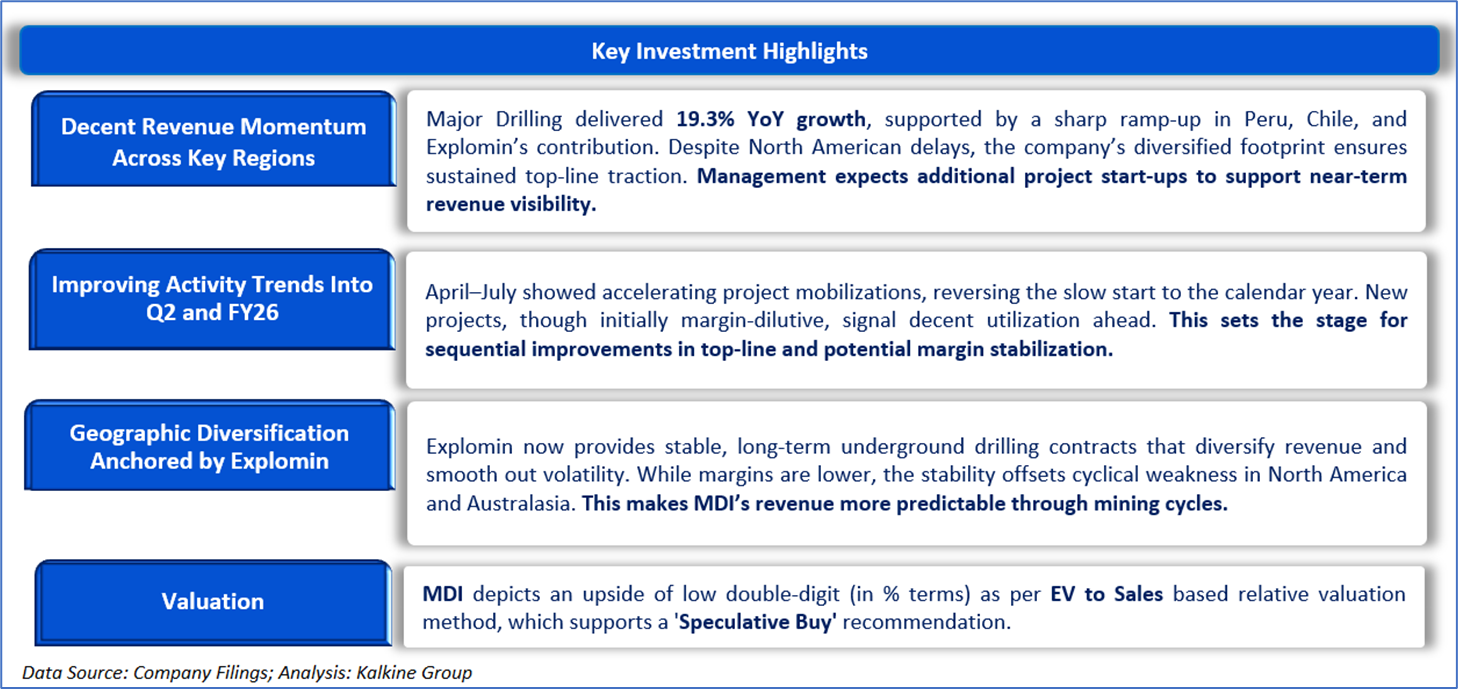
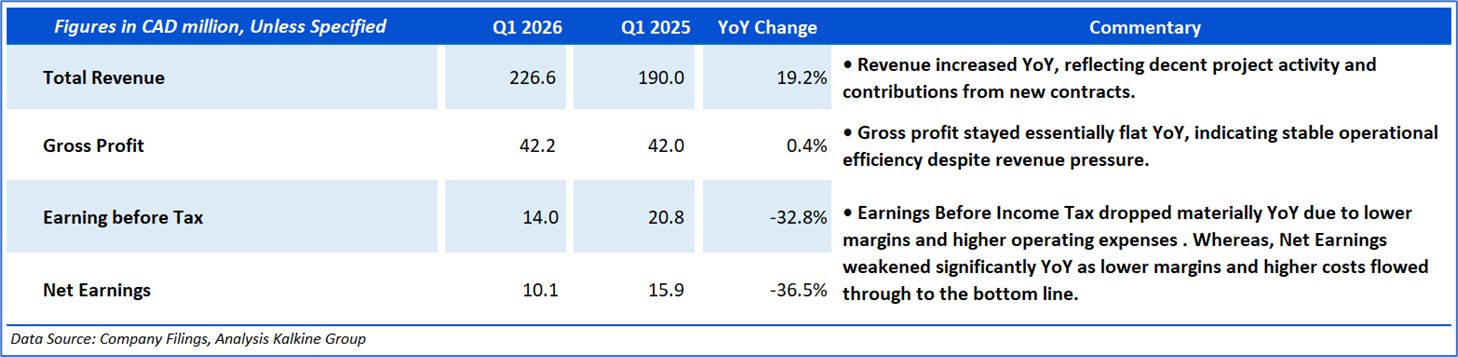
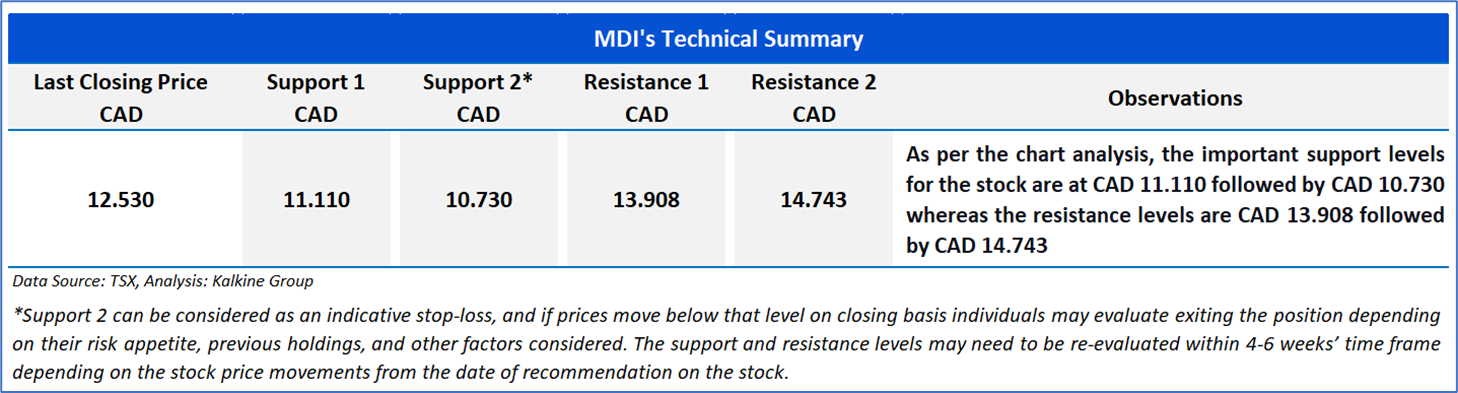
- Major Drilling Group International (TSX: MDI) delivered a decent Q1 2026 topline performance with 19% YoY revenue growth and stable gross profit, though higher operating costs pressured margins, resulting in lower earnings and profitability despite improving project activity.
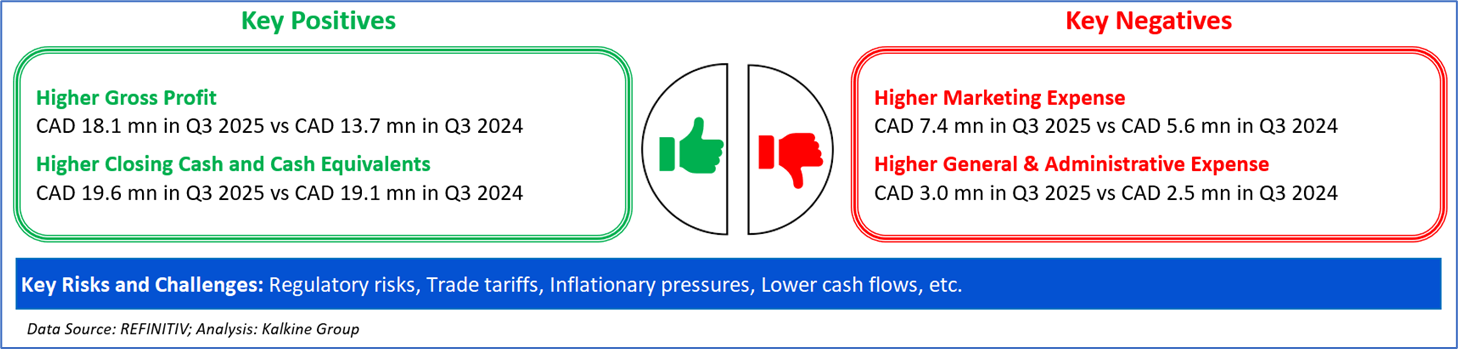
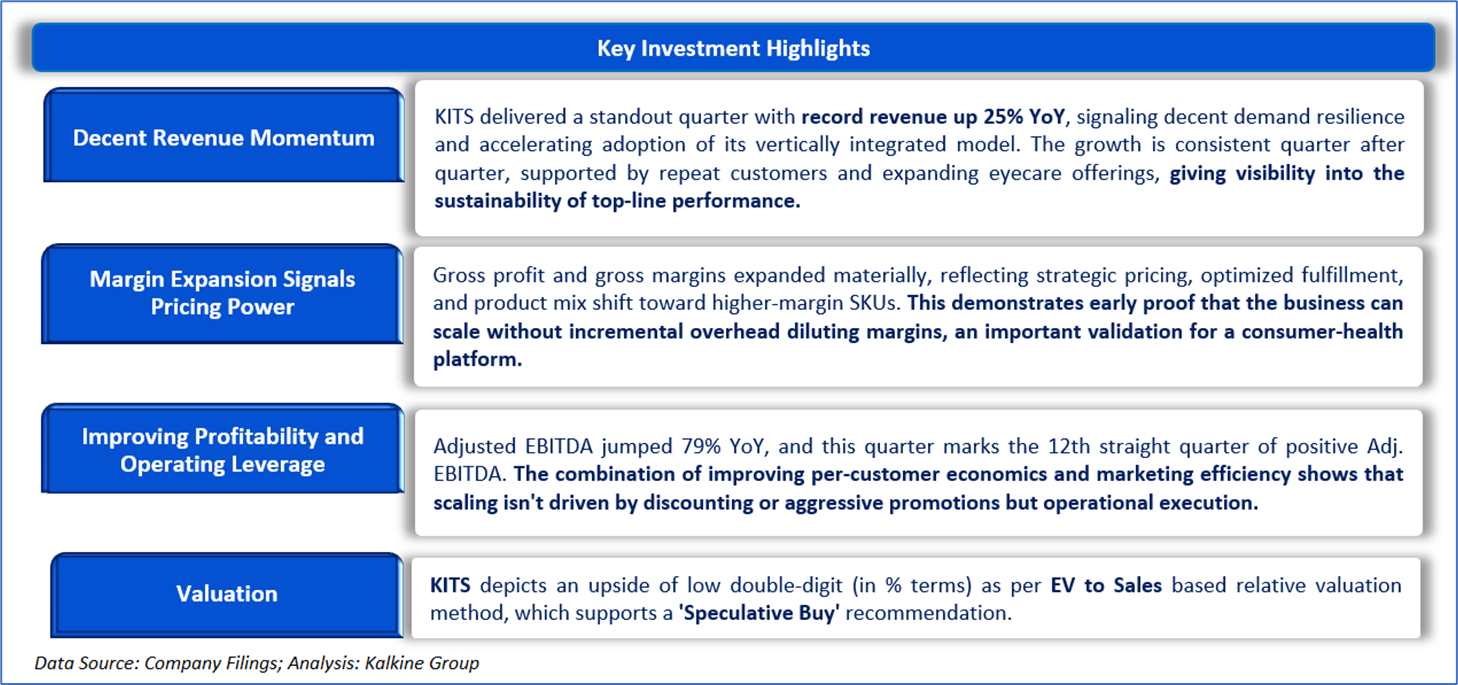
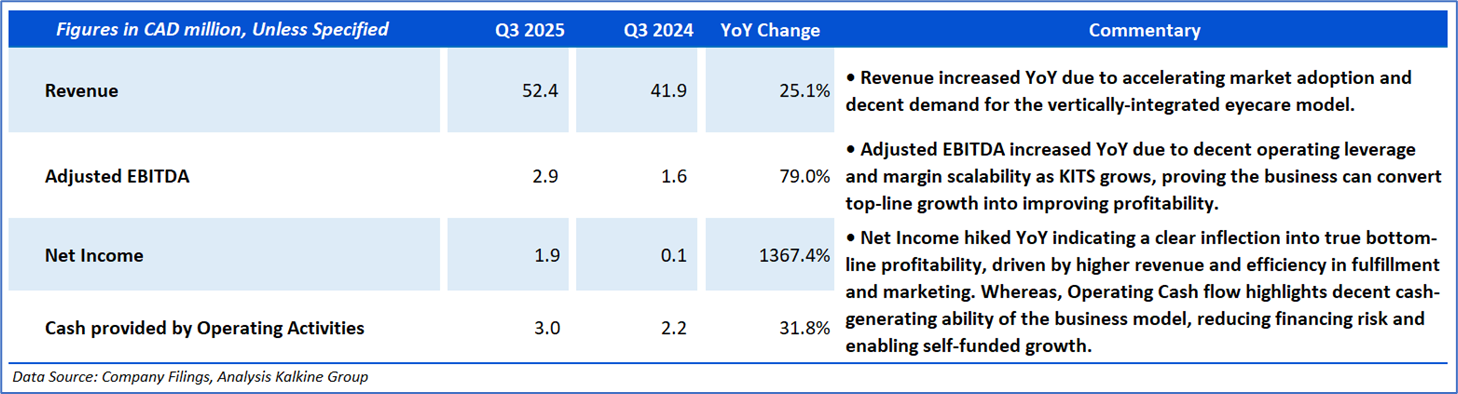
- Kits Eyecare Ltd. (TSX: KITS) delivered a decent Q3 2025, with revenue rising 25.1% to CAD 52.4 mn and net income jumping to CAD 1.9 mn from CAD 0.1 mn a year ago. Profitability continued to expand with Adjusted EBITDA up 79% to CAD 2.9 mn, while operating cash flow increased 31.8% as the company benefited from healthy customer growth, improved fulfillment efficiency, and higher margins across its glasses and contact lenses portfolio.
Section 2: Company Overview
Major Drilling Group International Inc (TSX: MDI) is engaged in the business of contract drilling, and it provides services to companies that are involved in mining and mineral exploration. It offers surface and underground coring, directional, reverse circulation, sonic, geotechnical, environmental, water-well, coal-bed methane, shallow gas, and underground percussive/long-hole drilling services, as well as various drilling-related mine services. Its geographical segments are Canada - the United States; South and Central America; and Asia and Africa, of which most of its revenue comes from Canada - the United States.
Kalkine’s Inflation Report covers the Investment Highlights, Key Financial Metrics, Risks, Technical Analysis along with the Valuation, Target Price, and Recommendation on the stock.

Section3: Financial Highlights

Section 4: Key Metrics
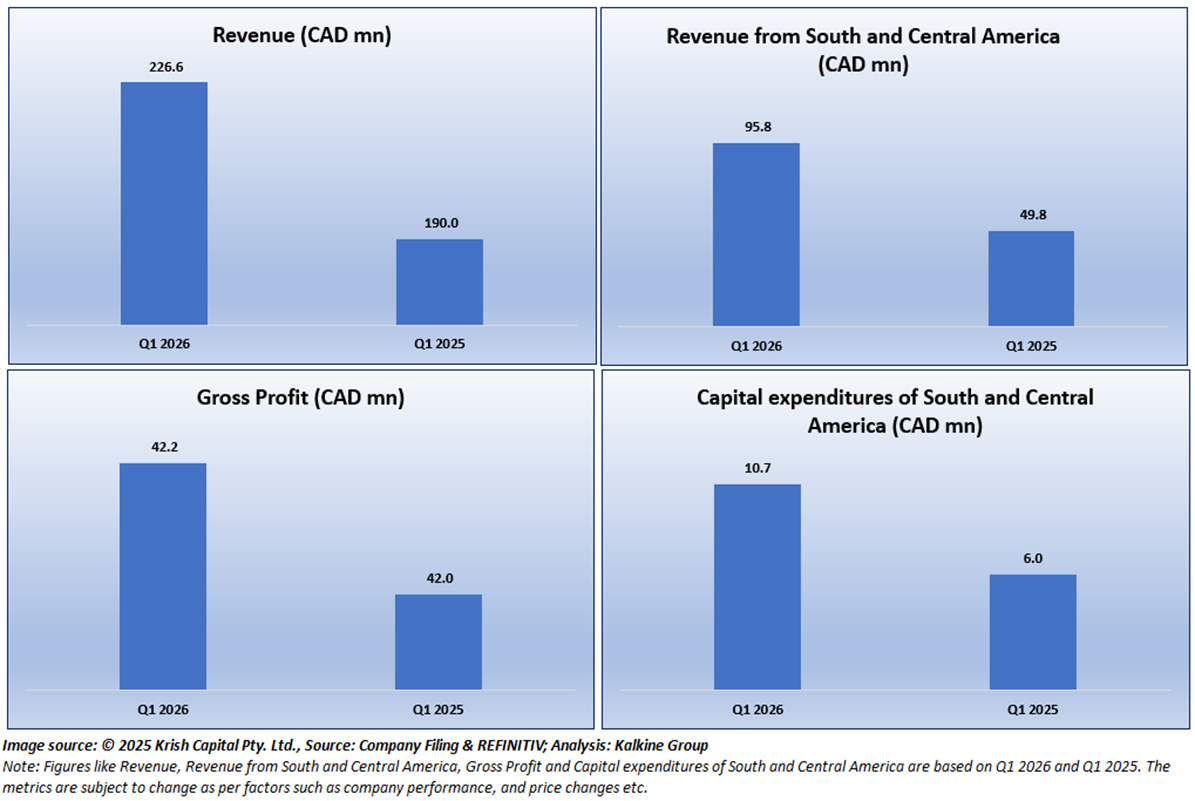
Below chart depicts the change in Revenue, Revenue from South and Central America, Gross Profit and Capital expenditures of South and Central America are based on Q1 2026 and Q1 2025.
Section 5: Stock Recommendation Summary

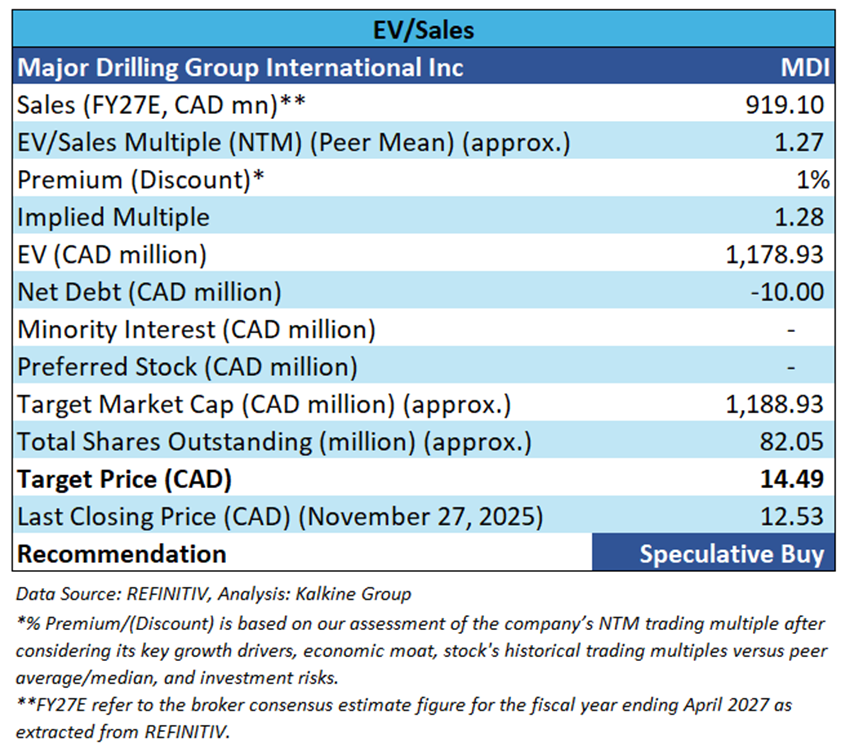
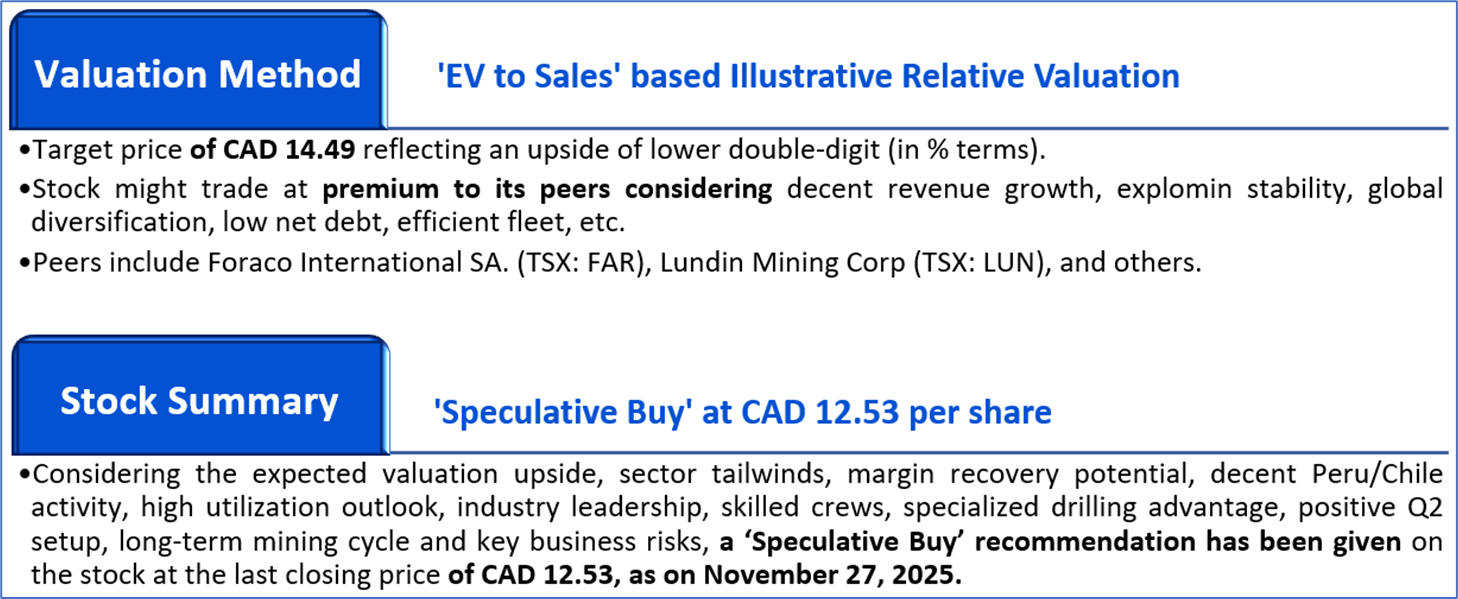
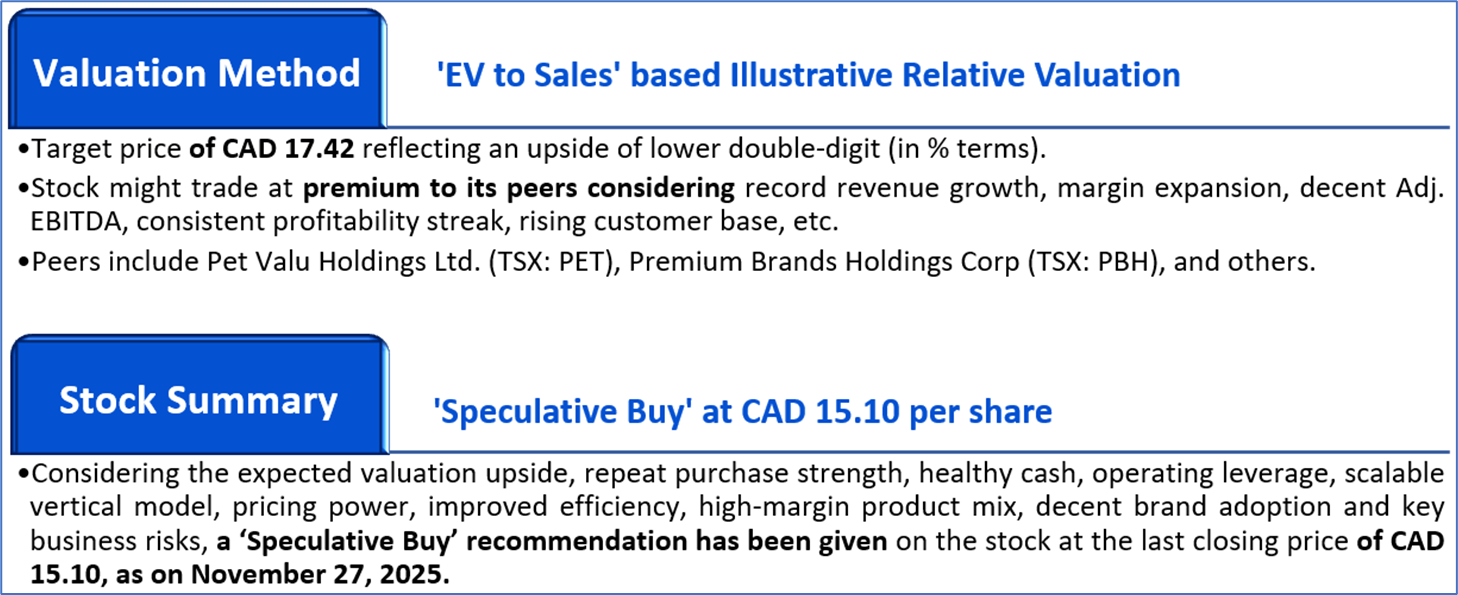
Valuation Methodology: EV to Sales Multiple Based Relative Valuation (Illustrative):


The stock has witnessed an upside of ~6.18% and ~35.90% over the last 1 week and 3 months respectively. Moreover, it is trading above the average 52-week high price of CAD 14.41 and 52-week low price of CAD 6.51, providing an opportunity to ride the trend.

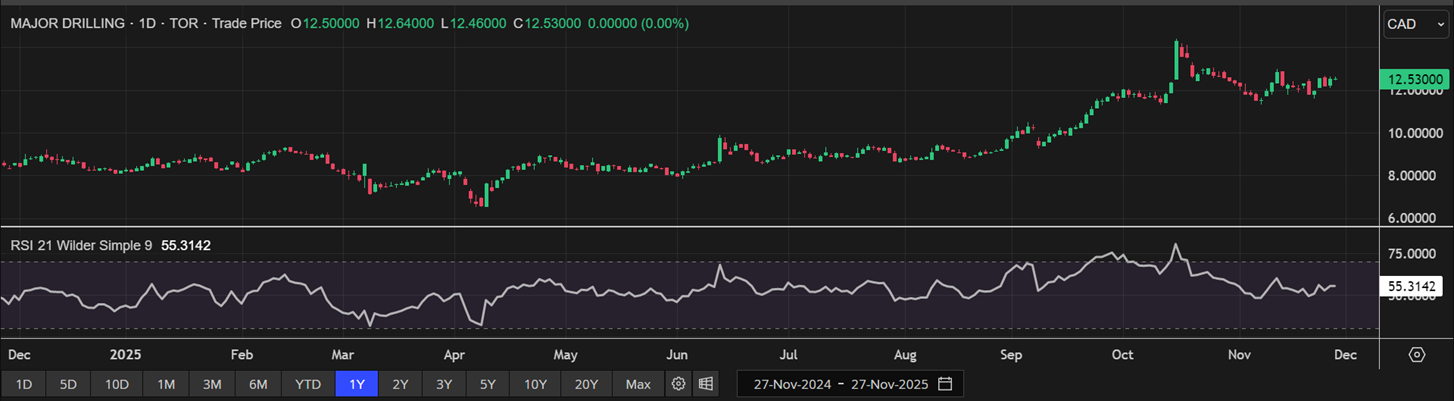
One-Year Technical Price Chart (as of November 27, 2025). Source: REFINITIV, Analysis: Kalkine Group

Section 2: Company Overview
Kits Eyecare Ltd (TSX: KITS) is an online retailer of contact lenses and eyewear. The company's contact lens partners include Acuvue, Alcon, Bausch & Lomb, Biofinity, CooperVision, and Dailies, and glasses partners include Oakley, Prive Revaux, Ray-Ban, and Tom Ford, which enables us to offer our customers best-in-class brands and products in eye care.
Kalkine’s Inflation Report covers the Investment Highlights, Key Financial Metrics, Risks, Technical Analysis along with the Valuation, Target Price, and Recommendation on the stock.

Section3: Financial Highlights

Section 4: Key Metrics
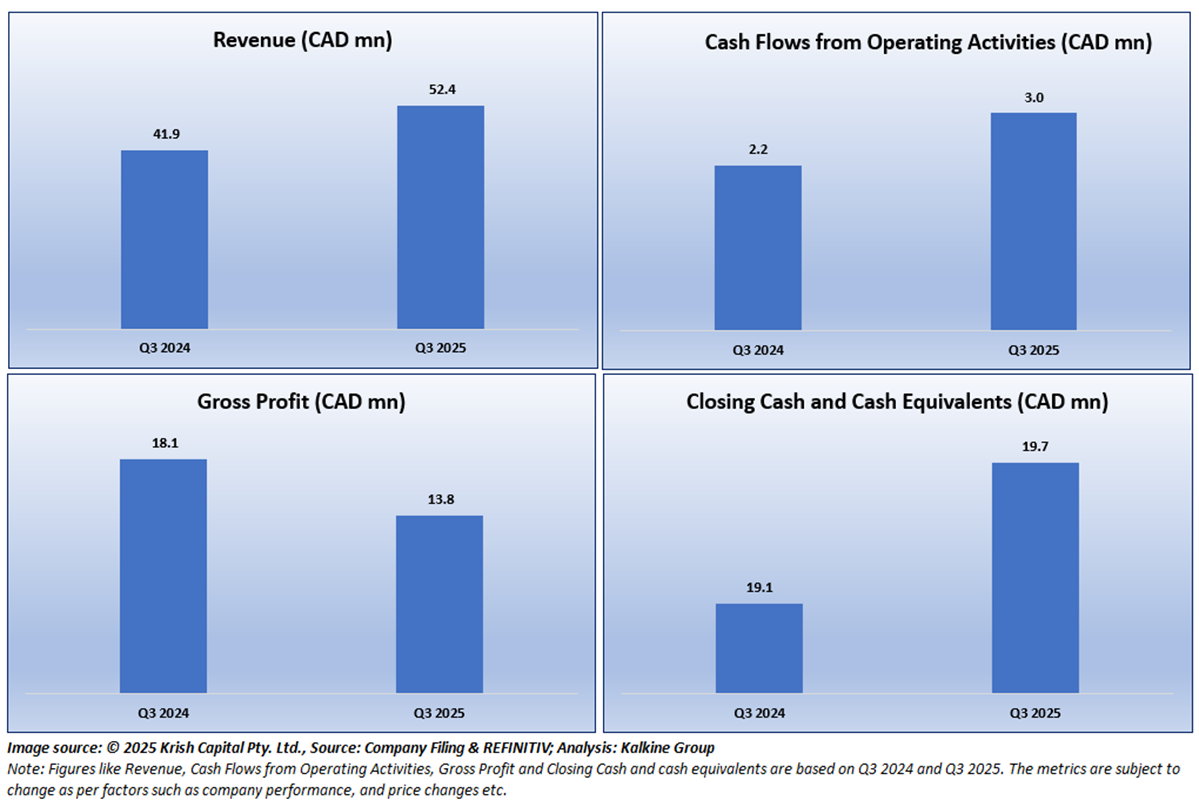
Below chart depicts the changes in Revenue, Cash Flows from Operating Activities, Gross Profit and Closing Cash and cash equivalents are based on Q3 2024 and Q3 2025.
Section 5: Stock Recommendation Summary

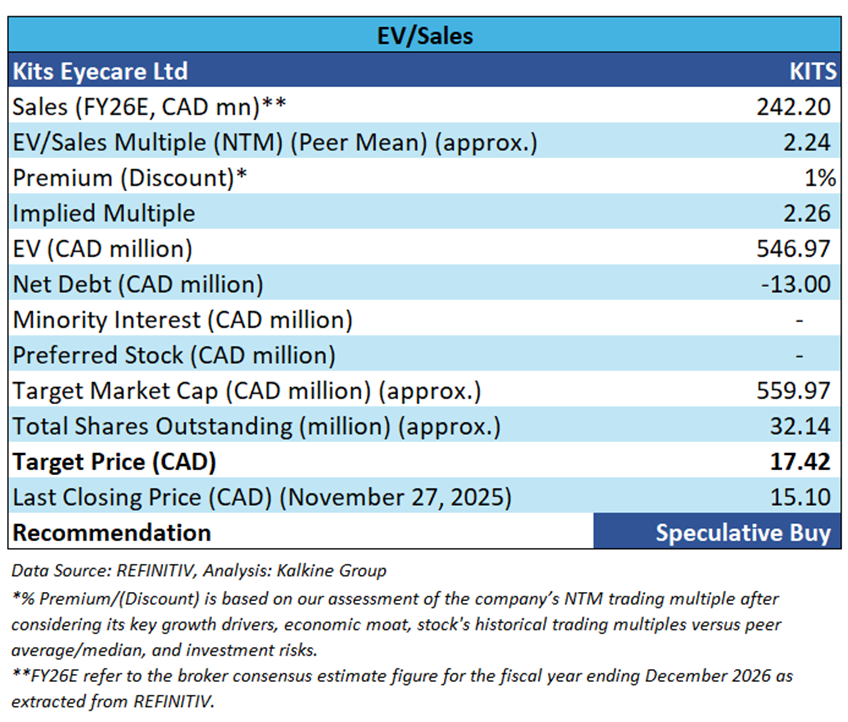
Valuation Methodology: EV to Sales Multiple Based Relative Valuation (Illustrative):


The stock has witnessed an upside of ~11.43% and a downside of ~10.70% over the last 1 week and 3 months respectively. Moreover, it is trading above the average 52-week high price of CAD 18.42 and 52-week low price of CAD 7.13, providing an opportunity to ride the trend.

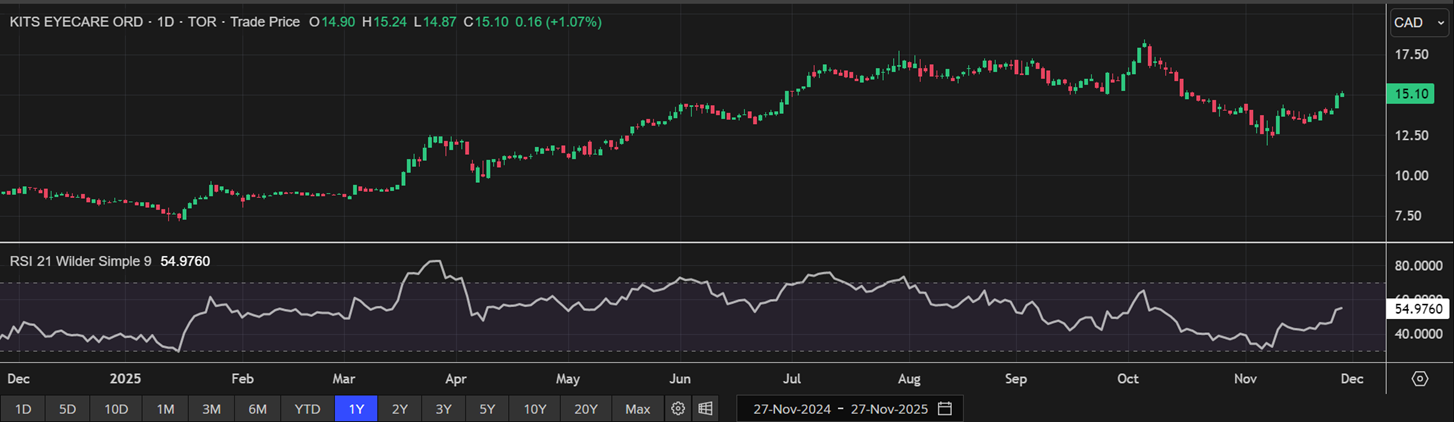
One-Year Technical Price Chart (as of November 27, 2025). Source: REFINITIV, Analysis: Kalkine Group

Note 1: Past performance is not a reliable indicator of future performance.
Note 2: The reference date for all price data, currency, technical indicators, support, and resistance levels is November 27, 2025. The reference data in this report has been partly sourced from REFINITIV.
Note 3: Investment decisions should be made depending on an individual's appetite for upside potential, risks, holding duration, and any previous holdings. An 'Exit' from the stock can be considered if the Target Price mentioned as per the Valuation and or the technical levels provided has been achieved and is subject to the factors discussed above.
Note 4: Dividend Yield may vary as per the stock price movement.
Note 5: Kalkine reports are prepared based on the stock prices captured either from REFINITIV or Trading View. Typically, REFINITIV or Trading View may reflect stock prices with a delay which could be a lag of 25-30 minutes. There can be no assurance that future results or events will be consistent with the information provided in the report. The information is subject to change without any prior notice.
Technical Indicators Defined: -
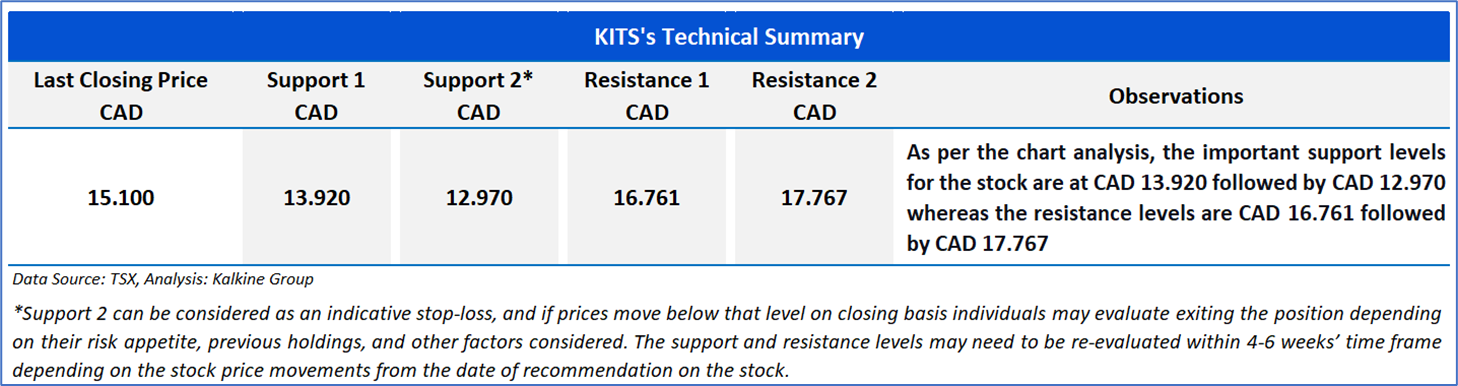
Support: A level at which the stock prices tend to find support if they are falling, and a downtrend may take a pause backed by demand or buying interest.
Resistance: A level at which the stock prices tend to find resistance when they are rising, and the uptrend may take a pause due to profit booking or selling interest.
Stop-loss: In general, it is a level to protect further losses in case of any unfavourable movement in the stock prices.
Past performance is not a reliable indicator of future performance.

 Please wait processing your request...