Section1: Commodity Update:
In Canada, majorly gold and silver mining comes from Ontario and Quebec region, that together accounts for a sizeable metal production. The key drivers behind gold and silver prices in 2025 are global economic uncertainties, inflation, outlook for Fed interest rate cuts and U.S. real yields. The structural bull case for gold and silver remains intact, even as prices have risen sharply. Traditionally, a weaker U.S. dollar and lower U.S. interest rates increase the appeal of yellow and white metal. Recently, Silver erased its earlier pullback to trade above the $32 per ounce mark, near a three-month high, outperforming the other bullion in the session as expectations of steady demand for the metal in the electrification industry offset bets of a more hawkish Fed this year. Additionally, strong industrial demand for silver, driven by its essential role in renewable energy technologies and electronics, has further bolstered its value.
Data Source: Government of Canada
Section2: Company Overview and Fundamental Insights
2.1 Company Overview:
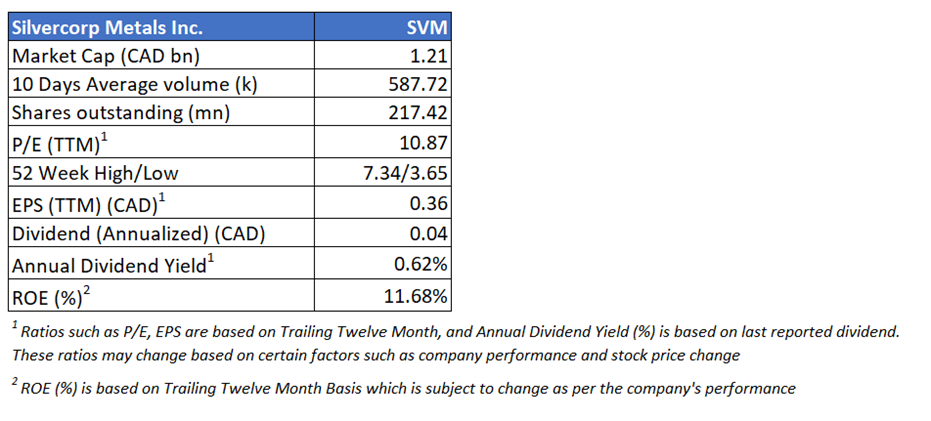
Silvercorp Metals Inc (TSX: SVM) is a mineral mining company. It acquires, explores, develops, and mines precious and base metal mineral properties at its producing mines and exploration and development projects in China. The group produces silver, gold, lead, and zinc.
Kalkine’s Penny Report covers the Investment Highlights, Key Financial Metrics, Risks, Technical Analysis along with the Valuation, Target Price, and Recommendation on the stock.
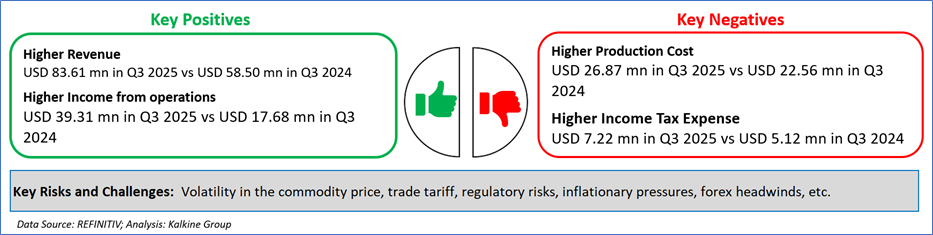
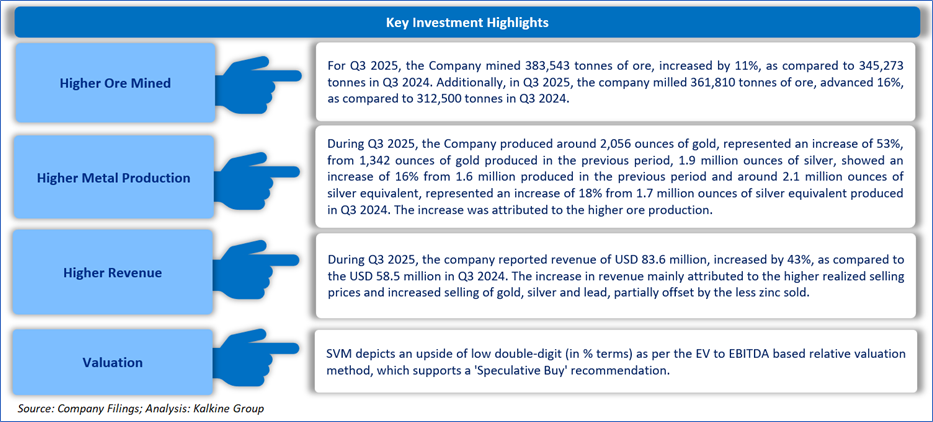
2.2 The Key Positives, Negatives, Investment Highlights and Risks
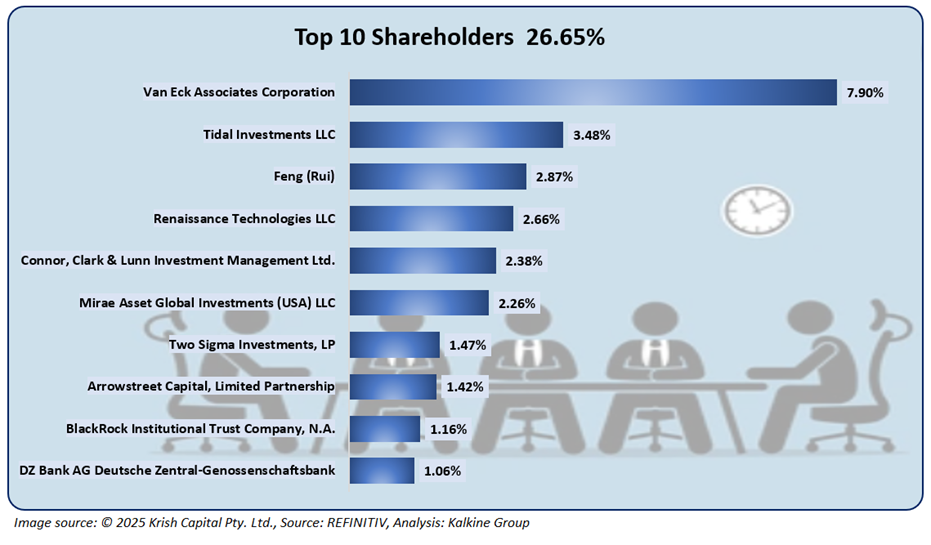
2.3 Top 10 Shareholders:
The top 10 shareholders together form ~26.65% of the total shareholding. Van Eck Associates Corporation and Tidal Investments LLC hold a maximum stake in the company at ~7.90% and ~3.48%, respectively.
2.4 Key Metrics:
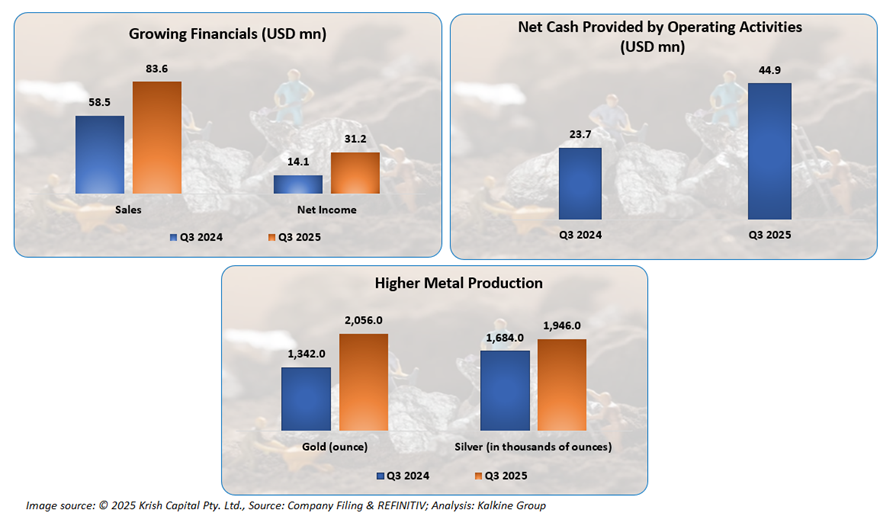
In Q3 2025, the company reported improved financials as compared to Q3 2024, owing to higher realization prices for several metals, which is a key positive. Furthermore, the company's cash from operating activities also increased, demonstrating its resilience.
Section 3: Business Updates and Financial Highlights
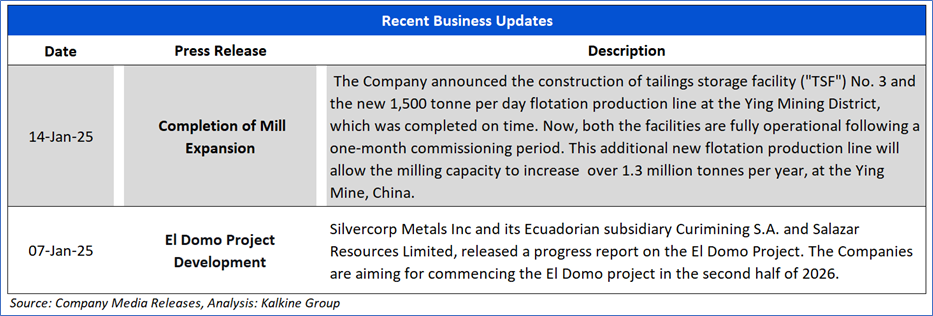
3.1 Recent Updates: The below picture gives an overview of the company’s recent activities, here the company shared information regarding its capacity expansion at Ying Mine and El Domo Project development.
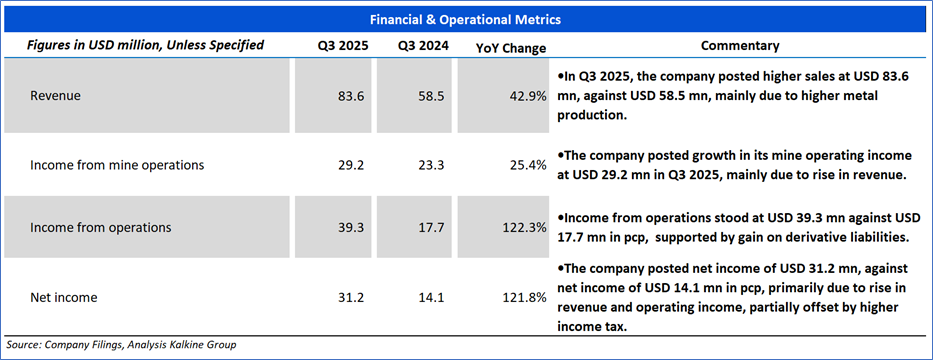
3.2 Insights on Q3 2025 Financial Performance:
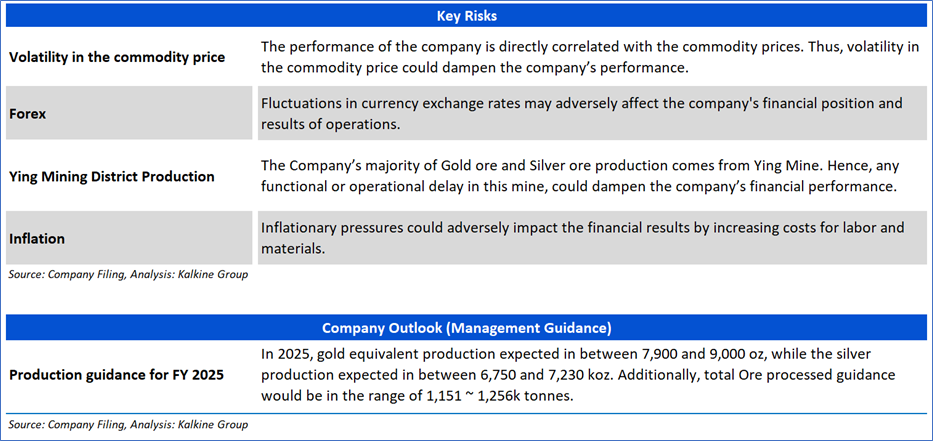
Section 4: Key Risks & Company Outlook:
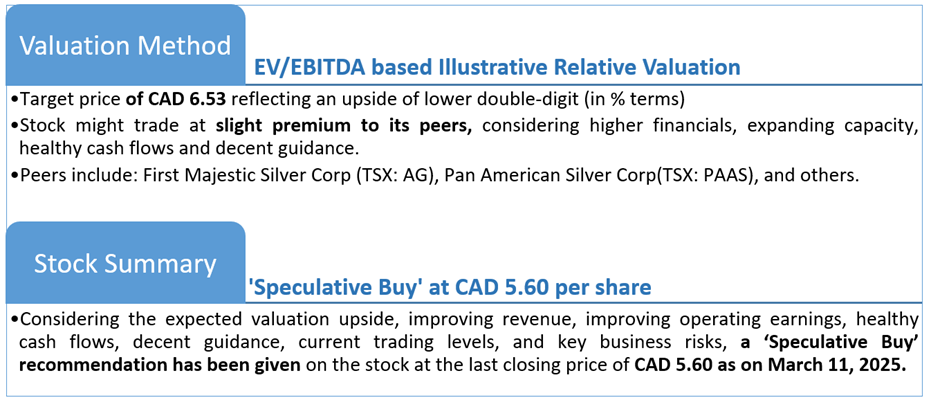
Section 5: Stock Recommendation Summary:
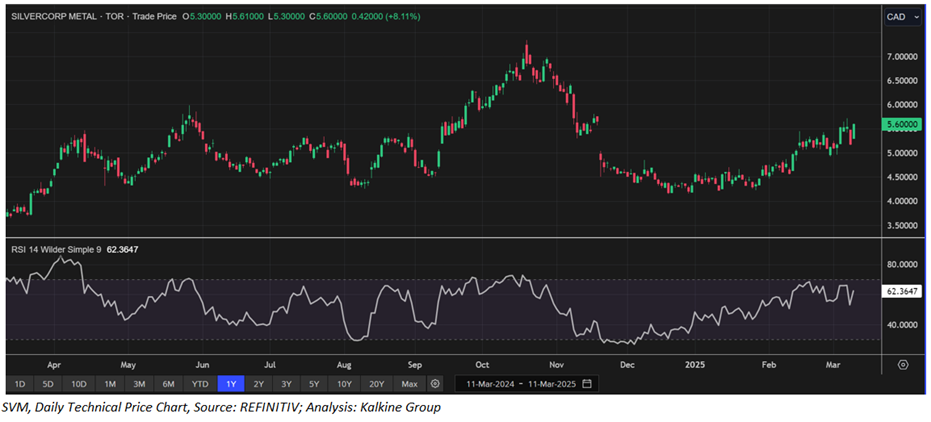
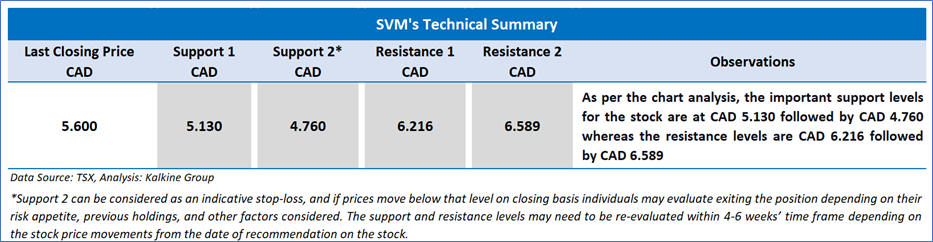
5.1 Price Performance and Technical Summary:

The stock has witnessed an upside of ~8.31% and 21.73% respectively, in 1 week and over the last 1 month. Moreover, the stock is trading above the average 52-week high price of CAD 7.34 and 52-week low price of CAD 3.65, providing an opportunity to ride the trend.
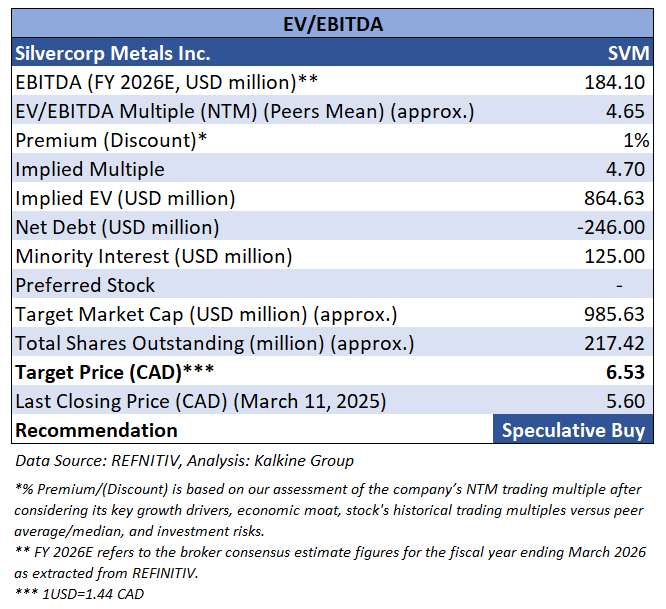
5.2 Fundamental Valuation
Valuation Methodology: EV/EBITDA Multiple Based Relative Valuation (Illustrative)
Markets are trading in a highly volatile zone currently due to certain macroeconomic issues and geopolitical tensions prevailing. Therefore, it is prudent to follow a cautious approach while investing.
Note 1: Past performance is not a reliable indicator of future performance.
Note 2: The reference date for all price data, currency, technical indicators, support, and resistance levels as on March 11, 2025. The reference data in this report has been partly sourced from REFINITIV.
Note 3: Investment decisions should be made depending on an individual's appetite for upside potential, risks, holding duration, and any previous holdings. An 'Exit' from the stock can be considered if the Target Price mentioned as per the Valuation and or the technical levels provided has been achieved and is subject to the factors discussed above.
Note 4: Dividend Yield may vary as per the stock price movement.
Note 5: Kalkine reports are prepared based on the stock prices captured either from REFINITIV or Trading View. Typically, REFINITIV or Trading View may reflect stock prices with a delay which could be a lag of 25-30 minutes. There can be no assurance that future results or events will be consistent with the information provided in the report. The information is subject to change without any prior notice.
Technical Indicators Defined: -
Support: A level at which the stock prices tend to find support if they are falling, and a downtrend may take a pause backed by demand or buying interest.
Resistance: A level at which the stock prices tend to find resistance when they are rising, and the uptrend may take a pause due to profit booking or selling interest.
Stop-loss: In general, it is a level to protect further losses in case of any unfavorable movement in the stock prices.
Past performance is not a reliable indicator of future performance.

 Please wait processing your request...