Section 1: Company Overview and Fundamentals
1.1 Company Overview:
Southern Copper Corporation (NYSE: SCCO) is an integrated mining company focused on producing copper and other metals such as molybdenum, silver, and zinc, with operations primarily in Peru and Mexico. Its business includes open-pit and underground mining, along with smelting and refining facilities, supported by exploration activities across Latin America.
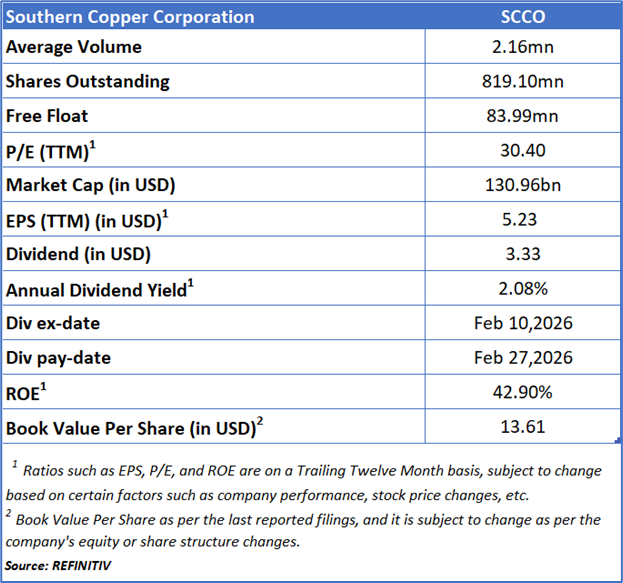
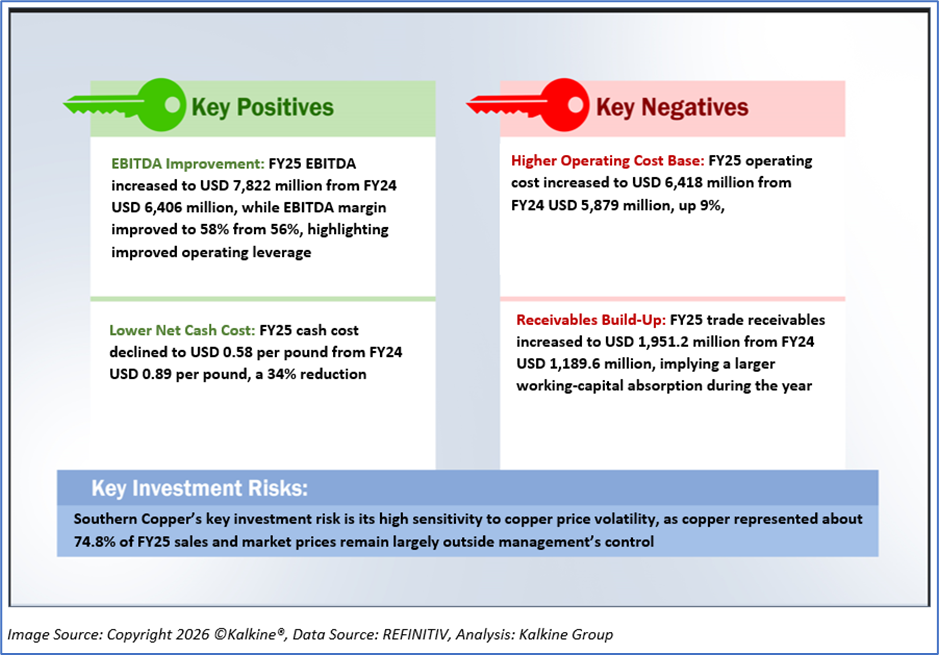
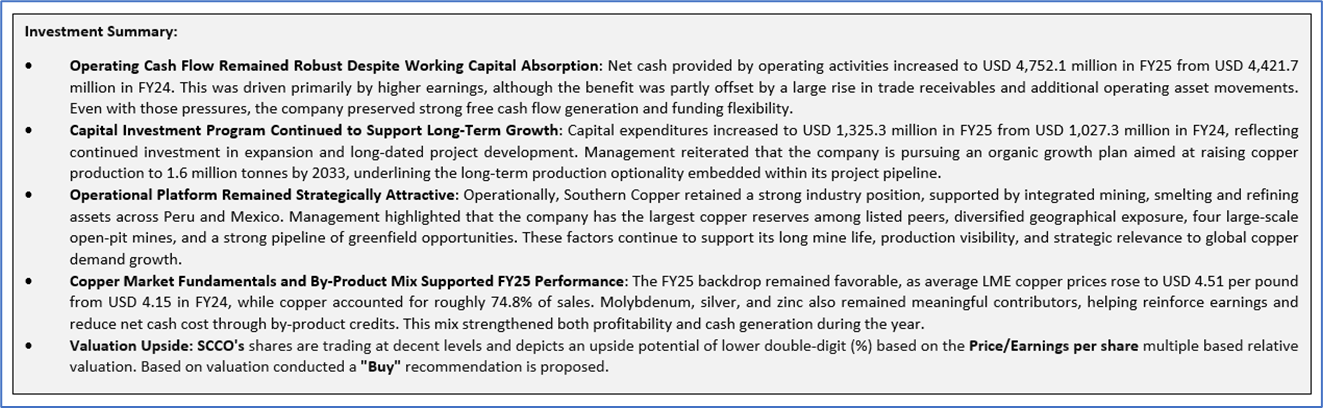
Kalkine’s Dividend Income Report covers the Company Overview, Key positives & negatives, Investment summary, Key investment metrics, Top 10 shareholding, Business updates and insights into company recent financial results, Key Risks & Outlook, Price performance and technical summary, Target Price, and Recommendation on the stock.
Price Performance:
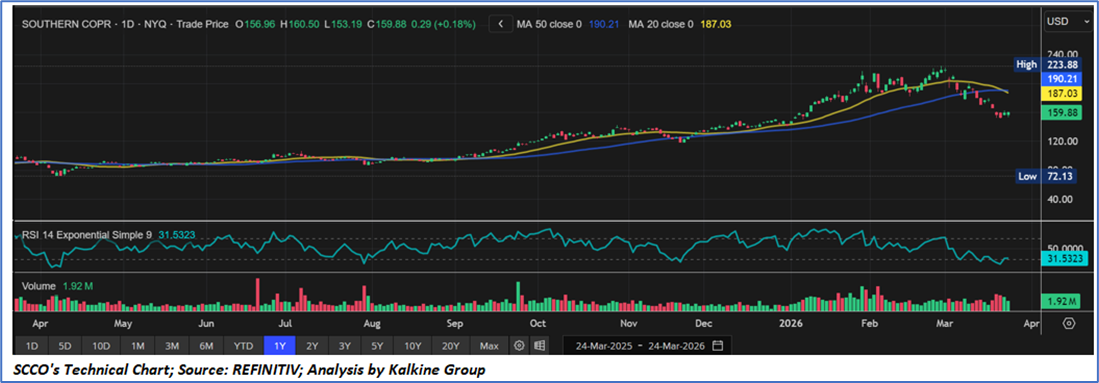
- The stock showed a strong uptrend until early 2026, forming higher highs and higher lows, but has recently entered a correction after peaking at USD 223.88, reflecting a mix of macroeconomic pressures, commodity price dynamics.
- The price has moved below both the 20-day (USD 187.03) and 50-day (USD 190.21) moving averages, indicating weakening momentum and a short-term bearish trend.
- RSI is near 32, close to oversold levels, suggesting weak momentum but also the possibility of a short-term bounce.
- Higher volumes during price declines indicate increased selling pressure after the recent rally.
1.2 The Key Positives, Negatives, and Investment summary
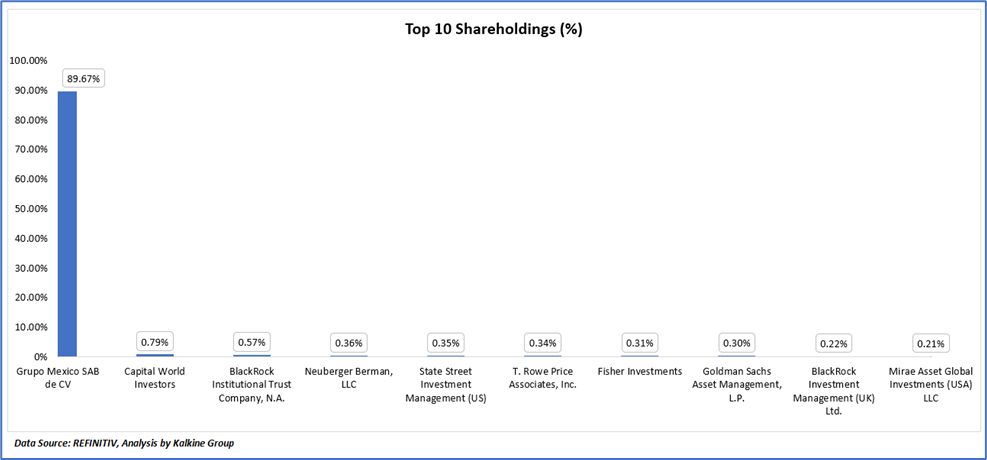
1.3 Top 10 shareholders:
The top 10 shareholders together form ~93.11% of the total shareholding, signifying concentrated shareholding. Grupo Mexico SAB de CV and is the biggest shareholder, holding the maximum stake in the company at ~89.67%.
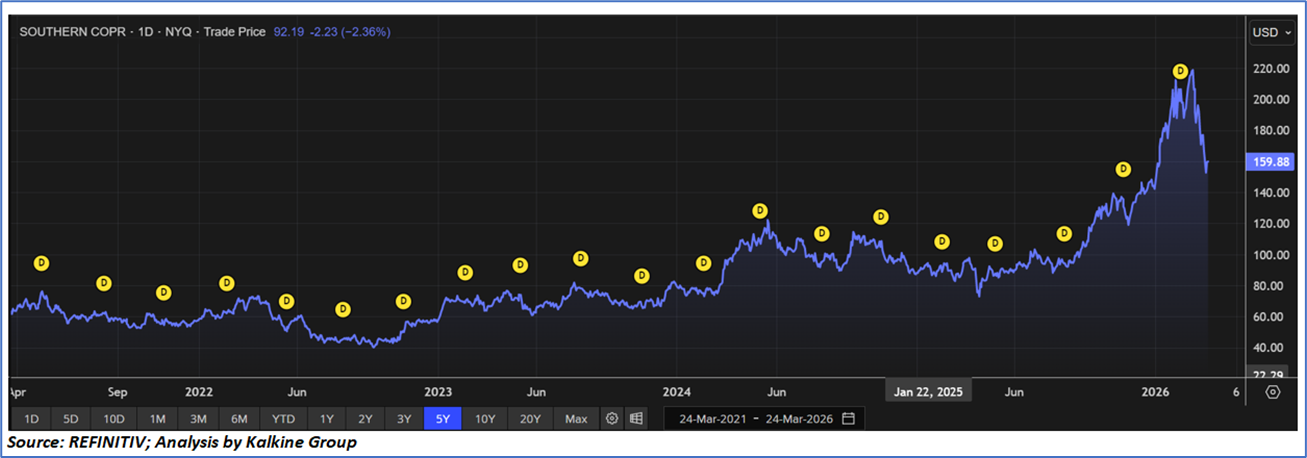
1.4 Dividend Strength Reflected in Price Momentum with Cyclical Corrections:
Southern Copper’s dividend distribution, as reflected in the chart, demonstrates a consistent and recurring payout pattern across the cycle, with multiple dividend markers indicating regular capital returns to shareholders. The frequency of distributions remains stable through 2021–2025, underscoring management’s commitment to returning cash, supported by strong operating cash flows and a low-cost structure. Periods of rising dividends broadly align with phases of improved earnings and stronger copper price realizations, particularly during 2023–2025, when the stock also exhibited sustained upward momentum. Notably, the sharp price appreciation into early 2026 suggests that dividend-backed cash generation, combined with favorable commodity dynamics, drove investor accumulation. However, the subsequent price correction indicates that while dividends provide structural support to valuation, they do not fully insulate the stock from cyclical adjustments linked to commodity price volatility. Overall, the chart reflects a reliable dividend policy with payouts closely tied to underlying earnings strength and commodity cycles, reinforcing long-term shareholder return visibility.
1.5 Key Metrics
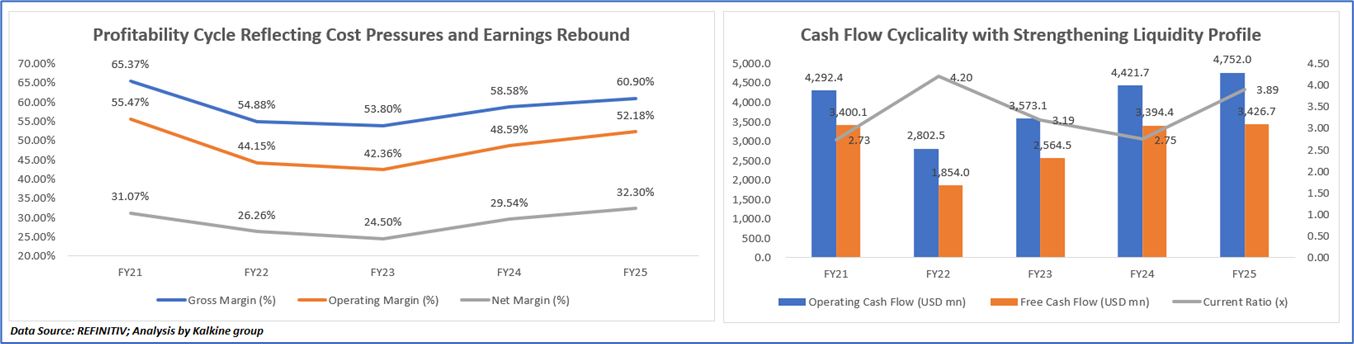
Profitability Cycle Reflecting Cost Pressures and Earnings Rebound
The margin trajectory reflects a cyclical pattern influenced by commodity pricing and cost movements, with margins declining from FY21 to FY23 due to softer copper realizations, rising input costs, and weaker by-product credits that compressed profitability. Operating and net margins were more impacted during this phase as cost inflation outpaced revenue growth. From FY24 onwards, margins recovered on the back of stronger copper prices, improved by-product realizations, and enhanced operating leverage, supported by lower net cash costs and the company’s integrated low-cost structure, while net margins remained relatively more sensitive to broader cost and non-operating factors.
Cash Flow Cyclicality with Strengthening Liquidity Profile
The trend in operating and free cash flow reflects the cyclical nature of earnings, with a sharp decline in FY22 driven by weaker commodity prices, lower profitability, and higher working capital requirements. This was followed by a gradual recovery in FY23 as pricing stabilized, and a strong rebound in FY24–FY25 supported by higher copper prices, improved margins, and stronger net income. While operating cash flow expanded significantly, free cash flow growth remained relatively moderated due to increased capital expenditures for long-term projects. Meanwhile, liquidity levels, as indicated by the current ratio, fluctuated with working capital movements but improved toward FY25, highlighting a structurally strong cash-generating profile supported by the company’s low-cost operations.
Section 2: Business Updates and Financial Highlights
2.1 Recent Updates:
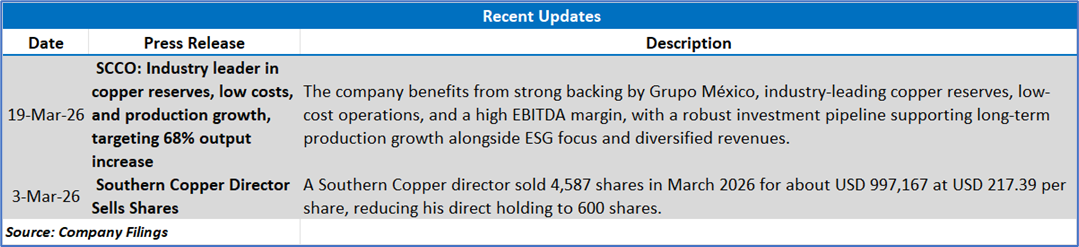
The below picture gives an overview of the recent updates:
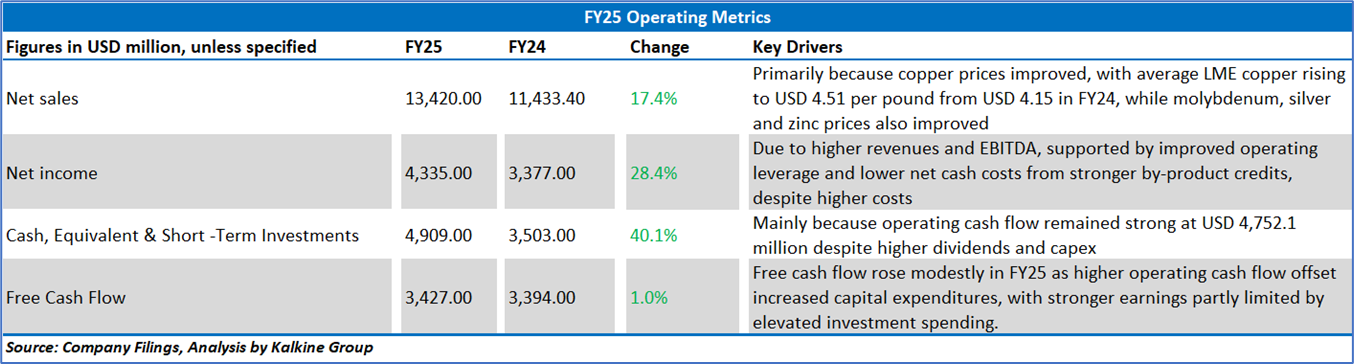
2.2 Insights of FY25:
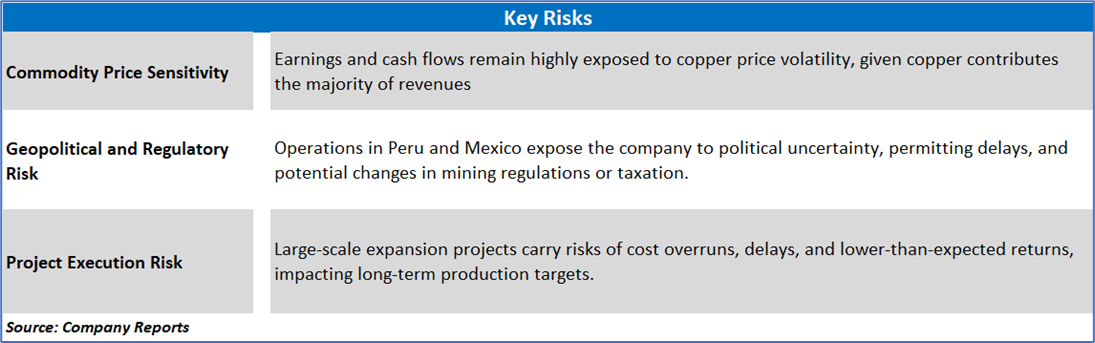
Section 3: Key Risks and Outlook:

Section 4: Stock Recommendation Summary:
4.1 Technical Summary:
Price Performance:
- Trend Structure: The stock showed a strong uptrend until early 2026, forming higher highs and higher lows, but has recently entered a correction after peaking at USD 223.88.
- Moving Averages Signal: The price has moved below both the 20-day (USD 187.03) and 50-day (USD 190.21) moving averages, indicating weakening momentum and a short-term bearish trend.
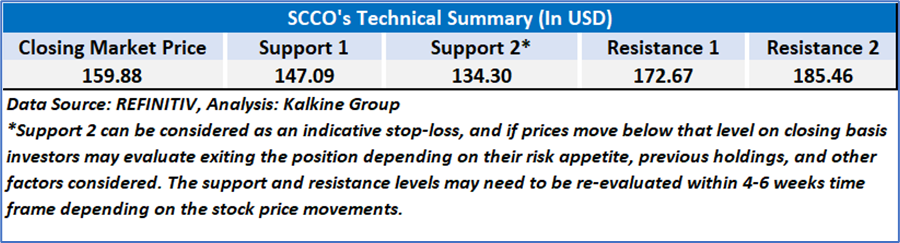
- Resistance Levels: Immediate resistance is seen around USD 185–190, while a stronger resistance zone lies near USD 210–220.
- Support Levels: Near-term support is around USD 150–155, with stronger support at USD 130–135 based on previous consolidation.
- RSI Momentum: RSI is near 32, close to oversold levels, suggesting weak momentum but also the possibility of a short-term bounce.
- Volume Trends: Higher volumes during price declines indicate increased selling pressure after the recent rally.
4.2 Fundamental Valuation
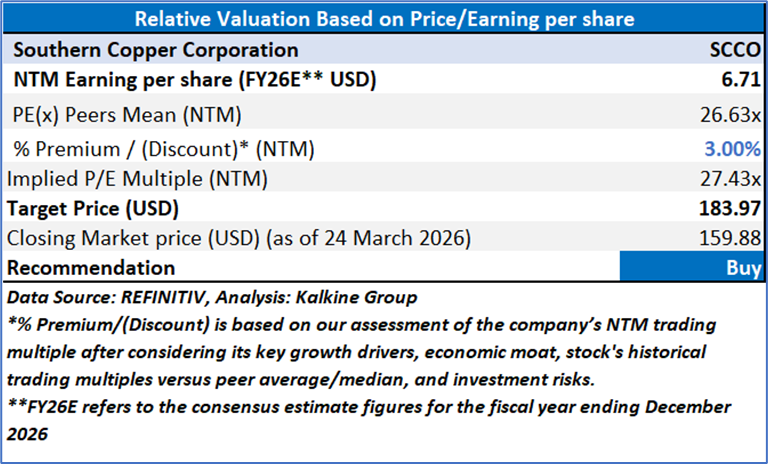
Valuation Methodology: Price/Earnings Multiple Based Relative Valuation
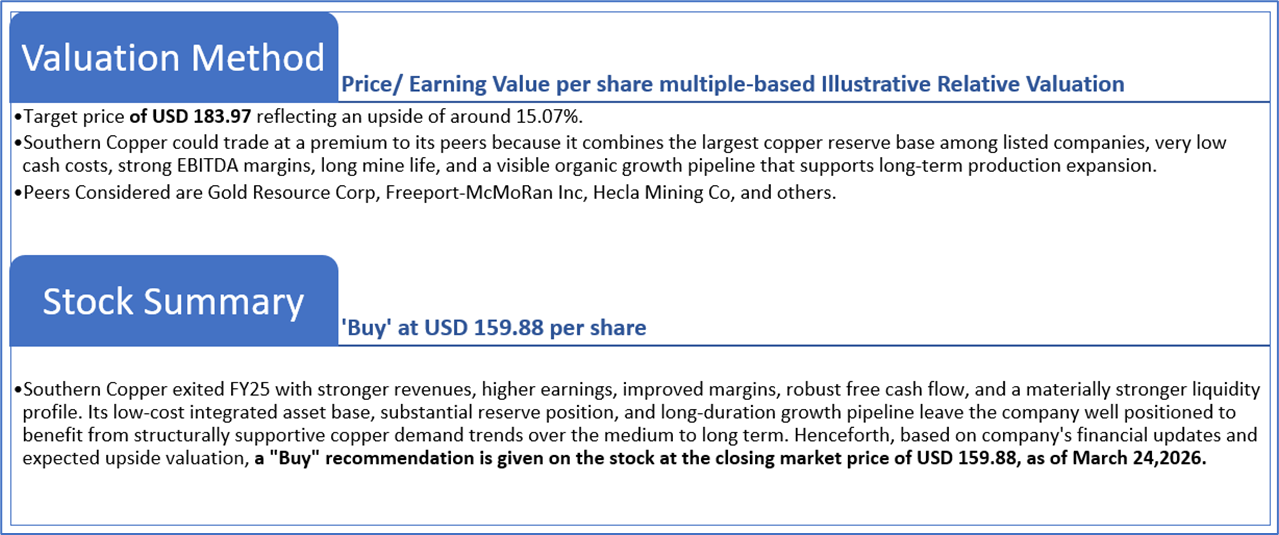
Markets are trading in a highly volatile zone currently due to certain macroeconomic issues and geopolitical tensions prevailing. Therefore, it is prudent to follow a cautious approach while investing.
Note 1: Past performance is not a reliable indicator of future performance.
Note 2: The reference date for all price data, currency, technical indicators, support, and resistance levels is March 24, 2026. The reference data in this report has been partly sourced from REFINITIV.
Note 3: Investment decisions should be made depending on an individual's appetite for upside potential, risks, holding duration, and any previous holdings. An 'Exit' from the stock can be considered if the Target Price mentioned as per the Valuation and or the technical levels provided has been achieved and is subject to the factors discussed above.
Note 4: The report publishing date is as per the Pacific Time Zone.
Technical Indicators Defined: -
Support: A level at which the stock prices tend to find support if they are falling, and a downtrend may take a pause backed by demand or buying interest. Support 1 refers to the nearby support level for the stock and if the price breaches the level, then Support 2 may act as the crucial support level for the stock.
Resistance: A level at which the stock prices tend to find resistance when they are rising, and an uptrend may take a pause due to profit booking or selling interest. Resistance 1 refers to the nearby resistance level for the stock and if the price surpasses the level, then Resistance 2 may act as the crucial resistance level for the stock.
Stop-loss: It is a level to protect against further losses in case of unfavorable movement in the stock prices.
Past performance is not a reliable indicator of future performance.

 NZ
 UK
 US
 AU
 IND

 CA

 Please wait processing your request...