Section 1: Company Overview, Shariah Compliance Standards and Fundamentals
Section 1.1: S&P Global Inc. (NYSE: SPGI) provides essential intelligence. Its operations consist of five businesses: S&P Global Market Intelligence (Market Intelligence), S&P Global Ratings (Ratings), S&P Global Commodity Insights (Commodity Insights), S&P Global Mobility (Mobility) and S&P Dow Jones Indices (Indices). Market Intelligence is a global provider of multi-asset-class data and analytics integrated with purpose-built workflow solutions.
Kalkine’s ‘The Shariah Compliance Report’ covers the Investment Highlights, Shariah-compliance standards, Key Financial Metrics, Risks, and Technical Analysis along with the Valuation, Target Price, and Recommendation on the stock.

Section 1.2: What are the Key Metrics for Shariah Compliance to be Considered?
The Shariah Compliance Report aims to identify equities that align with Shariah and ethical principles, providing valuable insights on financial metrics, business activities and compliance with Islamic finance norms.
Key Shariah Screening Criteria and Thresholds
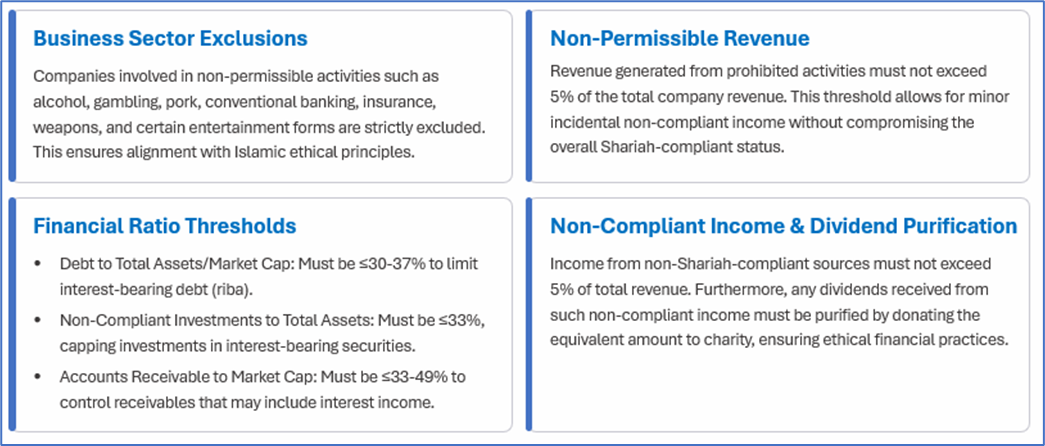
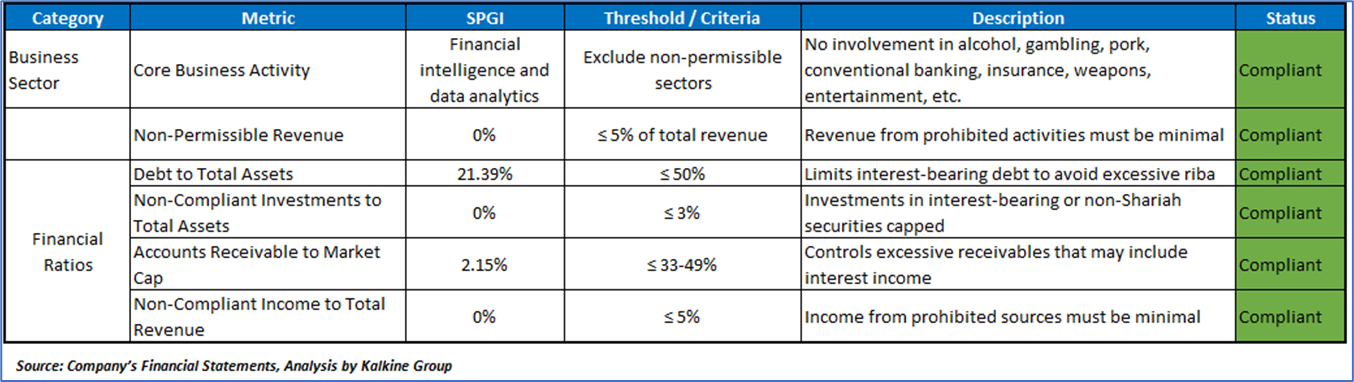
Shariah Metrics for S&P Global Inc. (NYSE: SPGI):
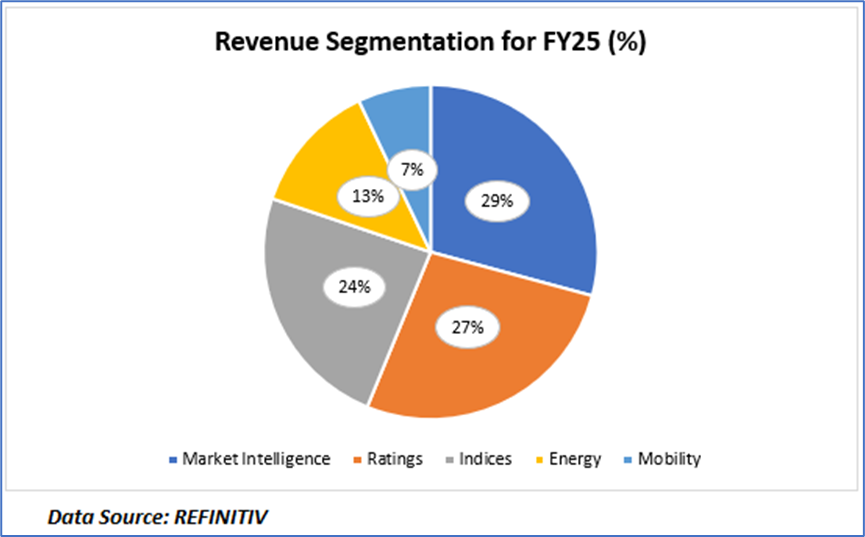
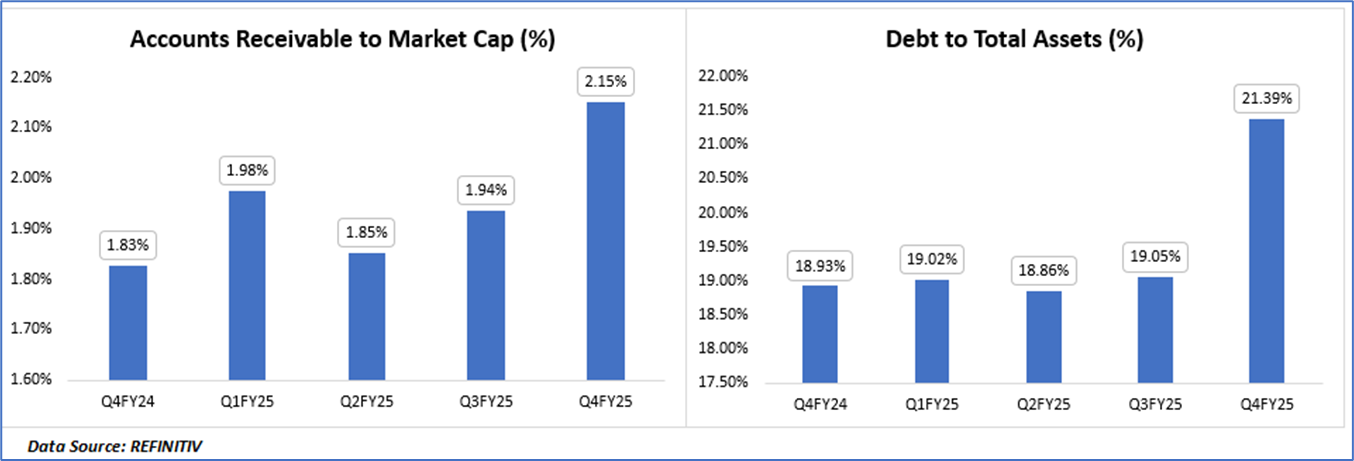
Revenue Segmentation of SPGI in FY25 & Historical Compliance of Financial Ratios:
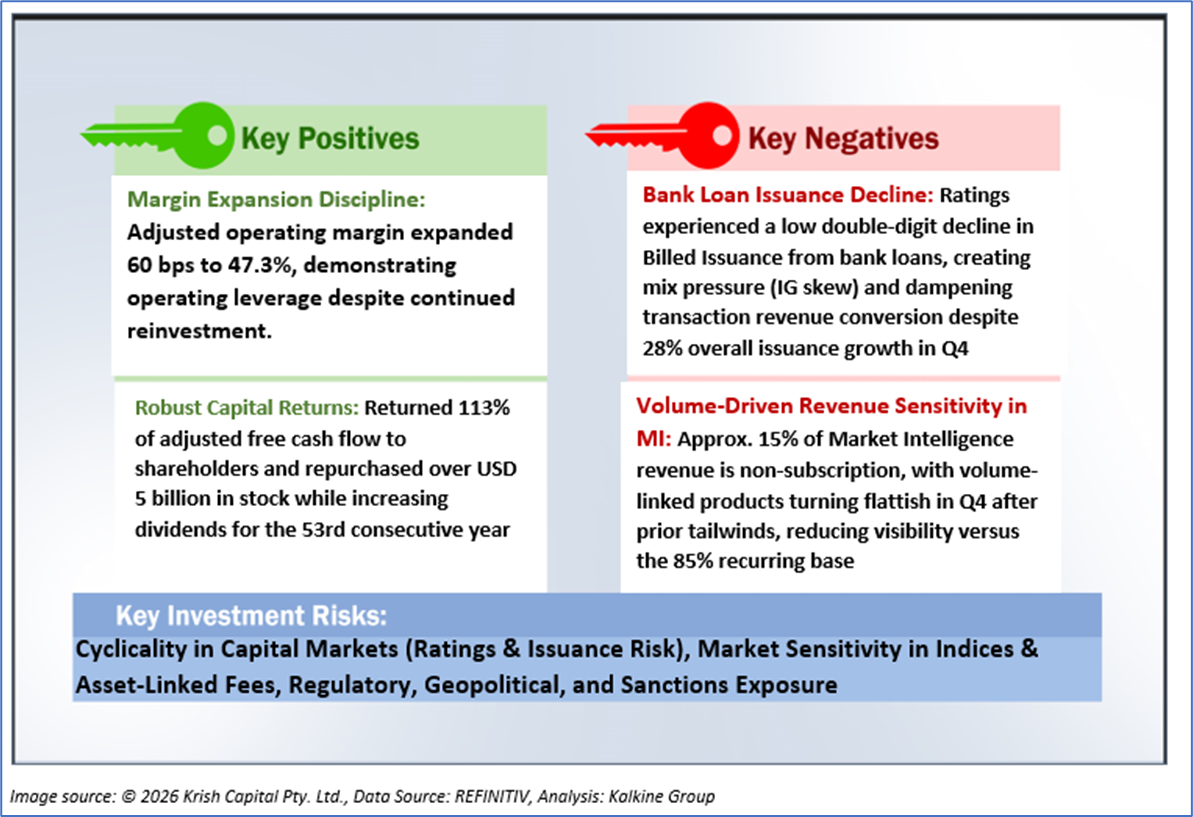
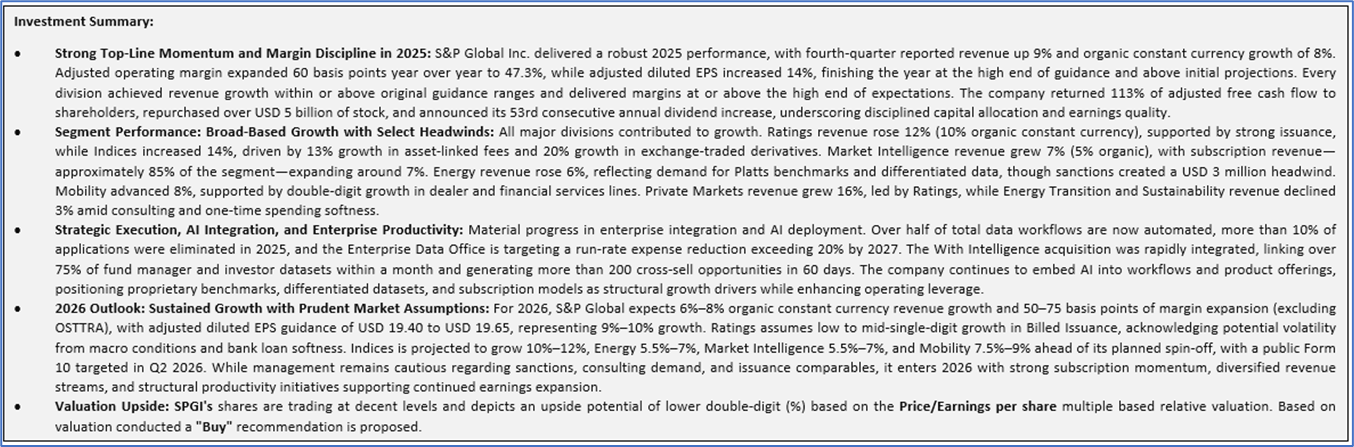
1.3 The Key Positives, Negatives, and Investment summary
1.4 Top 10 shareholders:
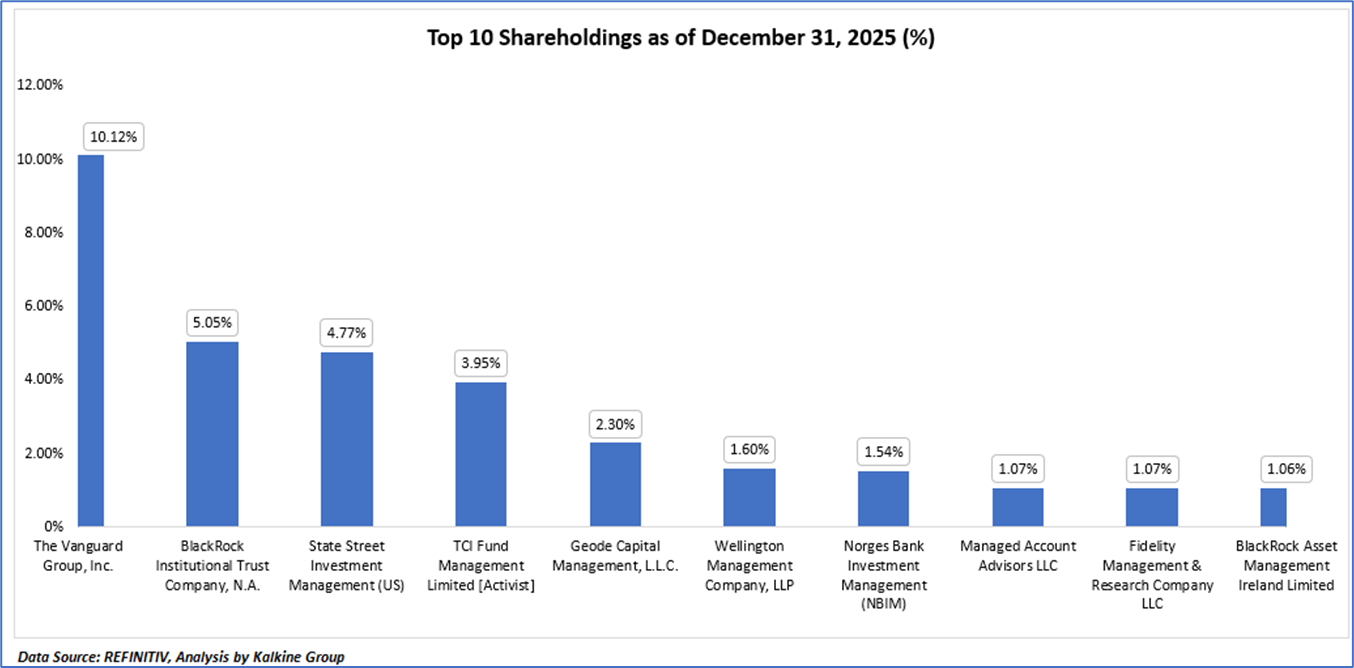
The top 10 shareholders together form ~32.52% of the total shareholding, signifying concentrated shareholding. The Vanguard Group, Inc. and BlackRock Institutional Trust Company, N.A. are the biggest shareholders, holding the maximum stake in the company at ~10.12% and ~5.05%, respectively.
1.5 Key Metrics:
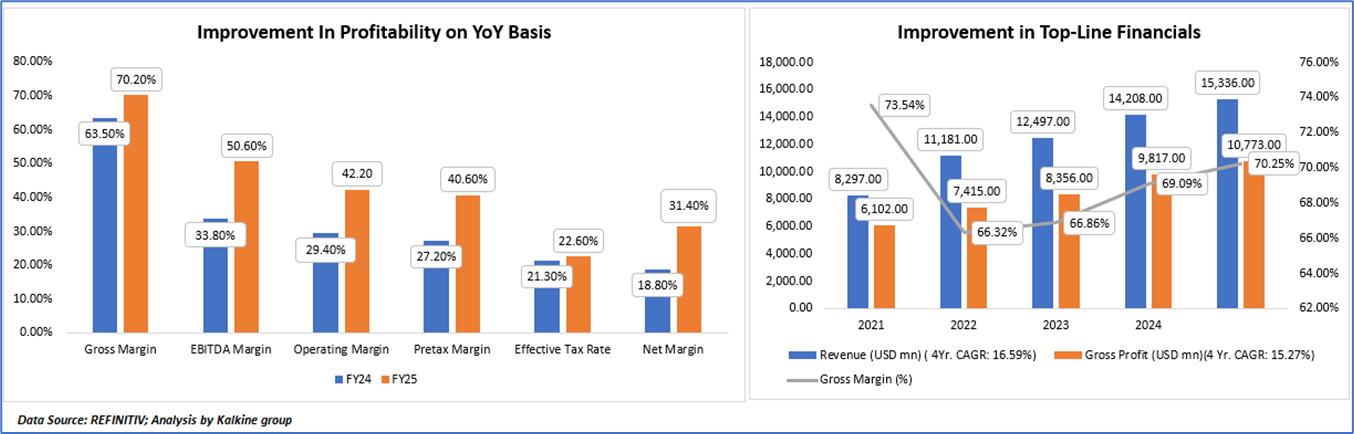
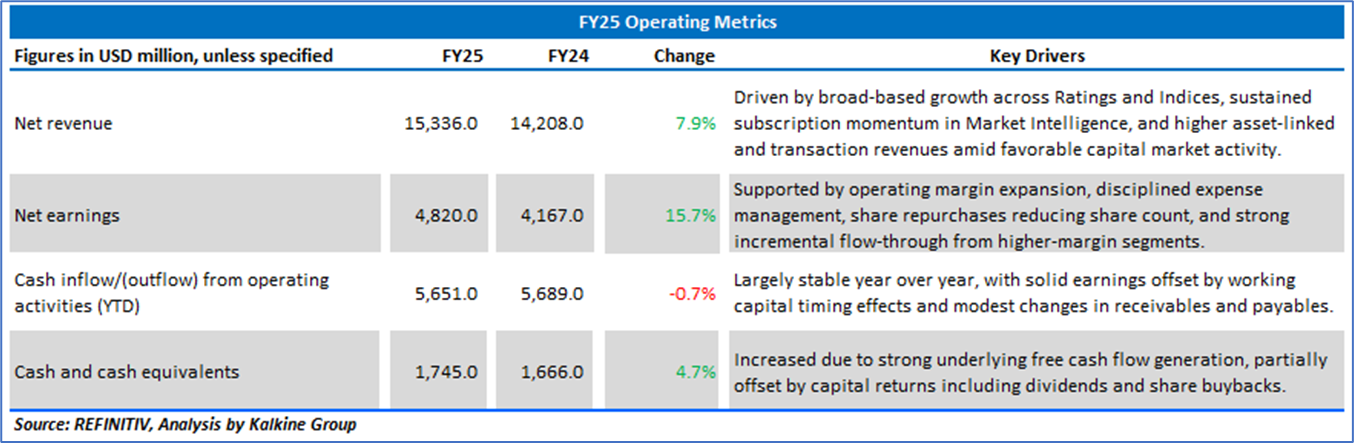
Revenue Growth Trajectory and Scale Expansion: S&P Global Inc. has demonstrated a structurally strong top-line expansion over the 2021–2025 period, with revenue increasing from USD 8,297 million in 2021 to USD 15,336 million in 2025, reflecting a robust 4-year CAGR of 16.59%. The growth profile indicates successful integration of acquisitions, sustained expansion in Ratings and Indices, and increasing subscription penetration within Market Intelligence. The steady progression from USD 14,208 million in 2024 to USD 15,336 million in 2025 further underscores continued organic momentum despite macro variability in issuance markets.
Gross Profit Growth and Margin Recovery: Gross profit expanded from USD 6,102 million in 2021 to USD 10,773 million in 2025, delivering a 4-year CAGR of 15.27%, broadly aligned with revenue growth. Gross margins, which compressed from 73.54% in 2021 to 66.32% in 2022 amid portfolio transition and integration effects, have since recovered progressively to 70.25% in 2025. This recovery signals improved operating leverage, favorable product mix (higher benchmark and subscription weighting), and cost discipline. The FY24 to FY25 improvement (63.50% to 70.20% on the alternate presentation) further highlights normalization and structural efficiency gains.
Margin Expansion and Operating Leverage (FY24 vs FY25): A pronounced expansion in profitability metrics is evident between FY24 and FY25. EBITDA margin increased materially from 33.80% to 50.60%, while operating margin improved from 29.40% to 42.20%, reflecting both revenue scaling and productivity initiatives, including automation and enterprise data optimization. Pretax margin similarly expanded from 27.20% to 40.60%, indicating enhanced operating discipline and favorable mix shift toward high-margin businesses such as Indices and Ratings.
Net Profitability and Tax Profile: Net margin strengthened significantly from 18.80% in FY24 to 31.40% in FY25, underscoring earnings conversion efficiency and operating leverage realization. The effective tax rate increased modestly from 21.30% to 22.60%, but remained within a stable range, suggesting limited tax volatility impact on bottom-line expansion. Overall, the margin trajectory reflects a transition toward structurally higher profitability supported by recurring revenue dominance and scalable cost architecture.
Section 2: Business Updates and Financial Highlights
2.1 Recent Updates:
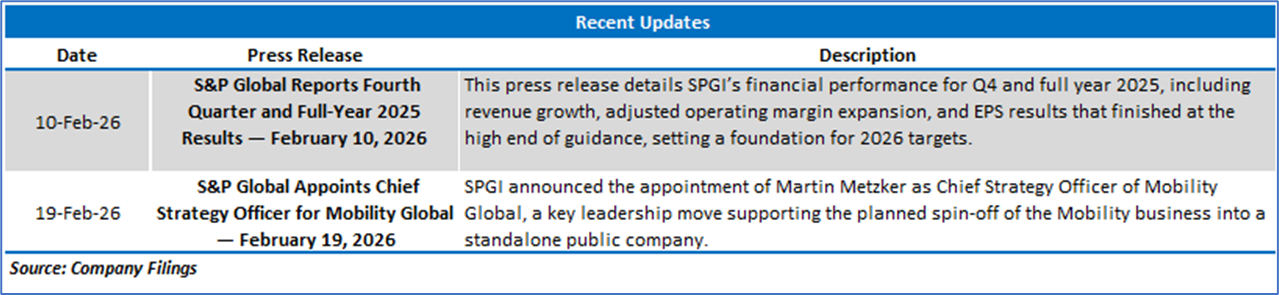
The below picture gives an overview of the recent updates:
2.2 Insights of FY25:
Section 3: Key Risks and Outlook:
Section 4: Stock Recommendation Summary:
4.1 Technical Summary:
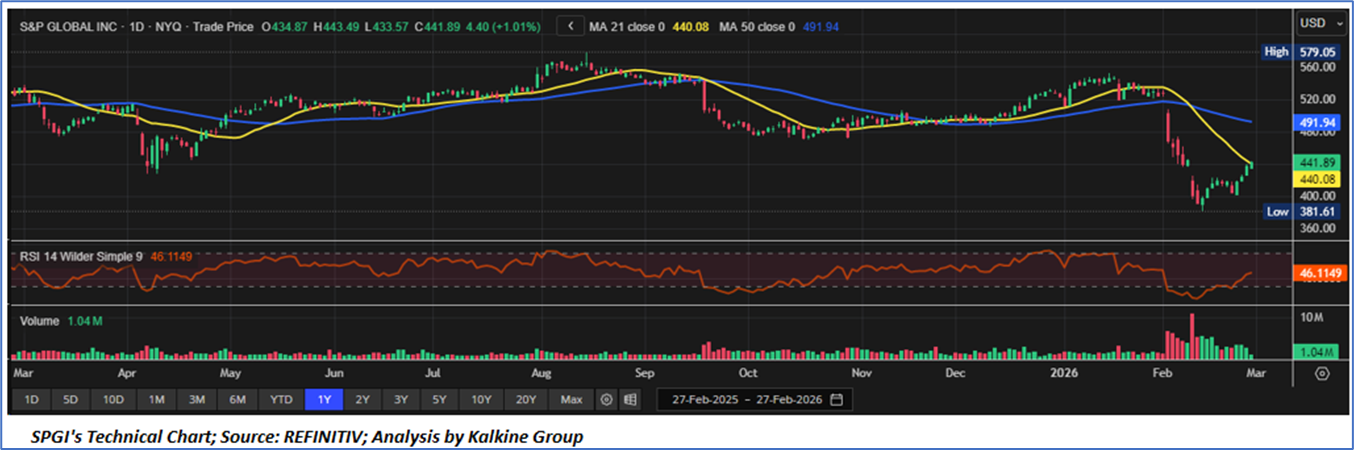
Trend Stabilization After Sharp Correction: S&P Global Inc. has rebounded from the USD 380–400 support zone after a steep decline from prior highs near USD 580. While the stock has reclaimed the 21-day moving average, the broader trend remains cautious below the falling 50-day average, indicating early stabilization rather than a confirmed trend reversal.
Momentum Recovery Without Overextension: The RSI has recovered into the mid-40s from oversold levels, suggesting improving momentum but not yet signaling strong bullish conviction. Volume patterns indicate reduced selling pressure and early accumulation, though momentum remains below the neutral 50 threshold.
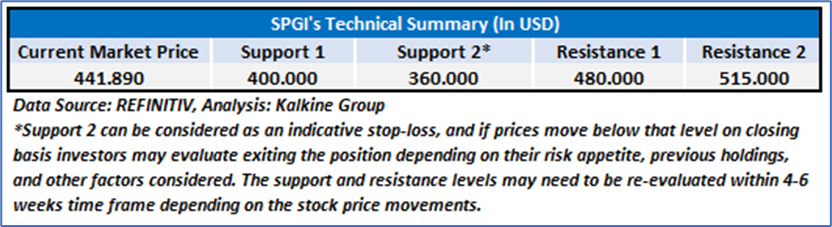
Key Resistance and Validation Levels: Immediate support lies near USD 440, while the 50-day moving average around USD 490 is the critical resistance barrier. A sustained move above this level would strengthen recovery prospects, whereas a failure could re-expose the USD 380 support region.
4.2 Fundamental Valuation
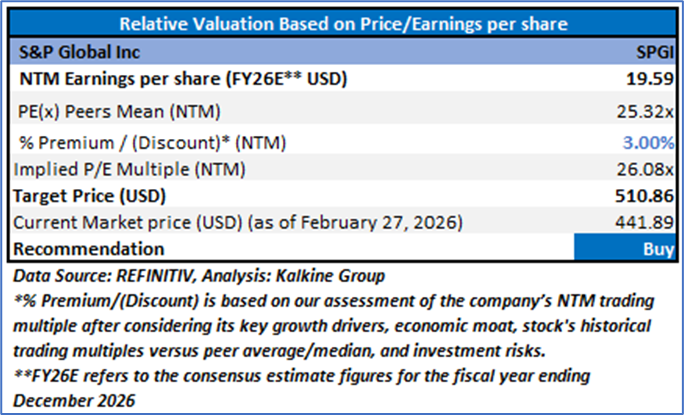
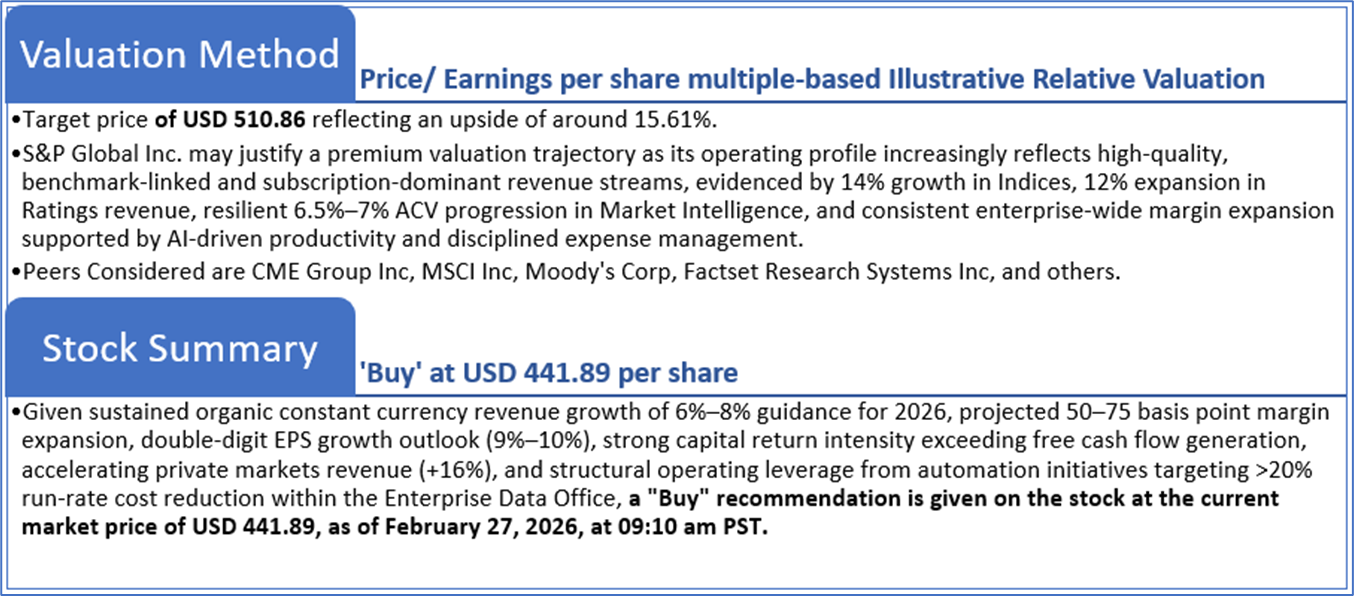
Valuation Methodology: Price/Earnings Per Share Multiple Based Relative Valuation
Markets are trading in a highly volatile zone currently due to certain macroeconomic issues and geopolitical tensions prevailing. Therefore, it is prudent to follow a cautious approach while investing.
Note 1: Past performance is not a reliable indicator of future performance.
Note 2: The reference date for all price data, currency, technical indicators, support, and resistance levels is February 27, 2026. The reference data in this report has been partly sourced from REFINITIV.
Note 3: Investment decisions should be made depending on an individual's appetite for upside potential, risks, holding duration, and any previous holdings. An 'Exit' from the stock can be considered if the Target Price mentioned as per the Valuation and or the technical levels provided have been achieved and is subject to the factors discussed above.
Note 4: The report publishing date is as per the Pacific Time Zone.
Technical Indicators Defined: -
Support: A level at which the stock prices tend to find support if they are falling, and a downtrend may take a pause backed by demand or buying interest. Support 1 refers to the nearby support level for the stock and if the price breaches the level, then Support 2 may act as the crucial support level for the stock.
Resistance: A level at which the stock prices tend to find resistance when they are rising, and an uptrend may take a pause due to profit booking or selling interest. Resistance 1 refers to the nearby resistance level for the stock and if the price surpasses the level, then Resistance 2 may act as the crucial resistance level for the stock.
Stop-loss: It is a level to protect against further losses in case of unfavorable movement in the stock prices.
Past performance is not a reliable indicator of future performance.

 NZ
 UK
 US
 AU
 IND

 CA

 Please wait processing your request...