This report is an updated version of report published on 06 May 2026 as on 10:58 AM IST

The ‘India Equity Opportunities Report’ is a forward-looking, conviction-based research product that identifies and evaluates investment options within the Indian equity market.
Anchored in a robust global and domestic macro framework, the report blends structural growth tailwinds with company-level fundamentals, valuation discipline, and technical signals to support confident, data-driven decision-making.

India’s chemical industry remains a key pillar of the country’s manufacturing sector, serving a wide range of industries including pharmaceuticals, agriculture, automotive, textiles, construction, food processing, personal care, and consumer goods. The sector is among the largest globally, with India ranking as the sixth-largest chemical producer worldwide and the third-largest in Asia. The industry contributes nearly 7% to India’s GDP and produces more than 80,000 commercial products spanning bulk chemicals, specialty chemicals, petrochemicals, agrochemicals, and fluorochemicals.
The sector continues to benefit from rising domestic consumption, expanding industrial activity, export growth opportunities, and ongoing diversification of global supply chains. India’s exports of chemicals and allied products remained healthy, reaching approximately US$9.19 billion during FY26 (April–June), supported by improving global demand and increasing competitiveness of Indian manufacturers.
(Data Source: India Brand Equity Foundation (IBEF), Ministry of Chemicals & Fertilizers)

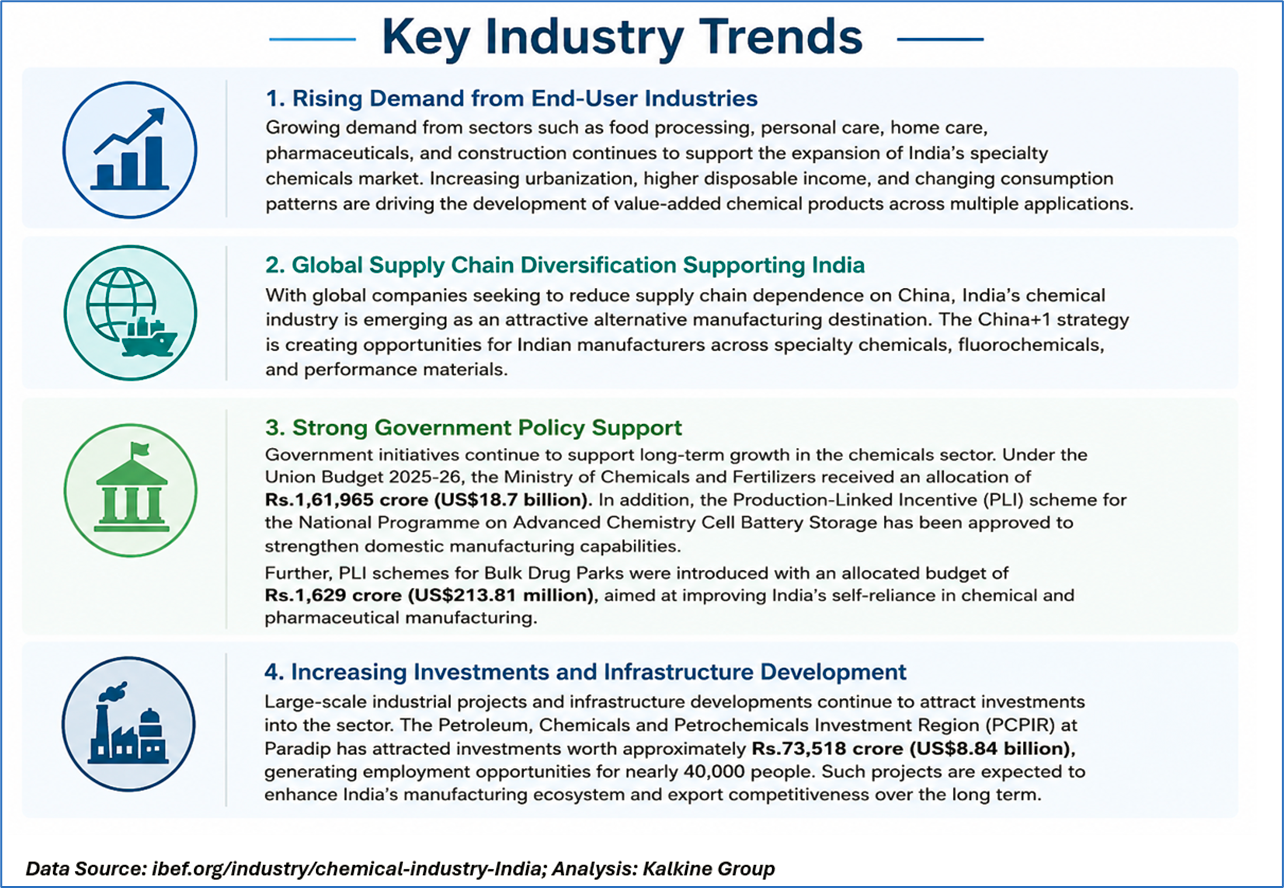

The outlook for India’s chemical industry remains positive, supported by robust economic growth, favorable government policies, rising domestic demand, and increasing export opportunities. Specialty chemicals, fluorochemicals, and sustainable chemical solutions are expected to remain major growth areas over the coming years.
The industry is also witnessing rising investments in green chemistry, advanced materials, and capacity expansion projects to cater to both domestic and international demand. Additionally, global supply chain diversification and increasing focus on India as a manufacturing hub may continue to support industry growth over the medium to long term.
For companies such as SRF Limited, the industry environment appears supportive due to increasing demand for specialty chemicals, refrigerants, fluorochemicals, and high-value industrial applications.
(Data Source: India Brand Equity Foundation (IBEF), Ministry of Chemicals & Fertilizers)
Based on the above data, one NSE-listed India Equity Opportunities stock has been identified to showcase the momentum.
Section 1: Company Overview and Fundamentals Insights
Company Overview: SRF Limited (NSE: SRF) is a diversified chemicals and industrial materials company engaged in specialty chemicals, fluorochemicals, technical textiles, and packaging films. The company operates 14 manufacturing facilities across India, Thailand, South Africa, and Hungary, serving automotive, pharmaceuticals, agrochemicals, and industrial sectors while exporting products to over 90 countries globally. Kalkine’s India Equity Opportunities Report covers the Investment Highlights, Management Commentary, Key Financial Metrics, Risks, and Technical Analysis along with the Valuation, Target Price, and Recommendation on the stock.
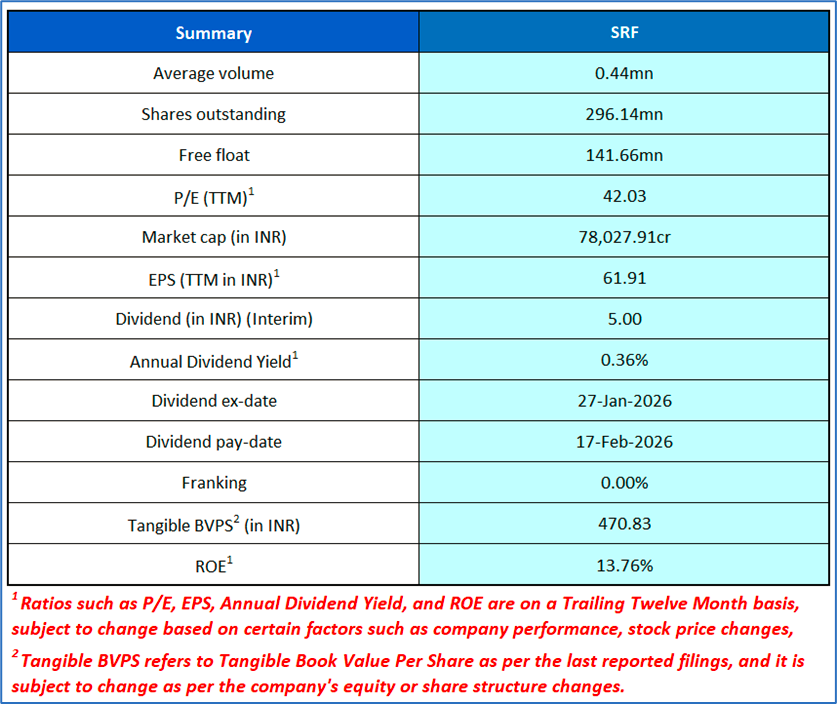
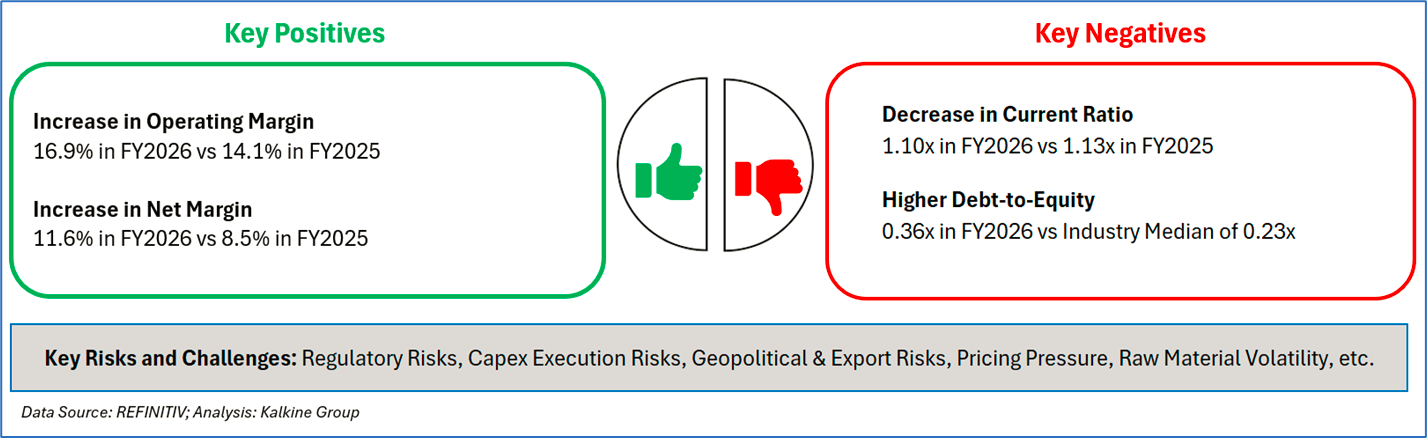
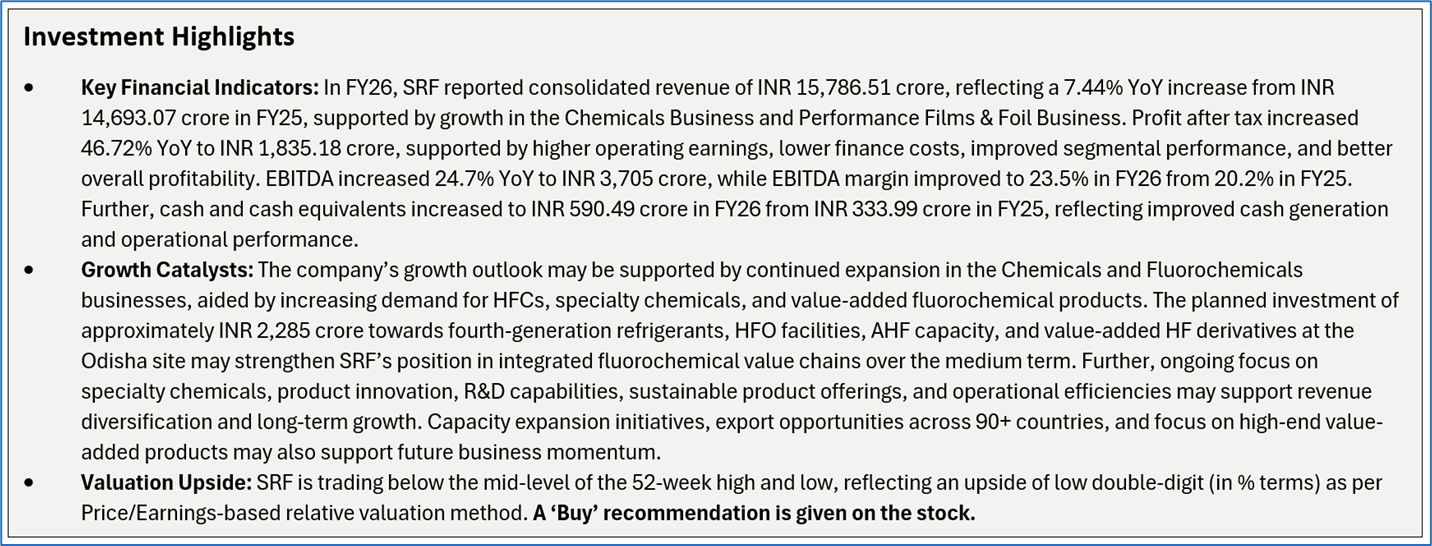
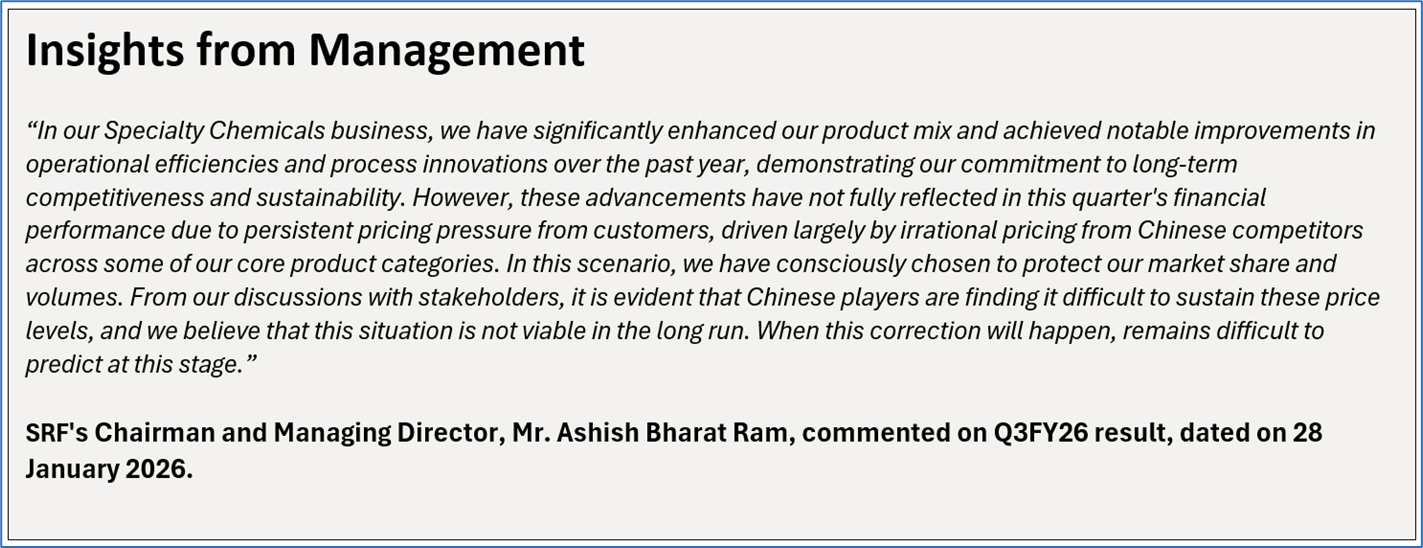
1.2 The Key Positives, Negatives, Investment Highlights, and Risks
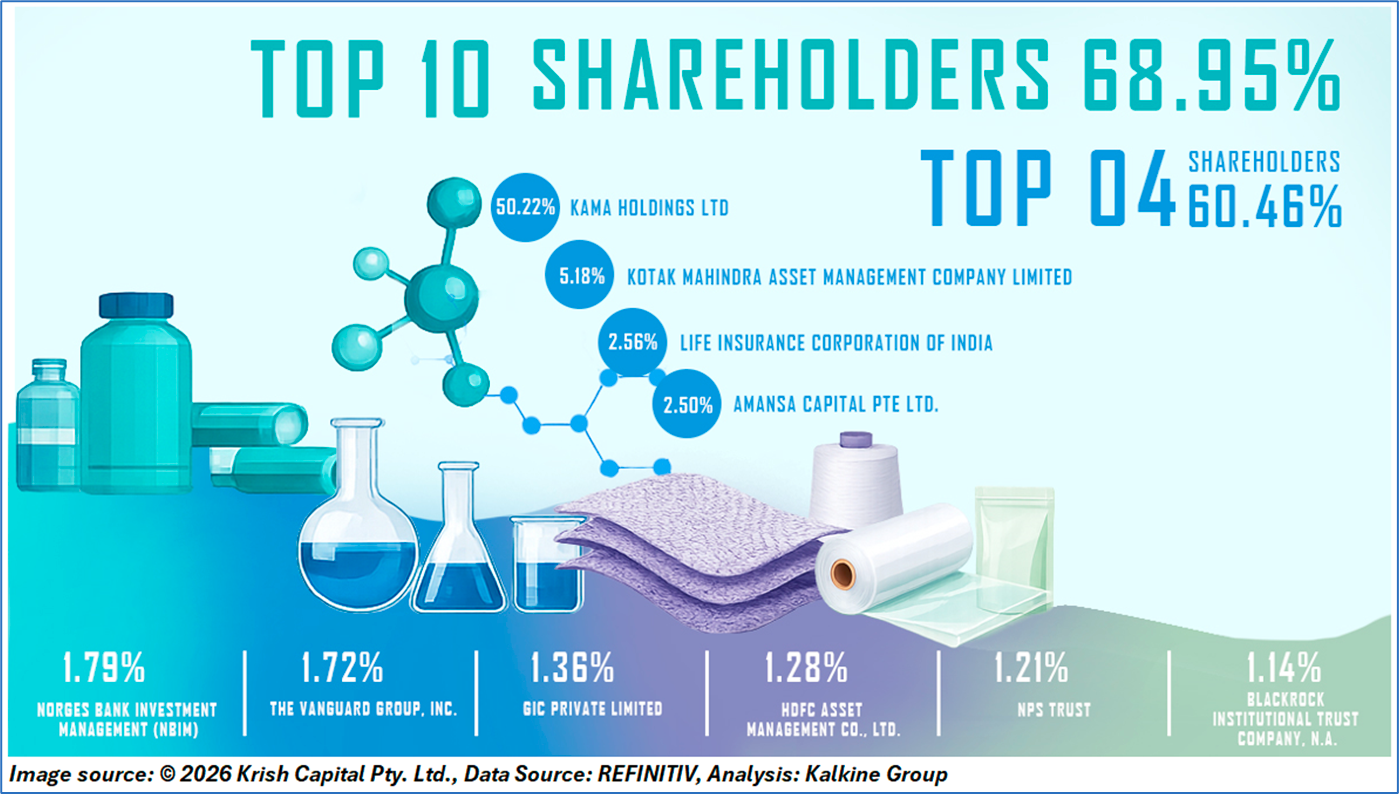
1.3 Top 10 Shareholders:
The top 10 shareholders together form ~68.95% of the total shareholding. Kama Holdings Ltd and Kotak Mahindra Asset Management Company Limited hold maximum stakes of 50.22% and 5.18%, respectively.
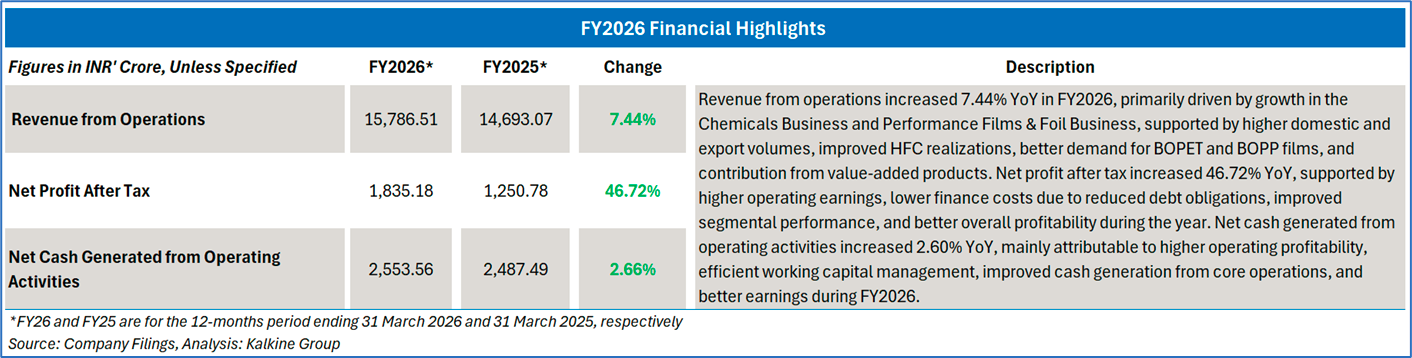
1.4 Key Metrics: SRF’s earnings per share increased to INR 61.91 in FY2026 compared to 42.20 in FY2025. Below is captured other metrics:
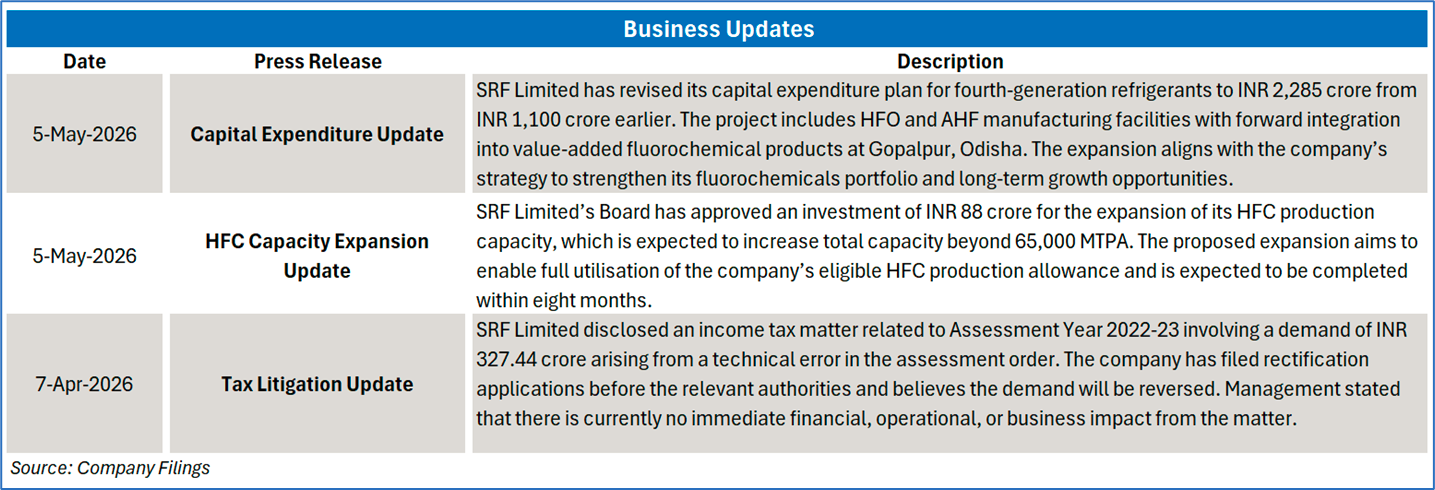
Section 2: Business Updates, Financial and Operational Highlights
2.1 Recent Business Updates:
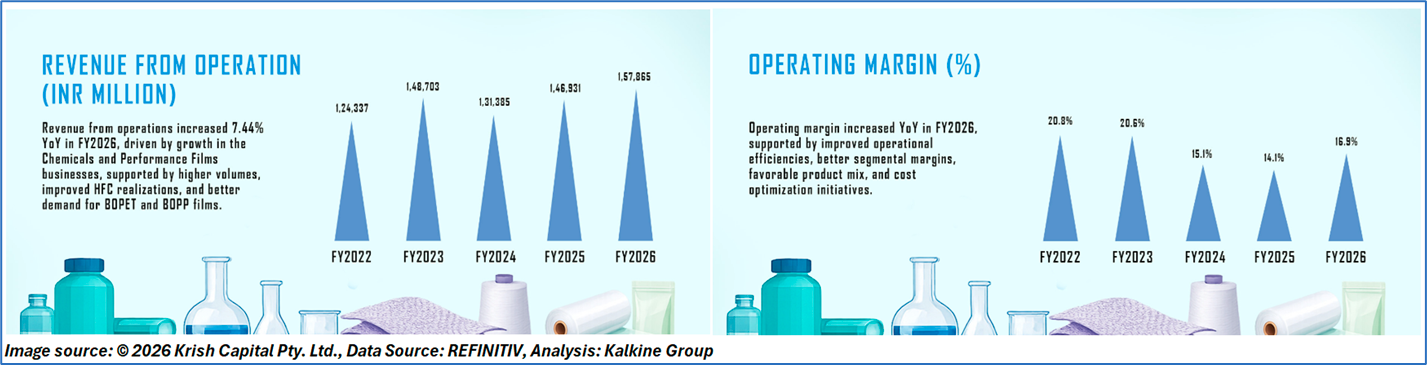
2.2 FY2026 Results Highlights (for the 12 months ended 31 March 2026): Below mentioned are some key financial highlights:
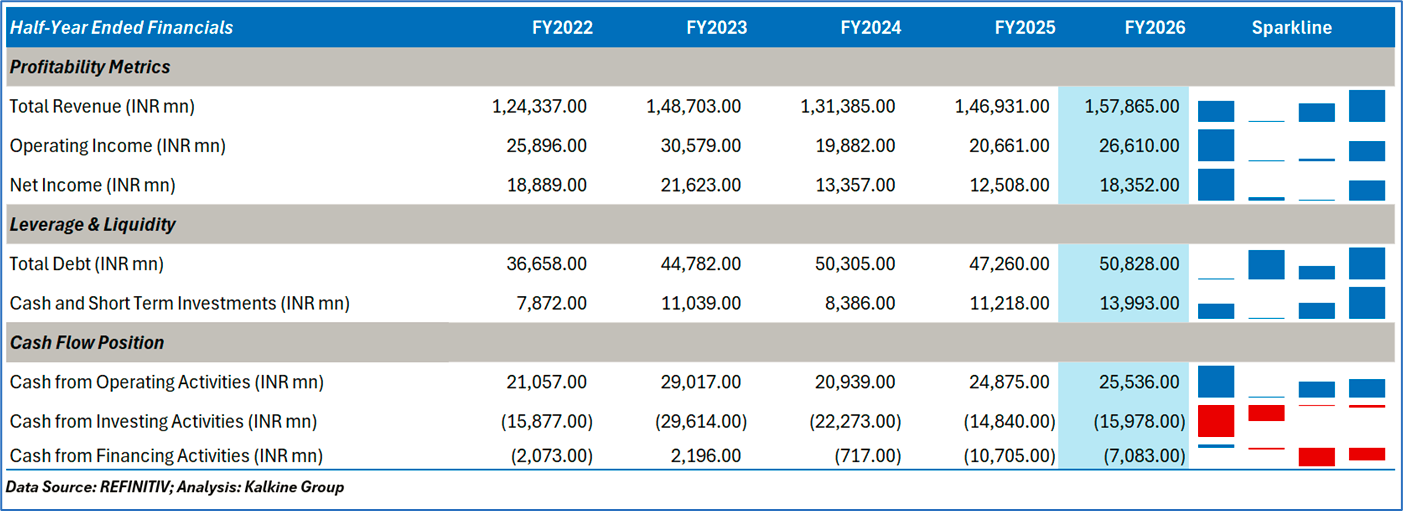
2.3 Historical Financial Trend
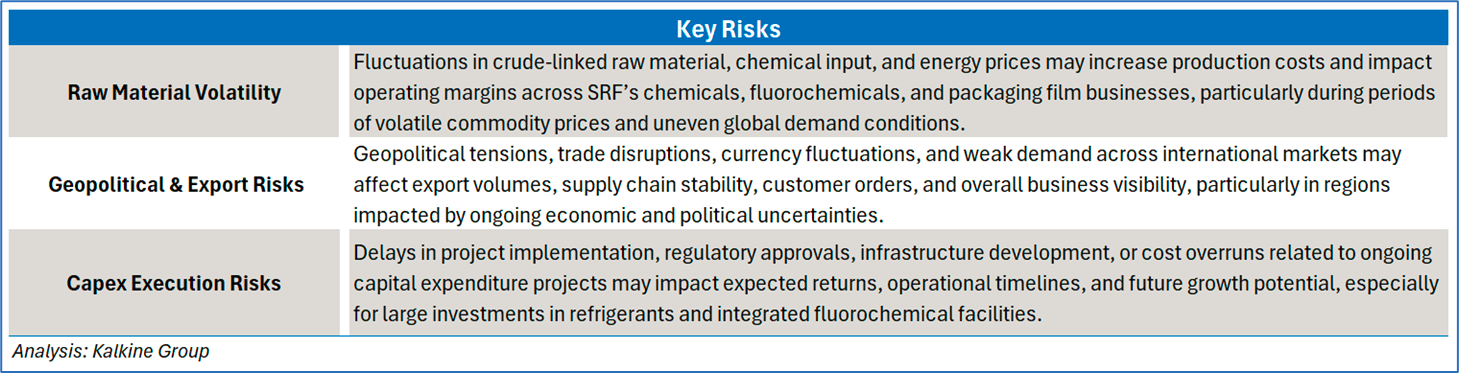
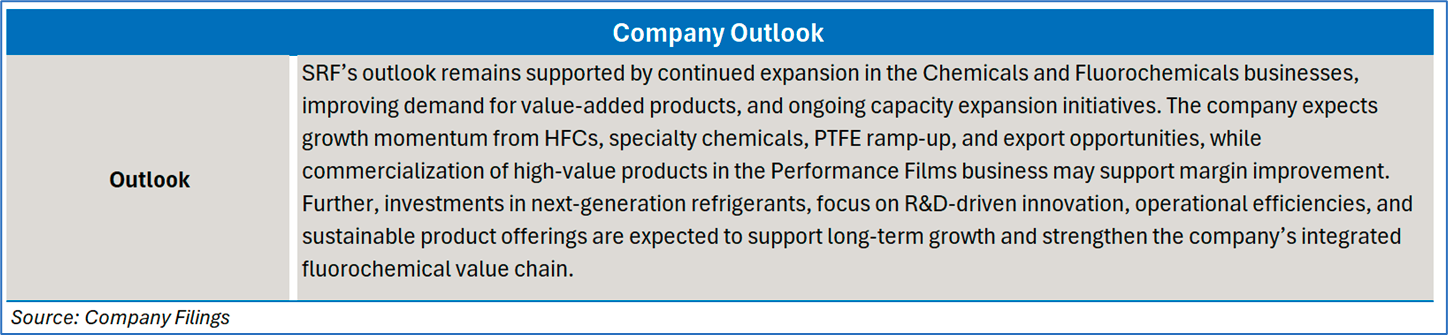
Section 3: Key Risks and Outlook:
Section 4: Stock Recommendation Summary
4.1 Price Performance and Technical Summary
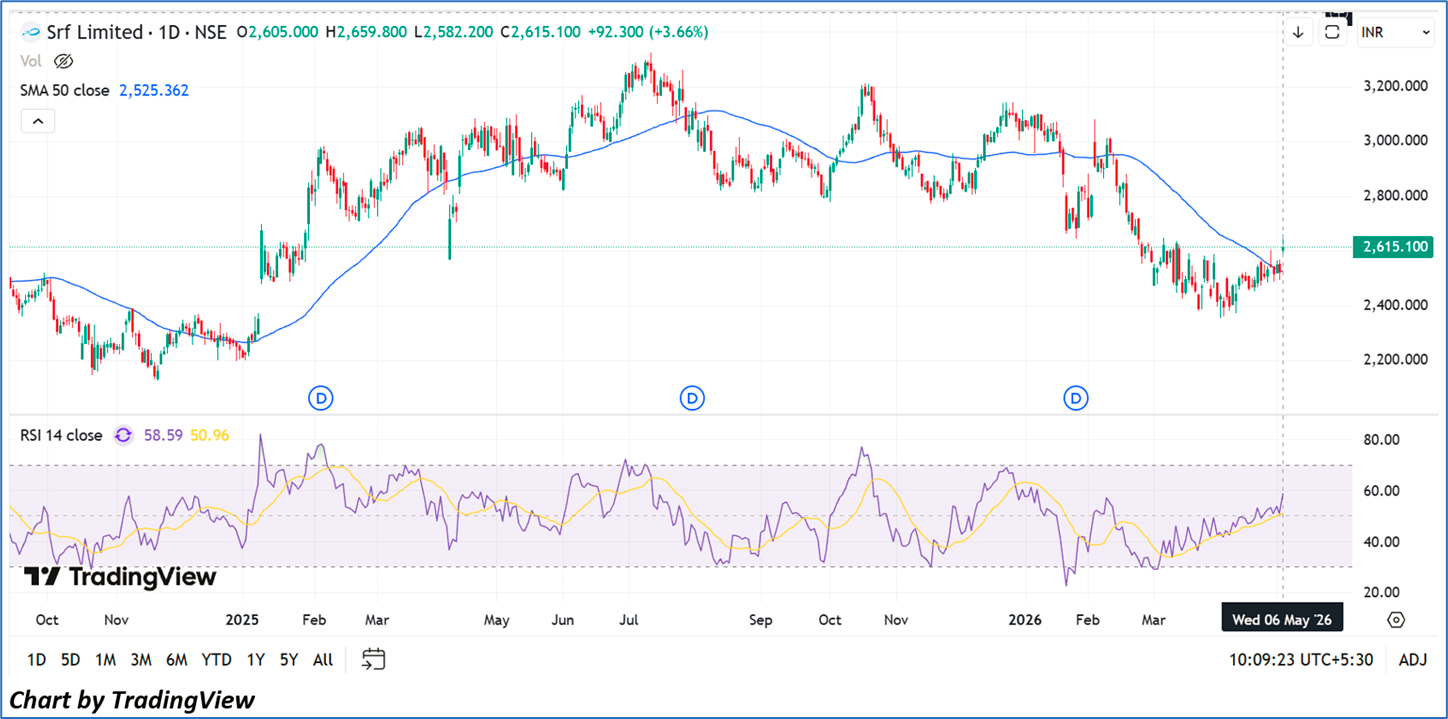
The stock has decreased by ~9.58% in the last three months, whereas over the past six months, stock has decreased by ~10.23%. The stock has a 52-week low and 52-week high of INR 2,355.00 and INR 3,325.00, respectively. The stock is currently trading below the midpoint of its 52-week trading range.
4.2 Fundamental Valuation and Stock Recommendation
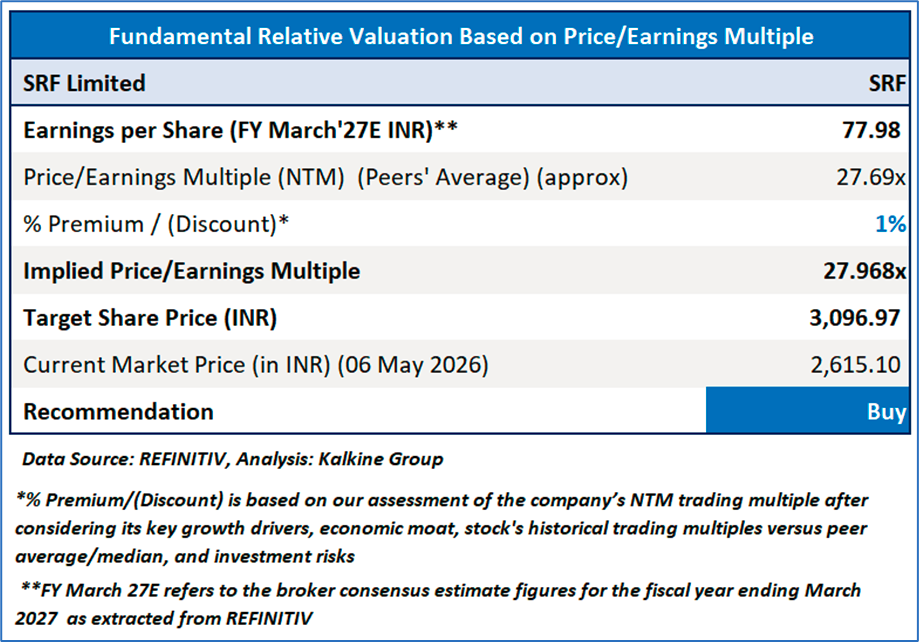
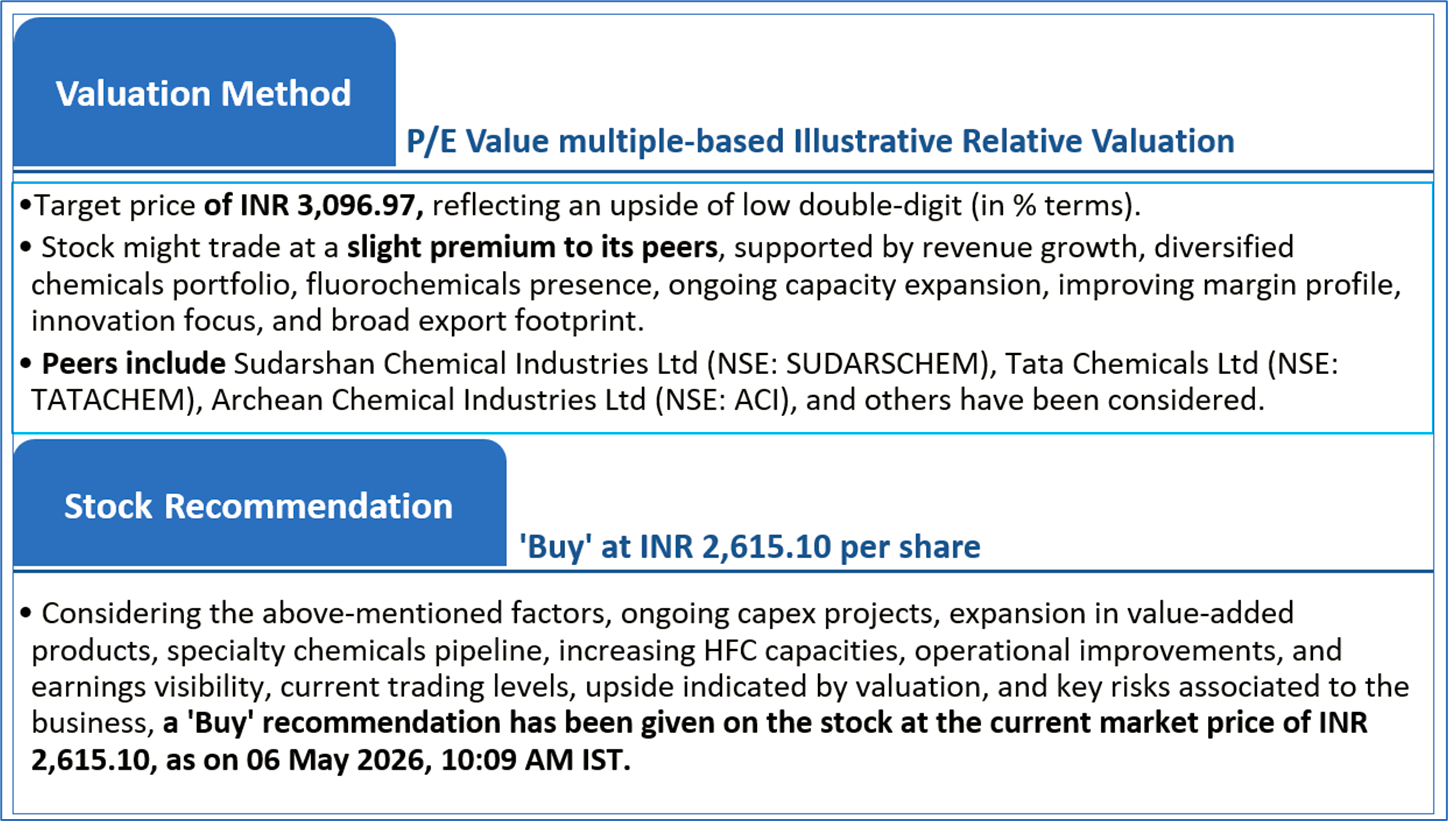
Markets are trading in a highly volatile zone currently due to certain macro-economic issues and geopolitical tensions prevailing. Therefore, it is prudent to follow a cautious approach while investing.
Note 1: Past performance is neither an indicator nor a guarantee of future performance.
Note 2: The reference date for all price data, currency, technical indicators, support, and resistance levels is 06 May 2026. The reference data in this report has been partly sourced from REFINITIV.
Note 3: Investment decisions should be made depending on an individual's appetite for upside potential, risks, holding duration, and any previous holdings. An 'Exit' from the stock can be considered if the Target Price mentioned as per the Valuation and or the technical levels provided have been achieved and is subject to the factors discussed above.
Note 4: Dividend Yield may vary as per the stock price movement.
Note 5: Kalkine reports are prepared based on the stock prices captured either from REFINITIV or Trading View. Typically, REFINITIV or Trading View may reflect stock prices with a delay which could be a lag of 25-30 minutes. There can be no assurance that future results or events will be consistent with the information provided in the report. The information is subject to change without any prior notice.
Technical Indicators Defined: -
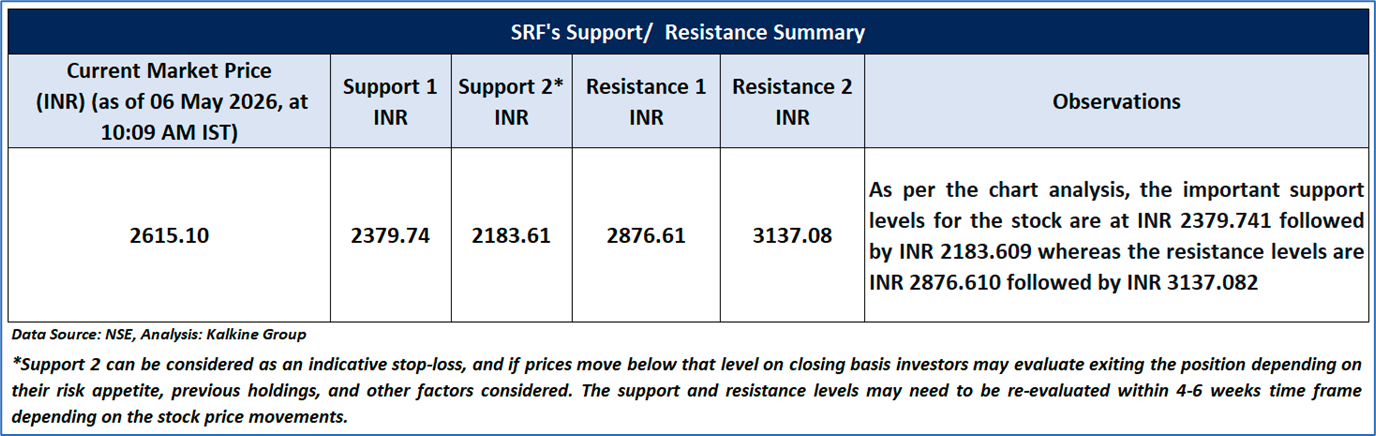
Support: A level at which the stock prices tend to find support if they are falling, and a downtrend may take a pause backed by demand or buying interest. Support 1 refers to the nearby support level for the stock and if the price breaches the level, then Support 2 may act as the crucial support level for the stock.
Resistance: A level at which the stock prices tend to find resistance when they are rising, and an uptrend may take a pause due to profit booking or selling interest. Resistance 1 refers to the nearby resistance level for the stock and if the price surpasses the level, then Resistance 2 may act as the crucial resistance level for the stock.
Stop-loss: It is a level to protect further losses in case of unfavourable movement in the stock prices.
Past performance is not a reliable indicator of future performance.

 NZ
 UK
 US
 AU
 IND

 CA

 Please wait processing your request...