Section 1: Company Overview and Fundamentals
1.1 Company Overview:
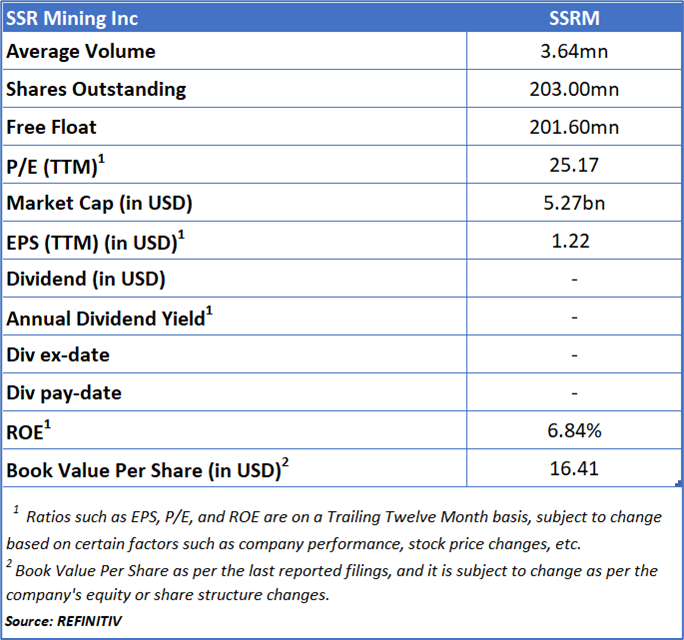
SSR Mining Inc (NASDAQ: SSRM) together with its subsidiaries, is a precious metals mining company with a diversified portfolio of four operating assets across the United States, Türkiye, Canada, and Argentina. The Company focuses on the operation, acquisition, exploration, and development of precious metal resource properties throughout Türkiye and the Americas, producing gold doré alongside copper, silver, lead, and zinc concentrates.
Kalkine’s Low Carbon Research Report covers the Investment Highlights, Low Carbon Emission Initiatives, Key Financial Metrics, Risks, and Technical Analysis along with the Valuation, Target Price, and Recommendation on the stock.
Stock Performance:
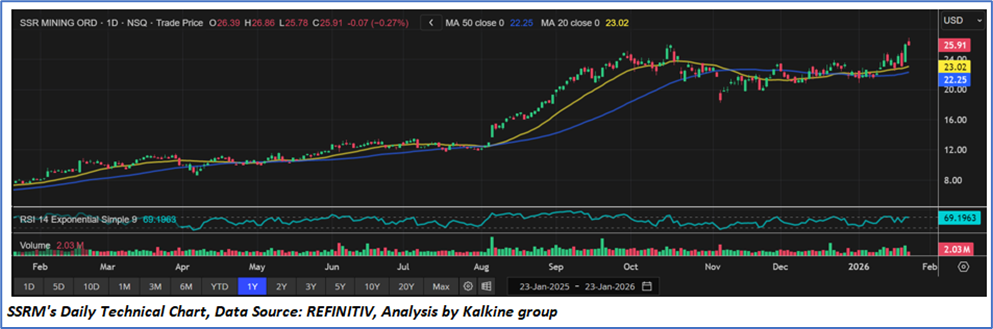
- The stock is in a clear medium-term uptrend, with price consistently trading above key moving averages. Moreover, the 20-day moving average (USD 23.02) remains above the 50-day moving average (USD 22.25), confirming a bullish trend structure. Both short- and medium-term moving averages are sloping upward, reflecting improving momentum.
- A strong rally in mid-2025 was followed by a healthy consolidation phase in Q4, indicating accumulation rather than distribution. Recent price action near USD 25.9 suggests an attempt to resume the primary uptrend.
- The RSI (~69) is close to overbought levels but shows no bearish divergence, implying sustained buying interest.
- Volume is stable with mild expansion on up-moves, pointing to steady institutional participation.
1.2 Why do Low Carbon Emissions matter?
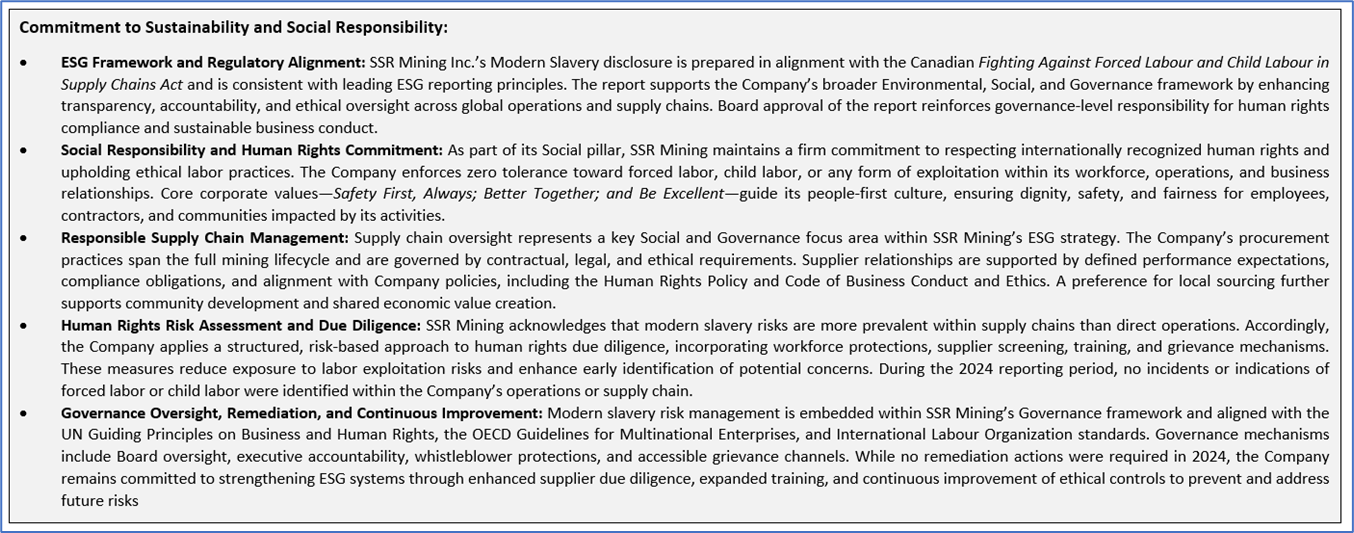
The shift toward a low-carbon economy is one of the most significant challenges of current time, spurred by the urgent need to combat climate change and reduce the environmental impact of corporate activities. This report covers the US-listed low-carbon emission company SSR Mining Inc (NASDAQ: SSRM), that is committed to sustainability and responsible environmental practices.
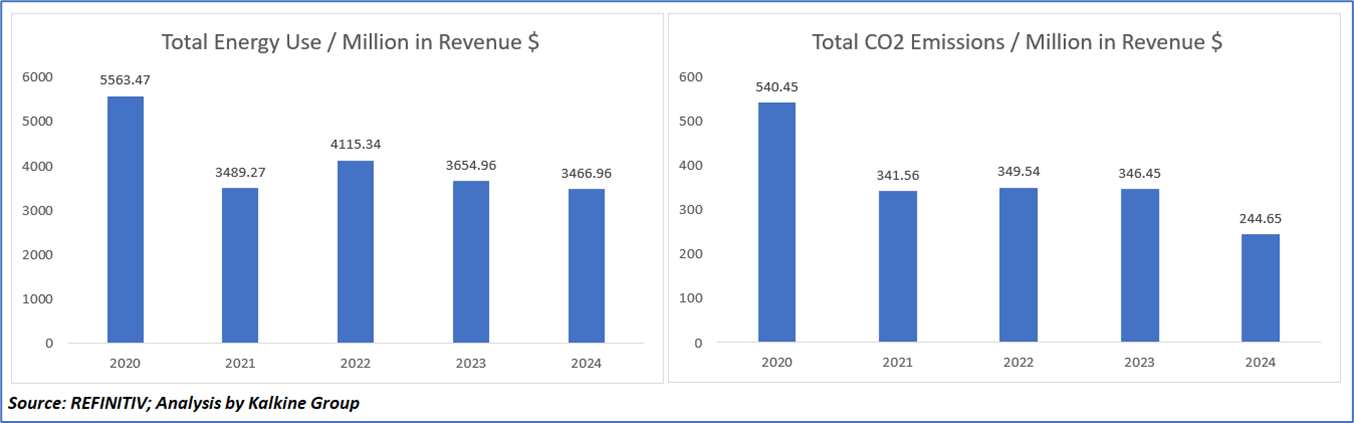
Energy and Carbon Emissions Intensity per Unit of Revenue (2020–2024) - Key Metrics
From an ESG performance standpoint, the trends depicted in the two graphs demonstrate a clear and sustained improvement in the Company’s energy and carbon efficiency over the 2020–2024 period. Total energy use per USD million in revenue declined from 5,563 in 2020 to 3,467 in 2024, representing an approximate 38% reduction, despite temporary increases in 2022 and 2023 that likely reflect operational or revenue-related volatility. More notably, total CO₂ emissions per USD million in revenue fell from 540 in 2020 to 245 in 2024, a reduction of roughly 55%, indicating that emissions intensity improved at a faster pace than energy intensity. This divergence suggests that efficiency gains have been complemented by qualitative improvements in the energy mix and emissions management practices. Overall, the data point to a meaningful decoupling of revenue generation from energy consumption and carbon emissions, reinforcing the Company’s progress toward stronger environmental performance and improved ESG alignment.
Peer Comparison:

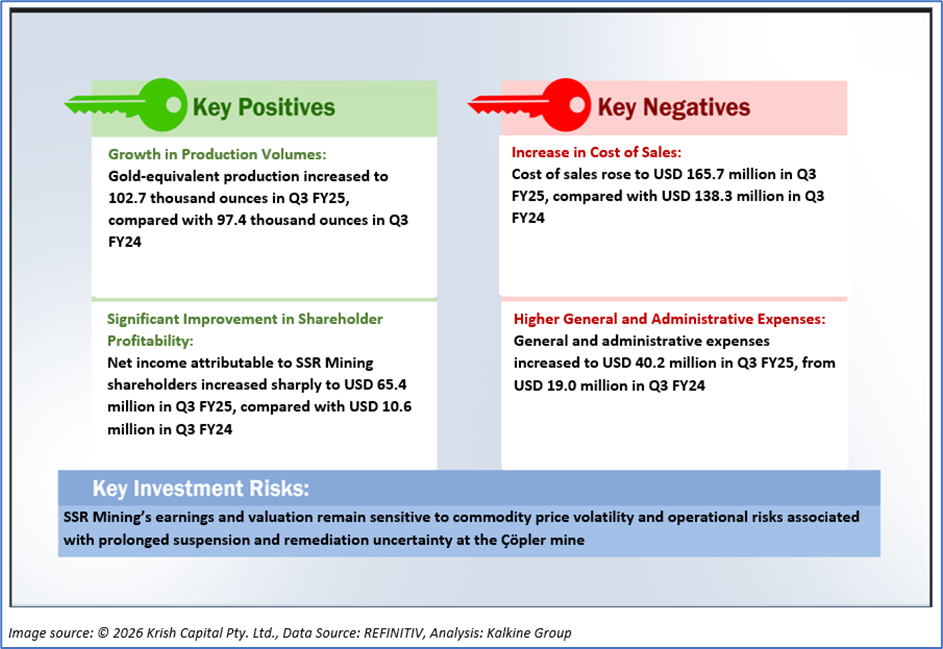
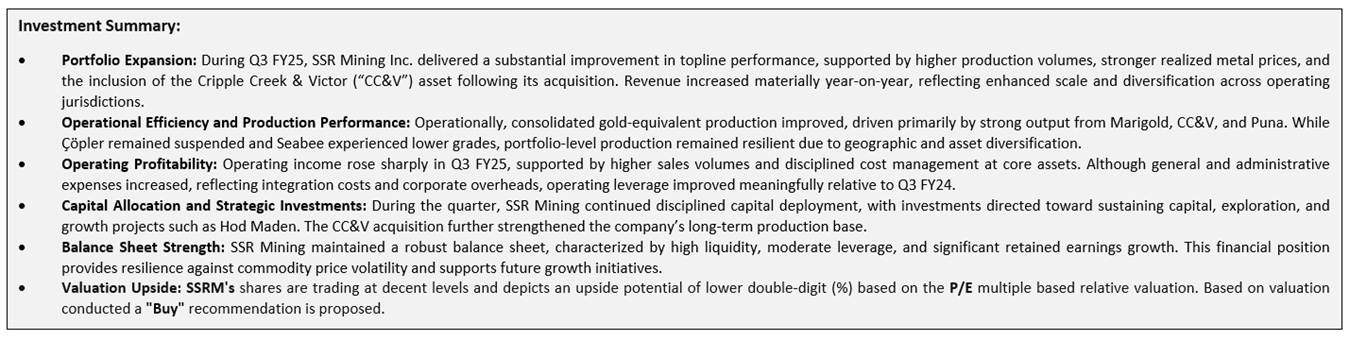
1.2 The Key Positives, Negatives, and Investment summary
1.3 Top 10 shareholders:
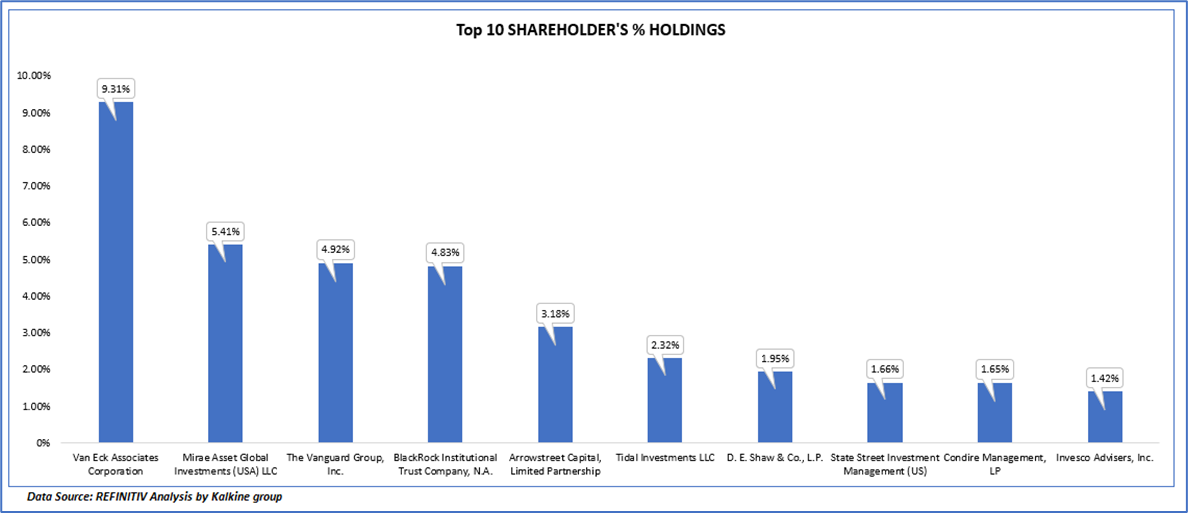
The top 10 shareholders together form ~36.64% of the total shareholding, signifying concentrated shareholding. Van Eck Associates Corporation and Mirae Asset Global Investments (USA) LLC are the biggest shareholders, holding the maximum stake in the company at 9.31% and 5.41%, respectively.
1.4 Key Metrics
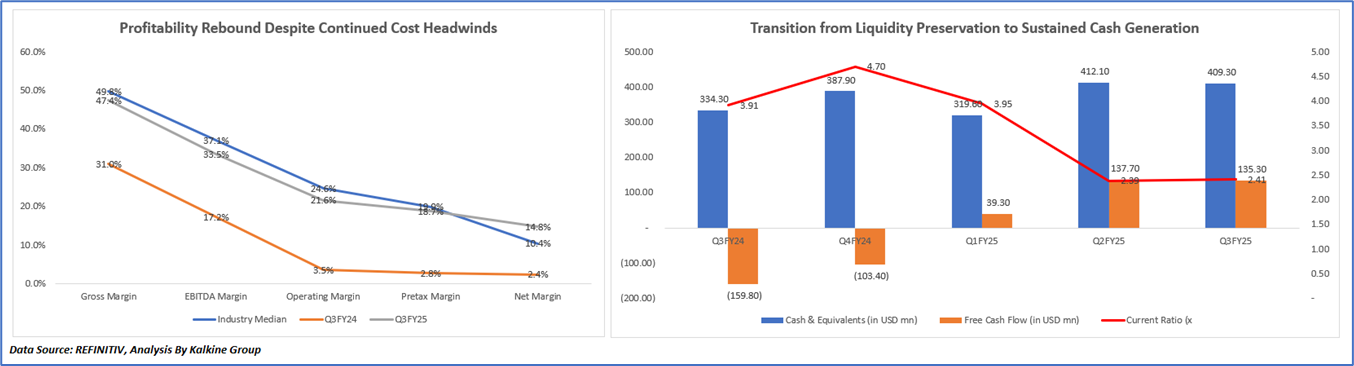
The profitability trajectory of the company indicates a clear margin recovery for SSR Mining in Q3 FY25 versus Q3 FY24, reflecting operational normalization and improved earnings quality, while still trailing industry benchmarks. Gross margin improved significantly to 47.4% in Q3 FY25 from 31.0% in Q3 FY24, approaching the industry median of 49.8%, supported by higher realized metal prices, improved production volumes, and better cost absorption across key assets. EBITDA margin expanded to 33.5% from 17.2%, narrowing the gap with the industry median of 37.1%, as operating leverage improved and prior-year disruptions eased. Operating margin showed the sharpest rebound, rising to 21.6% from 3.5%, though it remains below the industry median of 24.6%, constrained by ongoing care-and-maintenance costs at Çöpler and elevated corporate expenses. Pretax margin improved to 18.7% from 2.8%, moderately below the industry median of 19.9%, reflecting improved operating profitability offset by foreign exchange losses and interest costs. Net margin strengthened materially to 14.8% from 2.4%, marginally above the industry median of 10.4%, highlighting a stronger bottom-line recovery and improved earnings conversion relative to peers, despite residual cost and operational headwinds.
Moreover, the liquidity profile of the company reflects SSR Mining’s transition from a liquidity-defensive phase in FY24 to a cash-generative phase in FY25, driven by improving operations and portfolio expansion. In Q3 FY24 and Q4 FY24, cash balances increased despite negative free cash flow, as liquidity was preserved through balance-sheet management while cash outflows were driven by elevated capital spending, working capital movements, and ongoing remediation and care-and-maintenance costs at Çöpler, resulting in an elevated current ratio. In Q1 FY25, free cash flow turned positive as operating performance improved and one-off cash outflows moderated, although cash balances dipped and the current ratio declined due to higher current liabilities linked to growth investments. The sharp rise in cash and free cash flow in Q2 FY25 reflects strong operating cash generation and the contribution from the CC&V acquisition, while the lower current ratio indicates a more efficient but expanded working-capital structure. By Q3 FY25, cash levels stabilized alongside sustained free cash flow, indicating a balance between strong internal cash generation and continued capital deployment, with the current ratio normalizing at a healthy level consistent with the company’s larger operating scale.
Section 2: Business Updates and Corporate Business Highlights
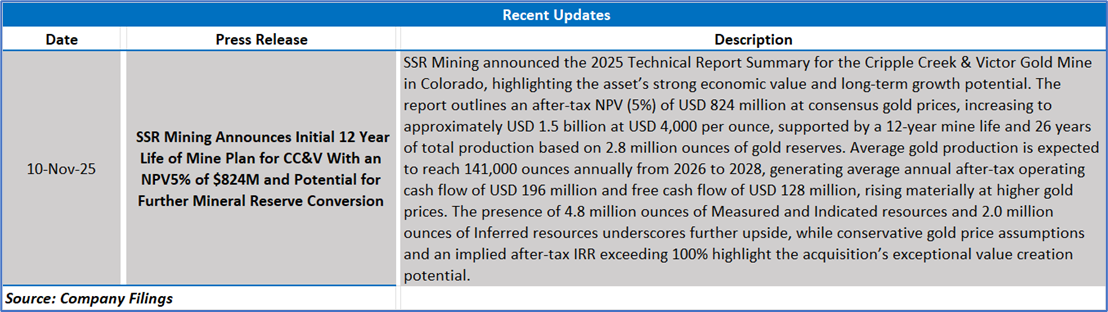
2.1 Key Business Updates:
2.2 Insights of Q3 FY25:

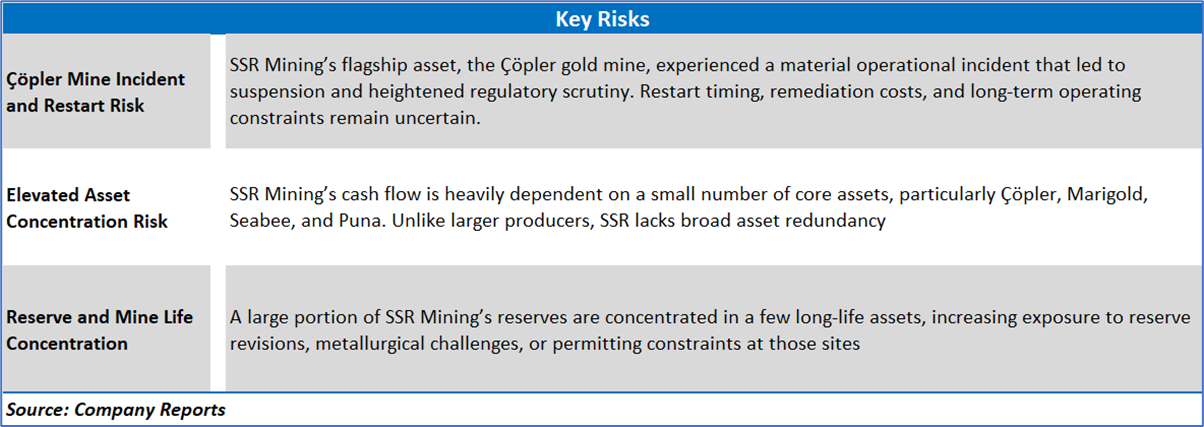
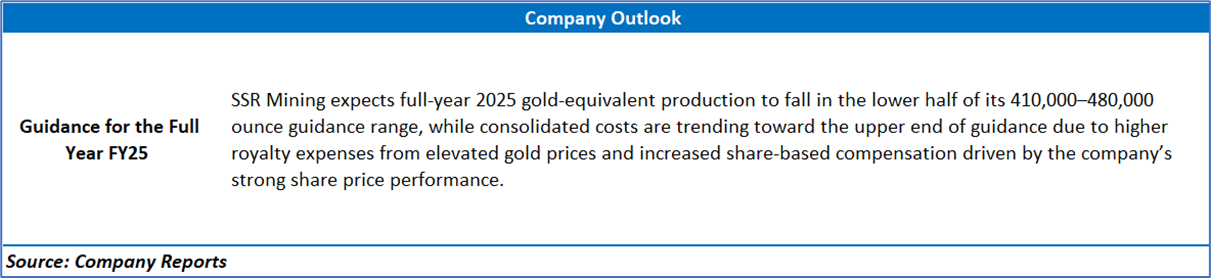
Section 3: Key Risks & Outlook
Section 4: Stock Recommendation Summary:
4.1 Price Performance and Technical Summary:
Stock Performance:
- The stock is in a clear medium-term uptrend, with price consistently trading above key moving averages. Moreover, the 20-day moving average (USD 23.02) remains above the 50-day moving average (USD 22.25), confirming a bullish trend structure. Both short- and medium-term moving averages are sloping upward, reflecting improving momentum.
- A strong rally in mid-2025 was followed by a healthy consolidation phase in Q4, indicating accumulation rather than distribution. Recent price action near USD 25.9 suggests an attempt to resume the primary uptrend.
- The RSI (~69) is close to overbought levels but shows no bearish divergence, implying sustained buying interest.
- Volume is stable with mild expansion on up-moves, pointing to steady institutional participation.
4.2 Fundamental Valuation
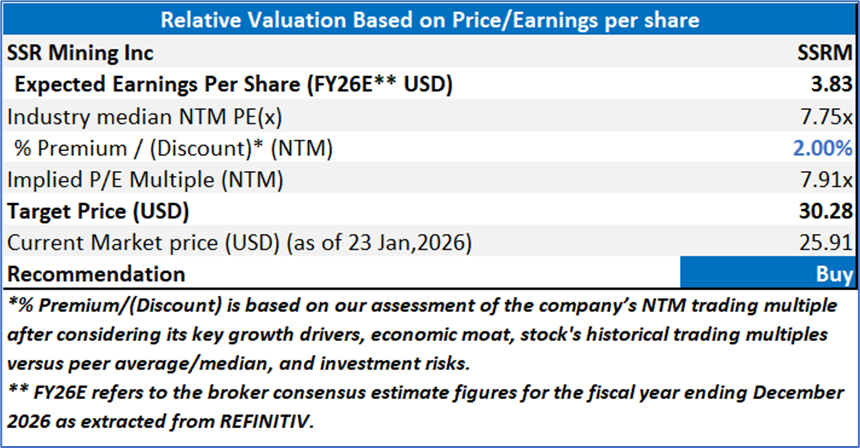
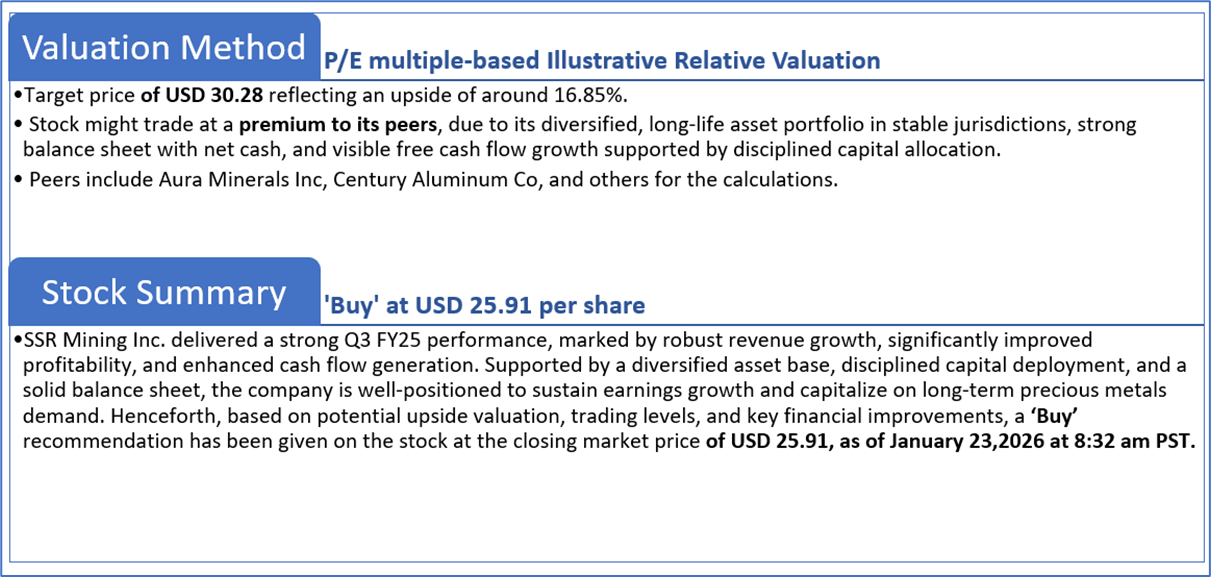
Valuation Methodology: Price-Earnings Multiple Based Relative Valuation
Markets are trading in a highly volatile zone currently due to certain macroeconomic issues and geopolitical tensions prevailing. Therefore, it is prudent to follow a cautious approach while investing.
Note 1: Past performance is not a reliable indicator of future performance.
Note 2: The reference date for all price data, currency, technical indicators, support, and resistance levels is Jan 23,2026. The reference data in this report has been partly sourced from REFINITIV.
Note 3: Investment decisions should be made depending on an individual's appetite for upside potential, risks, holding duration, and any previous holdings. An 'Exit' from the stock can be considered if the Target Price mentioned as per the Valuation and or the technical levels provided has been achieved and is subject to the factors discussed above.
Note 4: The report publishing date is as per the Pacific Time Zone.
Technical Indicators Defined: -
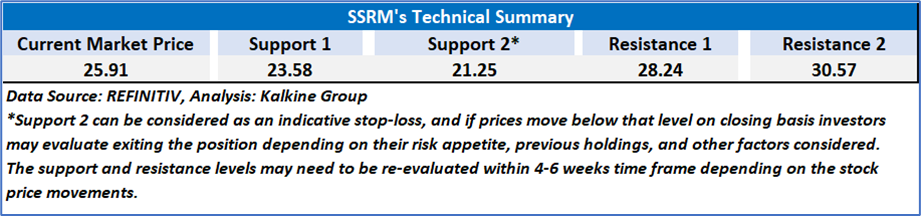
Support: A level at which the stock prices tend to find support if they are falling, and a downtrend may take a pause backed by demand or buying interest. Support 1 refers to the nearby support level for the stock and if the price breaches the level, then Support 2 may act as the crucial support level for the stock.
Resistance: A level at which the stock prices tend to find resistance when they are rising, and an uptrend may take a pause due to profit booking or selling interest. Resistance 1 refers to the nearby resistance level for the stock and if the price surpasses the level, then Resistance 2 may act as the crucial resistance level for the stock.
Stop-loss: It is a level to protect against further losses in case of unfavorable movement in the stock prices.
Past performance is not a reliable indicator of future performance.

 NZ
 UK
 US
 AU
 IND

 CA

 Please wait processing your request...