Section 1: Company Fundamentals
1.1 Company Overview and Performance summary
Company Overview:
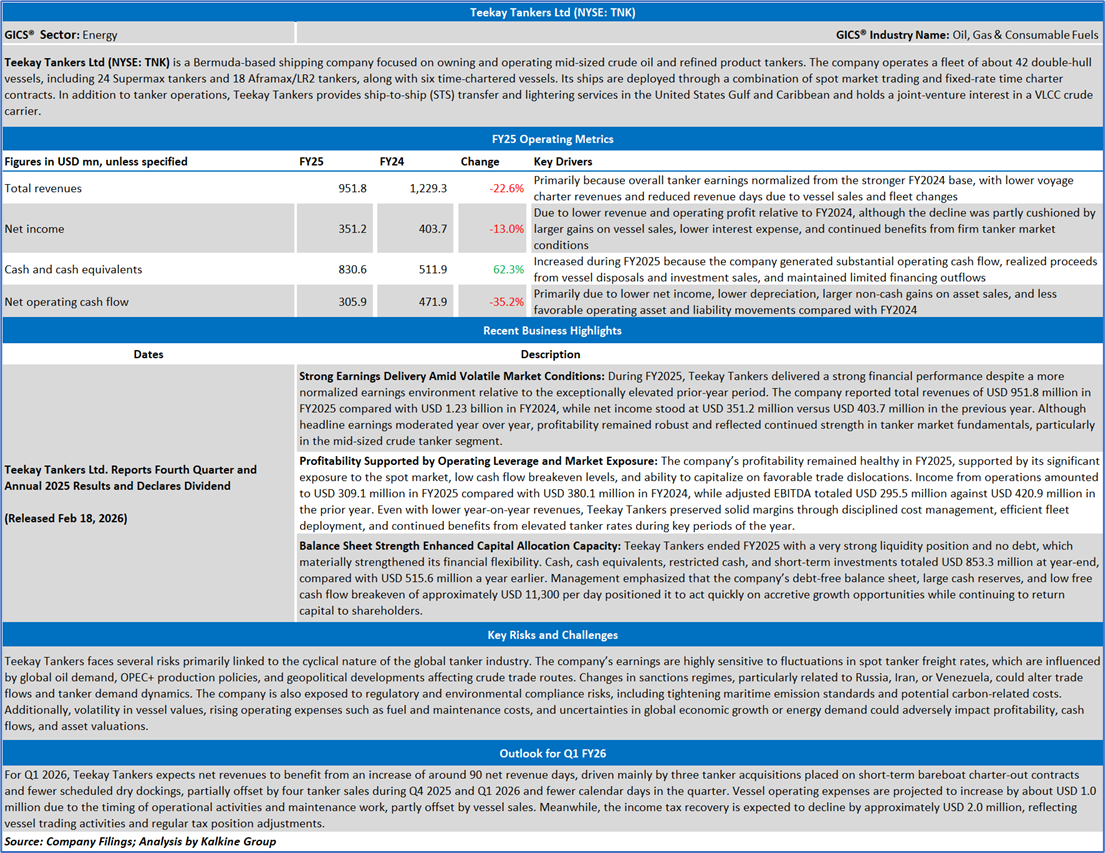
Teekay Tankers Ltd (NYSE: TNK) is a Bermuda-based shipping company focused on owning and operating mid-sized crude oil and refined product tankers. The company operates a fleet of about 42 double-hull vessels, including 24 Supermax tankers and 18 Aframax/LR2 tankers, along with six time-chartered vessels. Its ships are deployed through a combination of spot market trading and fixed-rate time charter contracts. In addition to tanker operations, Teekay Tankers provides ship-to-ship (STS) transfer and lightering services in the United States Gulf and Caribbean and holds a joint-venture interest in a VLCC crude carrier.
This US Inflation Report covers the Company Overview & Price performance, Summary table, Key positives & negatives, Key metrics, Company details, technical guidance & Stock recommendation, and Price chart.
Price Performance:
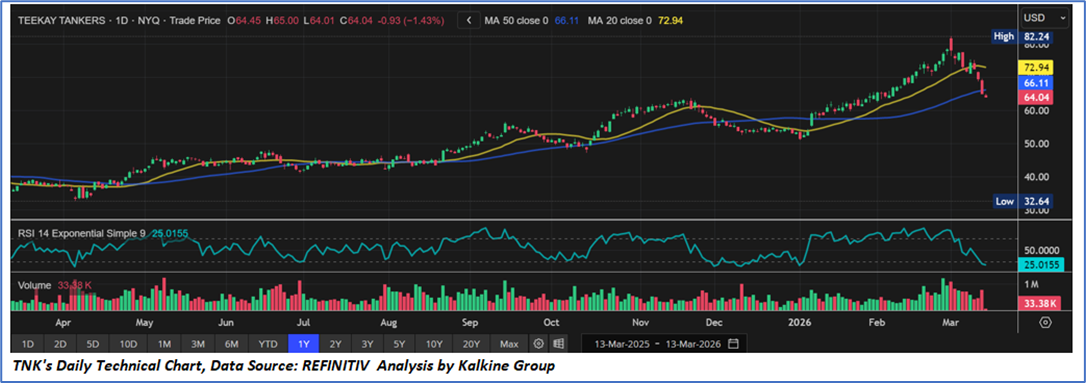
- The stock has been in a sustained medium-term uptrend since mid-2025, forming higher highs and higher lows. However, the recent price action shows a short-term correction following the peak near USD 82.24.
- The price has recently fallen below the 20-day moving average (USD 72.94) and is approaching the 50-day moving average (USD 66.11), indicating weakening short-term momentum. A sustained move below the 50-day average could signal a deeper consolidation phase.
- The RSI near 25 indicates that the stock is approaching oversold territory, suggesting that selling pressure may be nearing exhaustion and a technical rebound could emerge if support levels hold.
- Recent declines have been accompanied by moderate volume, indicating controlled profit-taking rather than aggressive distribution.
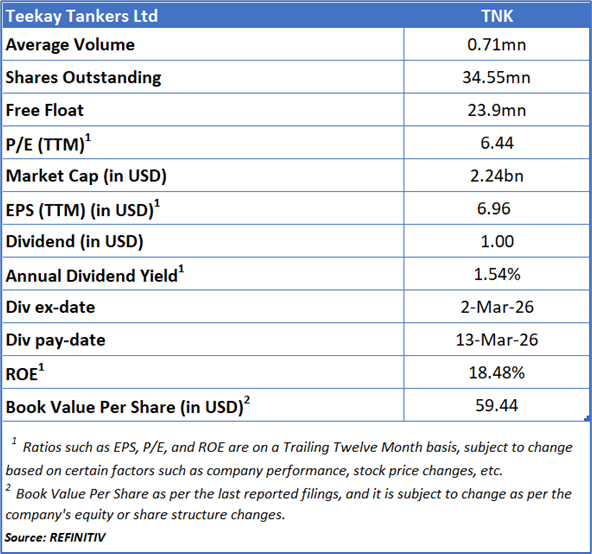
1.2 Summary Table
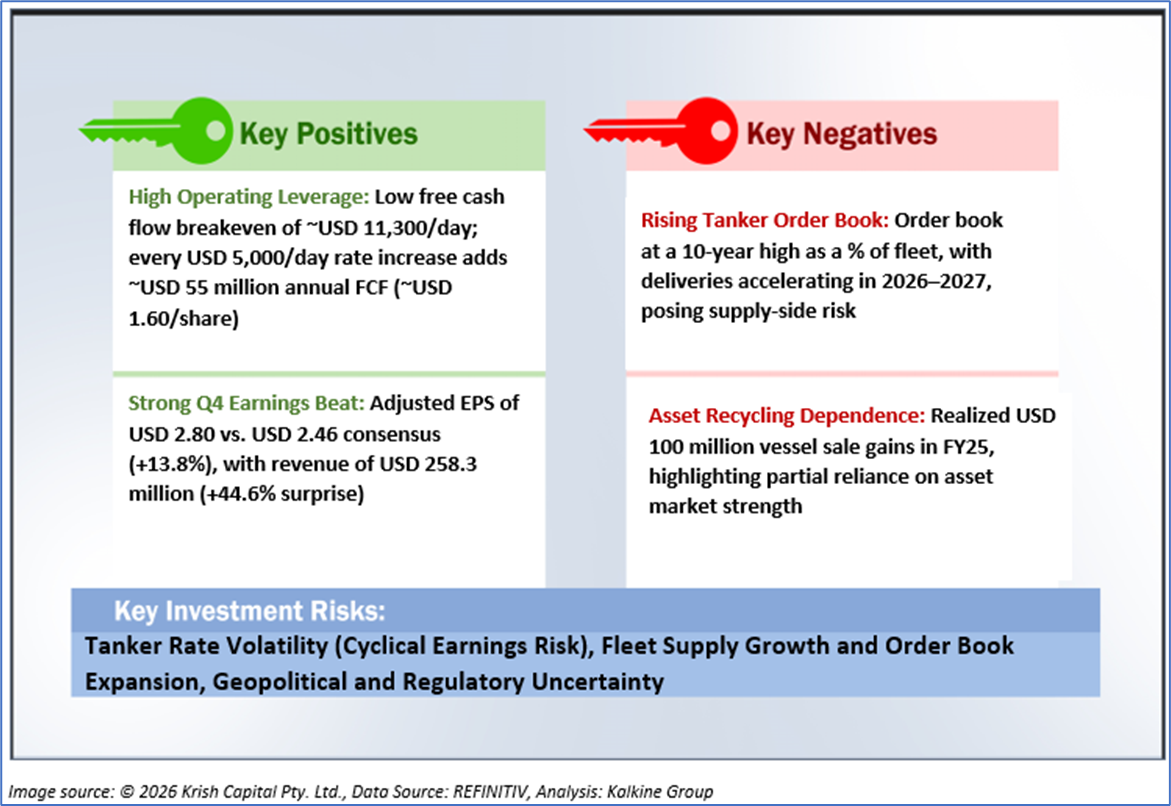
1.3 The Key Positives & Negatives
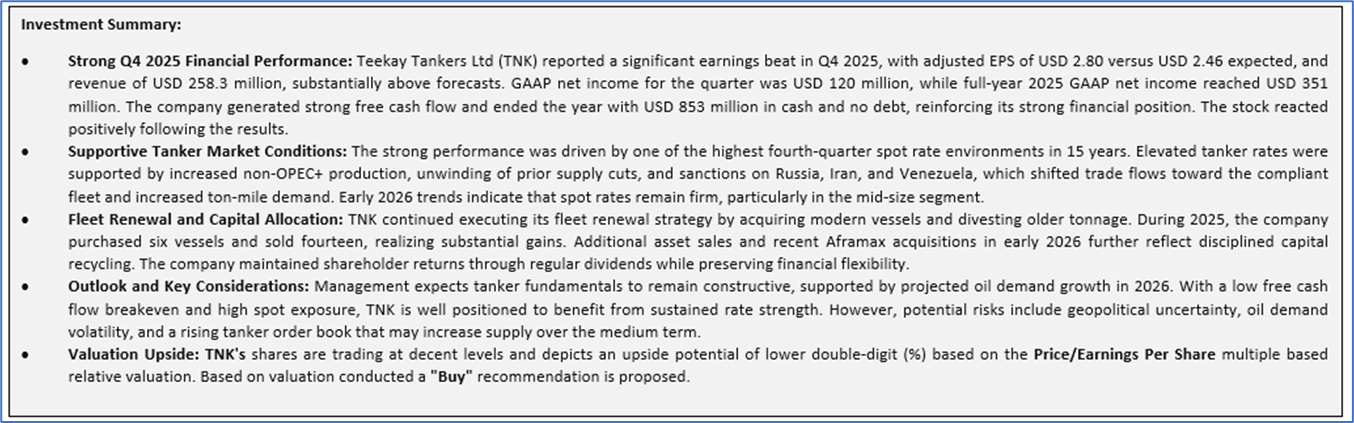
1.4 Key Metrics
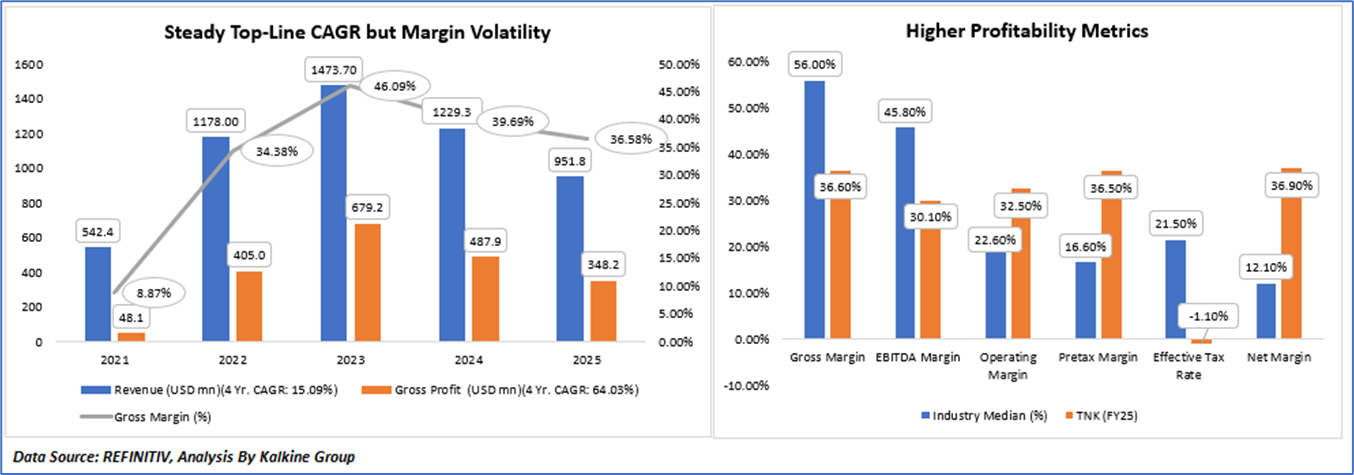
- Revenue and Growth Trend: Teekay Tankers (TNK) delivered a 4-year revenue CAGR of 15.1%, increasing from USD 542 million (2021) to a peak of USD 1,473.7 million (2023), before moderating to USD 951.8 million (2025). The sharp expansion during 2022–2023 reflects the exceptional tanker rate cycle driven by supply disruptions and elevated spot markets. However, revenue declined in 2024 and further in 2025 as tanker rates normalized from cyclical highs. The trajectory highlights TNK’s high operating leverage and sensitivity to freight rate volatility.
- Profitability Expansion and Normalization: Gross profit exhibited a significantly stronger 4-year CAGR of 64.0%, rising from USD 48.1 million (2021) to USD 348.2 million (2025), despite the recent top-line moderation. Gross margin expanded materially from 9% (2021) to a peak of 46.1% (2023) before easing to 36.6% (2025). The margin expansion during the upcycle demonstrates strong operating leverage in a rising rate environment, while the decline post-2023 reflects softening spot rates. Importantly, FY25 gross margins remain structurally higher than pre-cycle levels, indicating improved fleet positioning and cost structure discipline.
- Margin Profile vs. Industry: In FY25, TNK’s Gross Margin (36.6%) trails the industry median (56.0%), and EBITDA Margin (30.1%) is below the industry median (45.8%), suggesting comparatively lower upstream margin capture at the operating level. However, TNK outperforms meaningfully at the bottom line: Operating Margin (32.5% vs. 22.6% industry), Pretax Margin (36.5% vs. 16.6%), and Net Margin (36.9% vs. 12.1%). The negative effective tax rate (-1.1%) further enhanced net profitability in FY25. This divergence indicates efficient cost management below EBITDA level, gains from vessel sales, financial discipline, and potential tax benefits.
- Overall Financial Assessment and Summary: TNK’s financial profile reflects a classic cyclical shipping model with strong operating leverage to tanker rates. The company experienced extraordinary profitability during the 2022–2023 rate Supercycle, followed by normalization in 2024–2025. Despite revenue contraction from peak levels, profitability metrics remain materially stronger than pre-cycle years. While gross and EBITDA margins are below industry medians, superior operating and net margins demonstrate disciplined capital allocation, asset monetization gains, and effective cost control. Overall, TNK remains financially robust but structurally exposed to tanker rate cyclicality, making forward performance highly dependent on freight market conditions.
Section 2: Teekay Tankers Ltd (NYSE: TNK) (“Buy” at the current market price of USD 64.04, as of Mar 13,2026 at 6:55 am PDT)
2.1 Company Details
2.2 Technical Guidance and Stock Recommendation
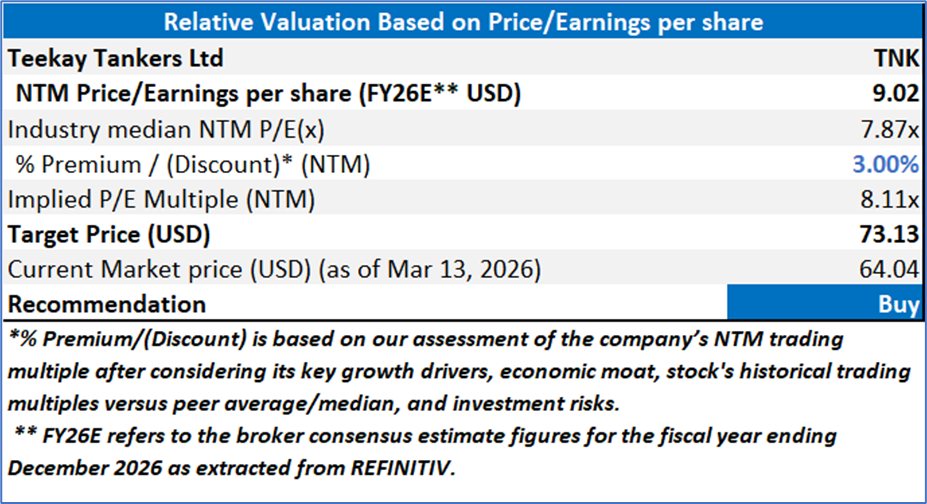
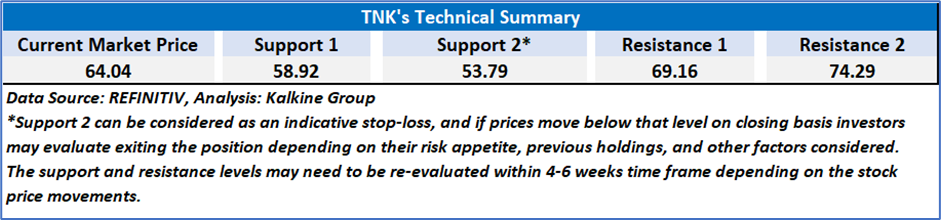
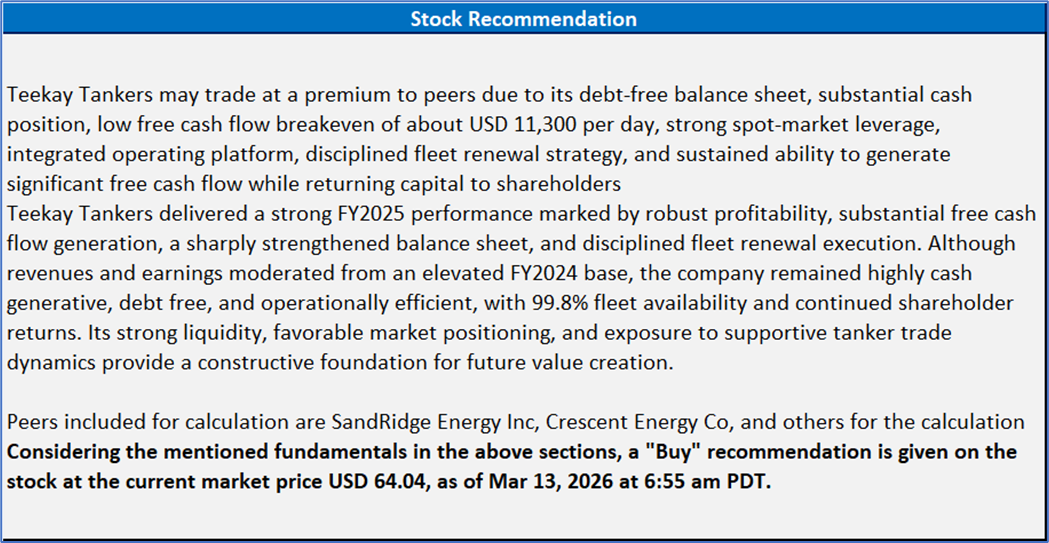
Markets are trading in a highly volatile zone currently due to certain macroeconomic issues and geopolitical tensions prevailing. Therefore, it is prudent to follow a cautious approach while investing.
Note 1: Past performance is not a reliable indicator of future performance.
Note 2: The reference date for all price data, currency, technical indicators, support, and resistance levels is March 13, 2026. The reference data in this report has been partly sourced from REFINITIV.
Note 3: Investment decisions should be made depending on an individual's appetite for upside potential, risks, holding duration, and any previous holdings. An 'Exit' from the stock can be considered if the Target Price mentioned as per the Valuation and or the technical levels provided has been achieved and is subject to the factors discussed above.
Note 4: The report publishing date is as per the Pacific Time Zone.
Technical Indicators Defined: -
Support: A level at which the stock prices tend to find support if they are falling, and a downtrend may take a pause backed by demand or buying interest. Support 1 refers to the nearby support level for the stock and if the price breaches the level, then Support 2 may act as the crucial support level for the stock.
Resistance: A level at which the stocks prices tend to find resistance when they are rising, and an uptrend may take a pause due to profit booking or selling interest. Resistance 1 refers to the nearby resistance level for the stock and if the price surpasses the level, then Resistance 2 may act as the crucial resistance level for the stock.
Stop-loss: It is a level to protect against further losses in case of unfavorable movement in the stock prices.
Past performance is not a reliable indicator of future performance.

 NZ
 UK
 US
 AU
 IND

 CA

 Please wait processing your request...